. 2024 Jul:73:103139.
doi: 10.1016/j.redox.2024.103139. Epub 2024 Apr 27.

SAH is a major metabolic sensor mediating worsening metabolic crosstalk in metabolic syndrome

Affiliations

SAH is a major metabolic sensor mediating worsening metabolic crosstalk in metabolic syndrome

Ramon Cueto et al. Redox Biol. 2024 Jul.

Abstract

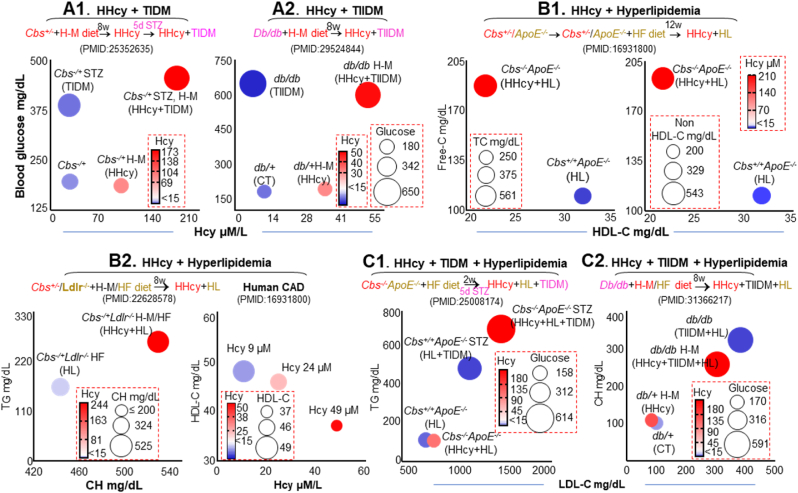
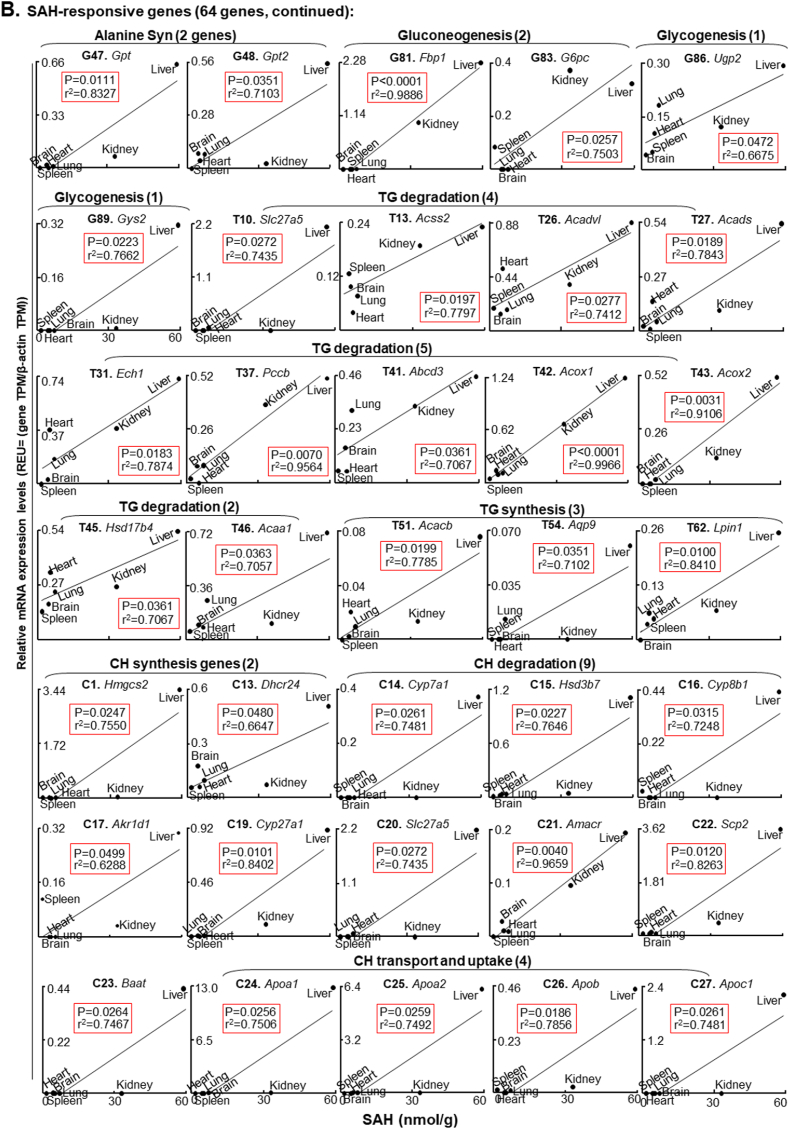
In this study, we observed worsening metabolic crosstalk in mouse models with concomitant metabolic disorders such as hyperhomocysteinemia (HHcy), hyperlipidemia, and hyperglycemia and in human coronary artery disease by analyzing metabolic profiles. We found that HHcy worsening is most sensitive to other metabolic disorders. To identify metabolic genes and metabolites responsible for the worsening metabolic crosstalk, we examined mRNA levels of 324 metabolic genes in Hcy, glucose-related and lipid metabolic systems. We examined Hcy-metabolites (Hcy, SAH and SAM) by LS-ESI-MS/MS in 6 organs (heart, liver, brain, lung, spleen, and kidney) from C57BL/6J mice. Through linear regression analysis of Hcy-metabolites and metabolic gene mRNA levels, we discovered that SAH-responsive genes were responsible for most metabolic changes and all metabolic crosstalk mediated by Serine, Taurine, and G3P. SAH-responsive genes worsen glucose metabolism and cause upper glycolysis activation and lower glycolysis suppression, indicative of the accumulation of glucose/glycogen and G3P, Serine synthesis inhibition, and ATP depletion. Insufficient Serine due to negative correlation of PHGDH with SAH concentration may inhibit the folate cycle and transsulfurarion pathway and consequential reduced antioxidant power, including glutathione, taurine, NADPH, and NAD+. Additionally, we identified SAH-activated pathological TG loop as the consequence of increased fatty acid (FA) uptake, FA β-oxidation and Ac-CoA production along with lysosomal damage. We concluded that HHcy is most responsive to other metabolic changes in concomitant metabolic disorders and mediates worsening metabolic crosstalk mainly via SAH-responsive genes, that organ-specific Hcy metabolism determines organ-specific worsening metabolic reprogramming, and that SAH, acetyl-CoA, Serine and Taurine are critical metabolites mediating worsening metabolic crosstalk, redox disturbance, hypomethylation and hyperacetylation linking worsening metabolic reprogramming in metabolic syndrome.

Keywords: Hyperhomocysteinemia; Metabolic syndrome; Redox; S-Adenosyl-homocysteine (SAH); Serine; Taurine.


Conflict of interest statement

Declaration of competing interest The authors declare that they have no conflict of interest.

Figures

Image 1
Graphical abstract
Fig. 1
Fig. 1
Metabolic analysis and database mining strategy. A total of 324 metabolic genes were chosen from three systems: Hcy (119), glucose-related (95), and Lipid (66 for triglyceride and 44 for cholesterol metabolism) from the NCBI database. The mRNA expression patterns of these genes were analyzed across 21 human and 20 mouse organs using the NCBI Unigene EST database. Organs were categorized based on gene enrichment levels. Hcy metabolites were measured in 6 mouse organs (heart, liver, lung, kidney, spleen, and brain) using LC-ESI-MS/MS. Simple linear regression analysis was conducted to identify genes responsive to Hcy metabolites. The responsive genes were then utilized to identify corresponsive metabolic changes, construct protein-protein interaction networks, and identify organ-specific metabolic features related to Hcy metabolites. Finally, genetic-metabolic models were established for how Hcy metabolites contribute to metabolic reprogramming, crosstalk, and oxidative stress. Abbreviations: Hcy, homocysteine; SAH, S-adenosylhomocysteine; SAM, S-adenosylmethionine; HM, homocysteine-methionine; CH, cholesterol; TG, triglyceride.
Fig. 2
Fig. 2
Identification of metabolic worsening crosstalk between HHcy, hyperglycemia and hyperlipidemia. We previously examined plasma metabolites in mice with concurrent metabolic disorder and in coronary artery disease (CAD) patients. Various mouse models were utilized to simulate metabolic disorders as described in our original publications (PMID# provided): HHcy was induced by TghCBS-Cbs−/− and H-M diet. TIDM/TIIDM were induced by STZ injection or genetic mutation (Leprdb). Hyperlipidemia (HL) was induced by genetic mutations (ApoE−/− or Ldlr−/−) in combination of high fat diet. Male CAD patients were examined as well. Correlation between various metabolites is depicted by plotting metabolite concentration as indicated in the X and Y axes and by the size of circles. Hcy concentration is also referenced by the rainbow color. A. TIDM/TIIDM worsen HHcy, while HHcy worsens HG only in TIDM mice. B. HHcy impaired lipid metabolism in HL mice and human CAD. C. TIDM/TIIDM worsen HHcy and lipid metabolism, but HHcy worsen HG and HL only in TIDM mice. (For interpretation of the references to color in this figure legend, the reader is referred to the Web version of this article.)
Fig. 3
Fig. 3
Organ classification of Hcy, glucose-related, and lipid metabolic system gene expression in human and mouse. Human and mouse organs were categorized into three tiers based on the frequency of highly expressed genes within the respective metabolic systems, as outlined in Supplementary Table 3. Tier 1 organs exhibit a high frequency of gene expression for a given metabolic system (≥50 %). Tier 2 organs demonstrate intermediate frequency (20 % to <50 %), while Tier 3 organs show low frequency (<20 %). A. Distribution of Hcy Metabolic Genes across Organs. B. Distribution of Glucose-Related Metabolic Genes across Organs. C. Distribution of Lipid Metabolic Genes across Organs. Abbreviations: AT, adipose tissue; AG, adrenal gland; BM, bone marrow; ET, embryonic tissue; Intes, Intestine; LN, lymph node, Mus, muscle; Ovar, ovary; Panc, pancreas; Stom, stomach; Test, testis; Thym, thymu).
Fig. 4
Fig. 4
Identification of Hcy metabolite-responsive genes. Linear regression analysis was conducted between mRNA levels of 324 metabolic genes in 3 metabolic systems and concentrations of Hcy metabolites (Hcy, SAH, SAM/SAH ratio) in six mouse organs (brain, heart, lung, kidney, liver, spleen). Relative expression units (REU) of selected genes were calculated (see Supplementary Table 2) and plotted against organ Hcy metabolites concentrations. A total of 88 metabolic genes exhibited significant correlations. A. Hcy-responsive genes. Seven genes showed correlation with Hcy (2 from HM, 3 from glucose-related, and 2 from lipid metabolic systems). B. SAH-responsive genes. Sixty-four genes exhibited correlation with SAH (19 from HM, 12 from glucose-related, and 33 from lipid metabolic systems). C. SAM:SAH-responsive genes. Eighteen genes showed correlation with SAM:SAH ratio (11 from HM, 4 from glucose-related, and 3 from lipid metabolic systems). Abbreviations of the gene's names are provided in Supplementary Tables 1 and 4
Fig. 4
Fig. 4
Identification of Hcy metabolite-responsive genes. Linear regression analysis was conducted between mRNA levels of 324 metabolic genes in 3 metabolic systems and concentrations of Hcy metabolites (Hcy, SAH, SAM/SAH ratio) in six mouse organs (brain, heart, lung, kidney, liver, spleen). Relative expression units (REU) of selected genes were calculated (see Supplementary Table 2) and plotted against organ Hcy metabolites concentrations. A total of 88 metabolic genes exhibited significant correlations. A. Hcy-responsive genes. Seven genes showed correlation with Hcy (2 from HM, 3 from glucose-related, and 2 from lipid metabolic systems). B. SAH-responsive genes. Sixty-four genes exhibited correlation with SAH (19 from HM, 12 from glucose-related, and 33 from lipid metabolic systems). C. SAM:SAH-responsive genes. Eighteen genes showed correlation with SAM:SAH ratio (11 from HM, 4 from glucose-related, and 3 from lipid metabolic systems). Abbreviations of the gene's names are provided in Supplementary Tables 1 and 4
Fig. 5
Fig. 5
SAH-responsive genes are key regulators for metabolic crosstalk between HM, glucose and lipid metabolic systems. Metabolic reprogramming flow diagrams are constructed based on established biochemical pathways and metabolic changed based on identified Hcy metabolites-responsive genes. The 88 Hcy metabolites-responsive genes, as depicted in Fig. 4, are delineated by colored ovals (positive correlation) or rectangles (negative correlation). Hcy metabolites-responsive metabolic process are defined based on corresponsive Hcy metabolites-responsive genes and indicated in bold and italic letter using up (↑) or down (↓) arrows for the activation or suppression of Hcy metabolites-induced metabolic reprogramming. Notably, Serine, G3P, and Taurine (highlighted in orange) may function as cross talking metabolites between systems. The frames colors correspond to Hcy (gold), SAH (red), and SAM:SAH (blue). Detailed abbreviations of genes and metabolites can be found in Supplementary Tables 1 and 4 (For interpretation of the references to color in this figure legend, the reader is referred to the Web version of this article.)
Fig. 6
Fig. 6
Metabolic processes regulated by Hcy metabolites-responsive genes and organ specific metabolic features. A. Metabolic processes regulated by Hcy metabolites-responsive genes. Networks of metabolic processes were established using genes responsive to Hcy metabolites (Hcy, SAH, or SAM:SAH ratio). The proportion of these responsive genes within each described process is presented as a pie chart (see Fig. 5 for processes details). B. Organ-specific features of Hcy metabolism in WT mice. Concentrations of Hcy, SAM, and SAH were assessed via LC-ESI-MS/MS across six organs (heart, liver, lung, kidney, spleen, and brain) in C57BL/6 J mice. Green spheres illustrate Hcy metabolic cycle activities, with font size and arrow thickness indicating relative metabolite levels and estimated pathway activity, respectively. C. Organ-specific metabolic reprogramming in response to elevated Hcy metabolites. We modeled organ-specific metabolic features in targeted metabolic processes (as shown in Fig. 6A) based on the expression levels of Hcy metabolite-responsive genes in each organ (refer to Fig. 4 & Supplementary Table 2). The yellow-orange gradient on the left of each panel represents gene expression abundance, with Hcy metabolite-responsive metabolic reprogramming (activation or inhibition) determined by their corresponding responsive genes. Abbreviations are listed in Supplementary Tables 1 and 4. (For interpretation of the references to color in this figure legend, the reader is referred to the Web version of this article.).
Fig. 6
Fig. 6
Metabolic processes regulated by Hcy metabolites-responsive genes and organ specific metabolic features. A. Metabolic processes regulated by Hcy metabolites-responsive genes. Networks of metabolic processes were established using genes responsive to Hcy metabolites (Hcy, SAH, or SAM:SAH ratio). The proportion of these responsive genes within each described process is presented as a pie chart (see Fig. 5 for processes details). B. Organ-specific features of Hcy metabolism in WT mice. Concentrations of Hcy, SAM, and SAH were assessed via LC-ESI-MS/MS across six organs (heart, liver, lung, kidney, spleen, and brain) in C57BL/6 J mice. Green spheres illustrate Hcy metabolic cycle activities, with font size and arrow thickness indicating relative metabolite levels and estimated pathway activity, respectively. C. Organ-specific metabolic reprogramming in response to elevated Hcy metabolites. We modeled organ-specific metabolic features in targeted metabolic processes (as shown in Fig. 6A) based on the expression levels of Hcy metabolite-responsive genes in each organ (refer to Fig. 4 & Supplementary Table 2). The yellow-orange gradient on the left of each panel represents gene expression abundance, with Hcy metabolite-responsive metabolic reprogramming (activation or inhibition) determined by their corresponding responsive genes. Abbreviations are listed in Supplementary Tables 1 and 4. (For interpretation of the references to color in this figure legend, the reader is referred to the Web version of this article.).
Fig. 7
Fig. 7
Models of Hcy metabolite-responsive worsening metabolic reprogramming and crosstalk, and oxidative stress/redox disturbance. A. Models for Hcy metabolites-responsive metabolic reprogramming and crosstalk. The Hcy cycle acts as a metabolic sensing system, influencing Hcy, glucose-related, and lipid metabolism through genes responsive to Hcy, SAH, and SAM:SAH ratio, exacerbating metabolic crosstalk. B. Models for SAH-responsive oxidative stress and Hcy-suppressive nMt-ETC. SAH-responsive metabolic crosstalk exacerbates oxidative stress and redox disturbances by disrupting reductive molecules and antioxidant capabilities. Hcy-suppressive nMt-ETC genes disrupt electron flow in complex I in Mt-ETC leading to increased mitochondrial ROS production. Metabolic changes influenced by Hcy, SAM-SAH, and SAH are depicted in large rounded rectangles of gold, blue, and red, respectively. Hcy metabolite-responsive genes are indicated by oval or rectangular frames for positive or negative correlations. Up and down arrows (↑/↓) denote the direction of metabolic effects. Different metabolic systems are represented by distinct colors (green for Hcy, pink for glucose-related, and yellow for lipid metabolism). Cross-talking metabolites was identified based on their involvement in more than 1 metabolic system in orange font). Abbreviation: nMt-ETC, mitochondrial electron transport chain; more in Supplementary Tables 1 and 4 (For interpretation of the references to color in this figure legend, the reader is referred to the Web version of this article.)

Similar articles

Cited by

References

    1. Ganguly P., Alam S.F. Role of homocysteine in the development of cardiovascular disease. Nutr. J. 2015;14(6) doi: 10.1186/1475-2891-14-6. - DOI - PMC - PubMed
    1. Wang H., et al. Hyperhomocysteinemia accelerates atherosclerosis in cystathionine beta-synthase and apolipoprotein E double knock-out mice with and without dietary perturbation. Blood. 2003;101:3901–3907. doi: 10.1182/blood-2002-08-2606. - DOI - PubMed
    1. Li J.G., et al. Homocysteine modulates 5-lipoxygenase expression level via DNA methylation. Aging Cell. 2017;16:273–280. doi: 10.1111/acel.12550. - DOI - PMC - PubMed
    1. Li J.G., Chu J., Barrero C., Merali S., Pratico D. Homocysteine exacerbates beta-amyloid pathology, tau pathology, and cognitive deficit in a mouse model of Alzheimer disease with plaques and tangles. Ann. Neurol. 2014;75:851–863. doi: 10.1002/ana.24145. - DOI - PMC - PubMed
    1. Muzurovic E., Kraljevic I., Solak M., Dragnic S., Mikhailidis D.P. Homocysteine and diabetes: role in macrovascular and microvascular complications. J. Diabet. Complicat. 2021;35 doi: 10.1016/j.jdiacomp.2020.107834. - DOI - PubMed