. 2024 May 21;5(5):101536.
doi: 10.1016/j.xcrm.2024.101536. Epub 2024 May 1.

Harnessing TME depicted by histological images to improve cancer prognosis through a deep learning system

Affiliations

Harnessing TME depicted by histological images to improve cancer prognosis through a deep learning system

Ruitian Gao et al. Cell Rep Med. .

Abstract

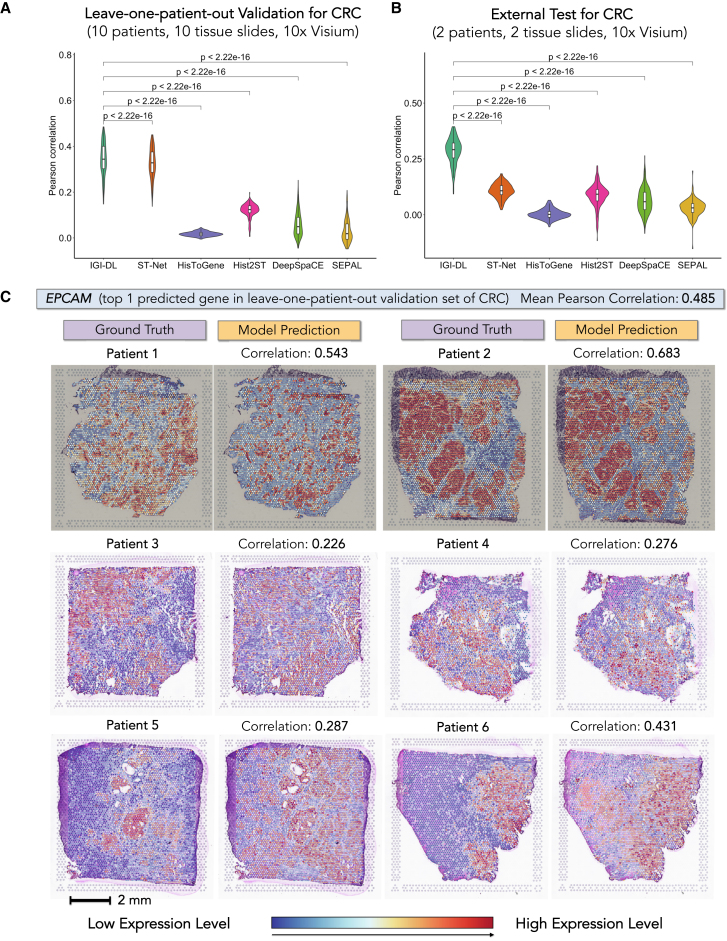
Spatial transcriptomics (ST) provides insights into the tumor microenvironment (TME), which is closely associated with cancer prognosis, but ST has limited clinical availability. In this study, we provide a powerful deep learning system to augment TME information based on histological images for patients without ST data, thereby empowering precise cancer prognosis. The system provides two connections to bridge existing gaps. The first is the integrated graph and image deep learning (IGI-DL) model, which predicts ST expression based on histological images with a 0.171 increase in mean correlation across three cancer types compared with five existing methods. The second connection is the cancer prognosis prediction model, based on TME depicted by spatial gene expression. Our survival model, using graphs with predicted ST features, achieves superior accuracy with a concordance index of 0.747 and 0.725 for The Cancer Genome Atlas breast cancer and colorectal cancer cohorts, outperforming other survival models. For the external Molecular and Cellular Oncology colorectal cancer cohort, our survival model maintains a stable advantage.

Keywords: deep learning; gene expression prediction; graph neural networks; histological images; microenvironment; nuclei graphs; prognosis prediction; spatial transcriptomics; survival analysis.


Conflict of interest statement

Declaration of interests Z.Y. and R.G. are inventors on a patent that has been filed corresponding the integrated graph and image deep learning (IGI-DL) model.

Figures

None
Graphical abstract
Figure 1
Figure 1
The workflow of our DL system for predicting spatial gene expression patterns and making an accurate survival prognosis from histological images of patients with cancer (A) Two connections constructed in our DL system. (B) Data preprocessing workflow for model training, from the histological image to color-normalized patches and constructed Nuclei-Graphs. (C) The architecture of our designed integrated graph and image deep learning (IGI-DL) model. (D) The architecture of our super-patch graph survival model based on predicted spatial gene expression.
Figure 2
Figure 2
The prediction performance and visualization of spatial gene expression by our designed models in colorectal cancer (CRC) (A) Performance of our IGI-DL model and previous SOTA models, including ST-Net, HisToGene, Hist2ST, DeepSpaCE, and SEPAL, for prediction of target spatial gene expression in our in-house CRC dataset (the p value is calculated by comparing the Pearson correlation of all genes predicted by IGI-DL with other SOTA models using the two-sided Wilcoxon signed-rank test). (B) Comparison of our IGI-DL model with previous models for predicting gene expression in the CRC external test set (the p value is calculated by the two-sided Wilcoxon signed-rank test). (C) Visualization of ground truth and predicted expression level of EPCAM in tissue samples from the CRC leave-one-patient-out validation set (patients 1–6; scale bar, 2 mm).
Figure 3
Figure 3
Comparison of gene expression prediction performance among different models and visualization of spatial gene expression by our designed models in breast cancer and cutaneous squamous cell carcinoma (cSCC) (A) Violin plot comparing the mean Pearson correlation of target gene prediction among our model and previous SOTA models in the breast cancer leave-one-patient-out validation set (the p value is calculated by the two-sided Wilcoxon signed-rank test). (B) Violin plot comparing the mean Pearson correlation of target gene prediction among our model and previous models in the breast cancer external test set (the p value is calculated by the two-sided Wilcoxon signed-rank test). (C) Violin plot comparing the mean Pearson correlation of target gene prediction among our model and previous models in the cSCC leave-one-patient-out validation set (the p value is calculated by the two-sided Wilcoxon signed-rank test). (D) Violin plot comparing the mean Pearson correlation of target gene prediction among our model and previous models in the cSCC external test set (the p value is calculated by the two-sided Wilcoxon signed-rank test). (E) Visualization of ground truth and predicted expression level of SFN by IGI-DL in four tissue samples from the cSCC external test set (scale bar, 2 mm).
Figure 4
Figure 4
The ablation experiment of our IGI-DL model and the visualization of latent spaces and clustering results based on predicted spatial gene expression (A) Performance of image-based, graph-based, and integrated models for predicting target gene expression in our in-house CRC dataset. Left evaluation matrix: mean Pearson correlation between ground truth and predicted value of 179 target genes. Center and right evaluation matrices: percentages of genes with correlation greater than or equal to 0.2 and 0.3, respectively. (B) Typical patches with different labels in the NCT-CRC-HE dataset. (C) UMAP visualization of feature vectors in different parts of the IGI-DL, from two input branches to the output branch. (D) Spot clustering results based on predicted spatial gene expression in the leave-one-patient-out validation set of CRC (patients 1 and 2).
Figure 5
Figure 5
Prognosis performance of our graph-based survival models for breast cancer and CRC (A) 5-fold cross-validation performance comparison of different survival models in the breast cancer cohort and CRC cohort of TCGA. In the boxplot, the minimum and maximum C-index are represented by horizontal lines, while the first quartile (Q1), median, and third quartile (Q3) C-index are depicted by a box. The diamond-shaped points represent the mean values of the C-index (n = 5), and the circular points represent outliers in the data. (B) Kaplan-Meier plots of patients’ overall survival with regard to super-patch graph risk score for each validation fold of the 5-fold cross-validation in the breast cancer cohort and CRC cohort of TCGA (the p value is calculated by comparing the difference between two survival curves of the low-risk and high-risk groups with a log rank test). (C) C-index in each fold of 5-fold cross-validation for overall and early-stage patients’ survival prediction, with blue dots representing all stages and orange dots representing early stages (I and II). (D) Performance comparison of different survival models in the external test set, MCO-CRC. (E) Kaplan-Meier plots of overall survival with regard to predicted super-patch graph risk score for all patients in the external test set, MCO-CRC (the p value is calculated by log rank test). (F) Kaplan-Meier plots of overall survival with regard to predicted super-patch graph risk score for early-stage patients in the external test set, MCO-CRC (the p value is calculated by log rank test).

References

    1. Yu K.-H., Zhang C., Berry G.J., Altman R.B., Ré C., Rubin D.L., Snyder M. Predicting non-small cell lung cancer prognosis by fully automated microscopic pathology image features. Nat. Commun. 2016;7 - PMC - PubMed
    1. Zhu X., Yao J., Zhu F., Huang J. 2017 IEEE Conference on Computer Vision and Pattern Recognition. CVPR; 2017. WSISA: Making survival prediction from whole slide histopathological images; pp. 6855–6863.
    1. Yao J., Zhu X., Huang J. Medical Image Computing and Computer Assisted Intervention – MICCAI 2019: 22nd International Conference, Proceedings, Part I. 2019. Deep multi-instance learning for survival prediction from whole slide images; pp. 496–504.
    1. Yao J., Zhu X., Jonnagaddala J., Hawkins N., Huang J. Whole slide images based cancer survival prediction using attention guided deep multiple instance learning networks. Med. Image Anal. 2020;65 - PubMed
    1. Lee Y., Park J.H., Oh S., Shin K., Sun J., Jung M., Lee C., Kim H., Chung J.H., Moon K.C., Kwon S. Derivation of prognostic contextual histopathological features from whole-slide images of tumours via graph deep learning. Nat. Biomed. Eng. 2022:1–15. - PubMed