. 2024 Jul 3;112(13):2157-2176.e12.
doi: 10.1016/j.neuron.2024.04.006. Epub 2024 May 1.

Epistatic interactions between NMD and TRP53 control progenitor cell maintenance and brain size

Affiliations

Epistatic interactions between NMD and TRP53 control progenitor cell maintenance and brain size

Lin Lin et al. Neuron. .

Abstract

Mutations in human nonsense-mediated mRNA decay (NMD) factors are enriched in neurodevelopmental disorders. We show that deletion of key NMD factor Upf2 in mouse embryonic neural progenitor cells causes perinatal microcephaly but deletion in immature neurons does not, indicating NMD's critical roles in progenitors. Upf2 knockout (KO) prolongs the cell cycle of radial glia progenitor cells, promotes their transition into intermediate progenitors, and leads to reduced upper-layer neurons. CRISPRi screening identified Trp53 knockdown rescuing Upf2KO progenitors without globally reversing NMD inhibition, implying marginal contributions of most NMD targets to the cell cycle defect. Integrated functional genomics shows that NMD degrades selective TRP53 downstream targets, including Cdkn1a, which, without NMD suppression, slow the cell cycle. Trp53KO restores the progenitor cell pool and rescues the microcephaly of Upf2KO mice. Therefore, one physiological role of NMD in the developing brain is to degrade selective TRP53 targets to control progenitor cell cycle and brain size.

Keywords: EJC; PAX6; TBR2; Upf1; Upf3a; Upf3b; cell division; neurogenesis; p21; p53; progenitor cell competence.


Conflict of interest statement

Declaration of interests The authors declare no competing interests.

Figures

Figure 1.
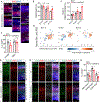
Figure 1.. Upf2cKO in neural progenitors leads to impaired cell growth and microcephaly.
(A) Schematic of multiple Cre-recombination systems to generate Upf2 conditional KO mice during brain development. (B) Images of P0 Emx1-, Nestin-, and Nex-Upf2cKO brains with their littermate controls. The dotted lines indicated the forebrains in each Upf2cKO. (C) Images of P0 Emx1-Upf2cKO brains and littermate controls with DAPI staining. The white rectangle showed the cortex thickness (Scale bar: 500 μm on the left and 50 μm on the right panel). (D-F) Quantification of P0 Emx1-Upf2cKO cortical thickness (D), ventricle area (E) and striatum area (F) in (C) (n=4; N=2–3 sections per group, 2 sides per section). (G) Representative images of NeuN staining in P0 Emx1-Upf2cKO cortices and their littermate controls (Scale bar: 50 μm). (H) Quantification of the number of NeuN+ cells per 200 μm bin in (G) (n=4; N=2 images per section and 3–4 sections per sample). (I) Brain weights of p0 Emx1- and Nex-Upf2cKO with their littermate control mice (nC=25, nEmx1-KO=11, nNex-KO=6). (J) Western blotting of UPF2 protein expression in P0 Emx1-Upf2cKO and Nex-Upf2cKO cortices and their littermate controls. (K) Quantification of UPF2 expression in (J) (nC=8, nEmx1-KO=6, nNex-KO=3). See also Figure S1-S2.
Figure 2.
Figure 2.. Upf2KO neural progenitor cells exhibit slower growth by inducing cell cycle defects.
(A) Nestin-Cre-induced Upf2cKO significantly impaired the growth of cortical neurospheres. (B) CellTiter-Glo luminescent assay performed in E14.5 Nestin-Upf2cKO neurospheres and their littermate controls (Data are analyzed by Two-way ANOVA; n=4). (C) UPF2 protein in Upf2fl/fl NPCs was completely removed after Cre lentivirus infection compared to control groups. (D–K) The expression level of NMD isoforms and genes showed an upregulation after Upf2KO in vitro. In Upf2KO NPCs, the NMD isoforms (denoted as “N_”) of Psd95 (D), Hnrnpl (E), Tra2b (F), and Ptbp2 (G) and other NMD targets like Gadd45b (H), Gadd45g (I), Pdrg1 (J), and Atf4 (K) showed a significant upregulation (n=3). (L) Upf2fl/fl NPCs with Cre expression had cell growth defects compared to Mock and GFP lentivirus control. (Data are analyzed by Two-way ANOVA; n=4). (M–P) Upf2KO NPCs displayed cell proliferation defects following EdU labeling. Compared to Mock (M) and Ctrl group (N), iCre-infected (O) NPCs had less percentage of S phase cells after 30 minutes pulse labeling of 10 μM EdU (n=6). See also Figure S3.
Figure 3.
Figure 3.. UPF2-deficient RGC exhibited defective proliferation with prolonged cell-cycle progression.
(A) Immunostaining of PAX6 in E13.5, E15.5, and E17.5 Emx1-Upf2cKO cortices and their littermate controls (Scale bar: 100 μm). (B) Quantification of the percentage of PAX6+ cells in (A) (n=3–4; N=3–4 images per section, 2–3 sections per sample). (C) Immunostaining of BrdU (1.5 hours labeling) in E17.5 Emx1-Upf2cKO cortices and their littermate controls (Scale bar: 100 μm). (D) Quantification of the percentage of BrdU+ cells in (C) (n=4; N=3–4 images per section, 2–3 sections per sample). (E) Representative images of EdU (24-hour labeling) costaining with Ki67 in E15.5 Emx1 Upf2cKO cortices and their littermate controls (Scale bar: 50 μm on the upper and 10 μm on the lower panel). (F) Quantification of the cells exiting the cell cycle labeled by Ki67EdU+ and calculation of the percentage of Ki67EdU+ in total EdU+ cells in (E) (n=5; N=2 images per section, 3 sections per sample). (G) Schematic of cumulative EdU labeling for the experiments in (H–I). (H) Proportion of EdU-labelled RGCs (EdU+PAX6+ TBR2) after cumulative EdU labeling for 0.5, 3.5, 6.5, 9.5, 12.5, 15.5, 18.5, 21.5 and 24.5 hours in Emx1-Upf2cKO cortices (red) and the littermate control (black). The data are presented as the mean of two to six brains per time point and for each brain, four 100 μm bins were quantified in each section, and three sections were quantified in total. The color-coded arrows indicated the time point at which the percentage of labeled RGCs reached a plateau (TCTS). The value of R-squared was larger than 0.95 in both groups and the formula was used to calculate the cell cycle phases (TC and TS). (I) Table of cell-cycle phases (TC and TS) calculated from (H) in E15.5 Emx1-Upf2cKO cortices and their littermate controls. See also Figure S4.
Figure 4.
Figure 4.. Cell lineage defects in Upf2cKO mice
(A) Immunostaining of TBR2 in E13.5, E15.5, and E17.5 Emx1-Upf2cKO cortices and their littermate controls (Scale bar: 100 μm). (B–C) Quantification of the percentage of TBR2+ cells in 100 μm bin and TBR2+% / PAX6+% in E13.5, E15.5 and E17.5 Emx1-Upf2cKO cortices and their littermate controls (n=3–4; N=3–4 images per section, 2–3 sections per sample). (D) A scatter plot shows differentially expressed genes (DEGs) between IPC and RGC or between late RGC and early RGC. Differential expression values of DEGs (in either x or y axis) between two conditions (log2(CPM1+1) −log2(CPM2+1)) are plotted on the differentiation x-axis (E13IPC−E11RGC, E15IPC−E13RGC, E17IPC−E15RGC, respectively) vs. age y-axis (E13RGC−E11RGC, E15RGC−E13RGC, E17RGC−E15RGC, respectively). Gene expression values were downloaded from GSE107122. For each gene, their gene expression fold change in Upf2cKO (log2(TPMKO+1) −log2(TPMCtr+1)) is color coded. (E) Immunostaining of layer markers SATB2 and TBR1 in E17.5 Emx1-Upf2cKO cortices and their littermate controls (Scale bar: 50 μm). (F) Quantification of the percentages of SATB2+ cells and TBR1+ cells in 100 μm bin of E17.5 Emx1-Upf2cKO cortices and their littermate controls (n=6; N=2–3 images per section, 2–3 sections per sample). (G–H) To estimate the production of layer VI neurons (TBR1+EdU+), layer II-V neurons (SATB2+EdU+) and layer V neurons (CTIP2+EdU+) in Upf2cKO cortices, pregnant mice were injected with EdU (100 mg/kg) at E14.5 and analyzed at E17.5. Representative confocal images were shown (G; scale bar: 50 μm), and quantification of EdU+ cells with different layer markers was shown in (H) (n=5; N=2 images per section and 3 sections per group). See also Figure S4-S6.
Figure 5.
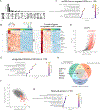
Figure 5.. CRISPRi screening of Upf2KO NPCs
(A) PCA analysis showed reproducibility between two dCas9-KRAB-expressing Upf2fl/fl NPC cell lines and clear separation among experimental groups. (B) MAGeCK score plot shows multiple hits identified in CRISPRi screening, including Trp53. (C) Validation of CRISPRi screening hits in Cre-infected dCas9-KRAB-expressing Upf2fl/fl NPC cell lines (n=3–9). (D) Upf2 Trp53dKO showed a clear cell growth rescue compared to Upf2KO, while Trp53KO alone didn’t clearly affect cell proliferation. (Data are analyzed by the Two-way ANOVA; n=4). (E) Possible mechanisms for Trp53 depletion rescuing Upf2KO-induced cell growth defect. (F) UPF1 eCLIP-Seq showed no signal enrichment in Trp53, including the 3’ UTR. Scale represents reads per million (RPM) mapped to the Trp53. (G) Upf2 Trp53dKO had a similar expression profile of the NMD targets compared to Upf2KO (n=3). (H) Trp53 and NMD co-regulate genes that inhibit cell growth in Upf2KO NPCs. See also Figure S7-S8 and Table S2.
Figure 6.
Figure 6.. Integrated functional genomics identified the intersection between the Trp53 transcriptional pathway and Upf2KO-induced NMD targets.
(A) Cell cycle phase-dependent gene upregulation in Upf2KO NPCs. (B) Heatmap showing the magnitude of differential gene expression comparing Upf2KO and WT NPCs. (Cdkn1a gene was highlighted by a rectangular box). (C) GO term enrichment analysis of 138 upregulated genes identified p53-related networks. (D) UPF1 eCLIP-Seq data in primary NPC show fold change of IP/Input (x-axis) versus p-value (y-axis) of all detected genes. Cdkn1a gene was highlighted by a rectangular box. Note: genes with −log10(p-value) ≥ 100 were clustered along the y=100 line. (E) Top enriched GO terms of overlapping genes from eCLIP-Seq and scRNA-Seq. (F) Scatter plot shows gene expression fold changes of Upf2KO/WT on the x-axis and of Upf2 Trp53dKO/Upf2KO on the y-axis. Mis-regulated genes in Upf2KO NPCs reverted by Trp53KO were labeled in red with Cdkn1a gene highlighted by a rectangular box. (G) 55 rescued genes by Trp53KO in Upf2KO NPCs were significantly enriched in the p53 regulatory network and inhibition of cell proliferation. (H) Venn diagram analysis of the eCLIP-Seq, Upf2KO/dKO bulk-Seq, and scRNA-Seq data gave five high-confidence candidates. See also Figure S9-S13 and Table S3, S4 and S5.
Figure 7.
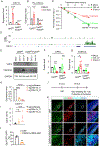
Figure 7.. Cdkn1a is a direct NMD target whose upregulation is responsible for the Upf2KO NPC growth defect.
(A) The expression level of Cdkn1a in Cre-AAV infected Upf2KO and Upf2 Trp53dKO NPC samples (n=8). (B) The expression level of the Cdkn1a pre-mRNA in NPC samples (n=4). (C) Half-life test showed increased stability of Cdkn1a mRNA with Upf2KO (n=4). (D) UPF1 eCLIP-Seq in primary NPCs shows UPF1 binding the 3’ UTR of Cdkn1a. Scale represents reads per million (RPM) mapped to Cdkn1a gene. (E–G) Western blots show CDKN1A protein level in Upf2KO and Upf2 Trp53dKO NPCs samples (n=7). UPF2 and CDKN1A expressions were quantified in (F) and (G). (H) RT-qPCR show two sgRNAs inhibit the expression of Cdkn1a (n=9). (I) CRISPRi-mediated Cdkn1a knockdown partially rescued the growth defect in Cre-virus-infected Upf2KO NPCs. (n=9). (J) Strategy to deliver CDKN1A-IRES-GFP or control plasmids into cortical progenitors via in utero electroporation of wildtype embryos. (K) GFP co-stained with CDKN1A and EdU (1.5 hours labeling) in both CDKN1A-overexpressing group (CDKN1A-IRES-GFP) and control group (GFP) (Scale bars: 100 μm in upper and 10 μm in lower images). (L) Quantification of the percentage of proliferative EdU+GFP+ in total GFP+ in (K) (n=3; 5 sections per group). See also Figure S14-S16.
Figure 8.
Figure 8.. Trp53KO rescues microcephaly, RGC cell number, and cell cycle in Emx1-Upf2cKO mice in vivo.
(A) Images of Emx1-Upf2cKO and Emx1-Upf2 Trp53dKO brains at P0. (B) Brain weights of P0 Emx1-Upf2cKO, Exm1-Upf2Trp53dKO and Emx1-Trp53cKO with their littermate control mice (nC=39; nUpf2cKO=11; ndKO=8; nTrp53cKO=13). (C) Immunostaining of PAX6 in E15.5 Upf2cKO, Upf2 Trp53dKO and Trp53cKO cortices (Scale bar: 50 μm). (D) Quantification of PAX6+% cells in 100 μm bin of (C) (nC=9; nUpf2cKO=4; ndKO=4; nTrp53cKO=5; N=2–3 images per section, 2–3 sections per sample). (E) Representative immunofluorescent images of EdU with PAX6 and TBR2 in E15.5 Upf2cKO, Upf2 Trp53dKO and Trp53cKO cortices after cumulative EdU labeling for 3.5 hours (Scale bar: 50 μm). (F) Quantification of EdU+PAX6+TBR2% in total PAX6+TBR2 RGCs in 100 μm bin of (E) (nC=7; nUpf2cKO=3; ndKO=3; nTrp53cKO=5; N=4 images per section, 3 sections per sample). See also Figure S17.

References

    1. Lykke-Andersen S, and Jensen TH (2015). Nonsense-mediated mRNA decay: an intricate machinery that shapes transcriptomes. Nat. Rev. Mol. Cell Biol 16, 665–677. 10.1038/nrm4063. - DOI - PubMed
    1. He F, and Jacobson A. (2015). Nonsense-Mediated mRNA Decay: Degradation of Defective Transcripts Is Only Part of the Story. Annu. Rev. Genet 49, 339–366. 10.1146/annurev-genet-112414-054639. - DOI - PMC - PubMed
    1. Kashima I, Yamashita A, Izumi N, Kataoka N, Morishita R, Hoshino S, Ohno M, Dreyfuss G, and Ohno S. (2006). Binding of a novel SMG-1-Upf1-eRF1-eRF3 complex (SURF) to the exon junction complex triggers Upf1 phosphorylation and nonsense-mediated mRNA decay. Genes Dev. 20, 355–367. 10.1101/gad.1389006. - DOI - PMC - PubMed
    1. Grimson A, O’Connor S, Newman CL, and Anderson P. (2004). SMG-1 is a phosphatidylinositol kinase-related protein kinase required for nonsense-mediated mRNA Decay in Caenorhabditis elegans. Mol. Cell. Biol 24, 7483–7490. 10.1128/MCB.24.17.7483-7490.2004. - DOI - PMC - PubMed
    1. Chakrabarti S, Bonneau F, Schüssler S, Eppinger E, and Conti E. (2014). Phospho-dependent and phospho-independent interactions of the helicase UPF1 with the NMD factors SMG5-SMG7 and SMG6. Nucleic Acids Res. 42, 9447–9460. 10.1093/nar/gku578. - DOI - PMC - PubMed

MeSH terms

Substances