. 2024 Jul 17;112(14):2404-2422.e9.
doi: 10.1016/j.neuron.2024.04.012. Epub 2024 May 1.

A pupillary contrast response in mice and humans: Neural mechanisms and visual functions

Affiliations

A pupillary contrast response in mice and humans: Neural mechanisms and visual functions

Michael J Fitzpatrick et al. Neuron. .

Abstract

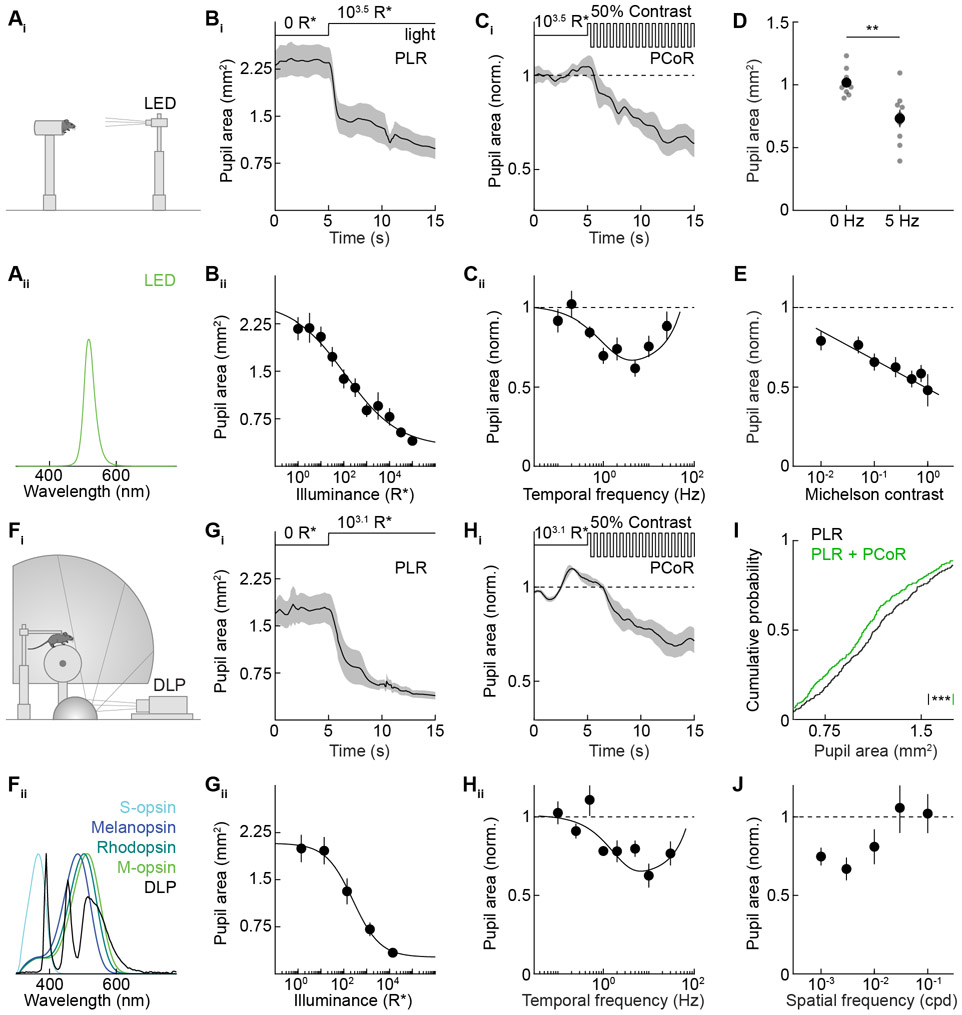
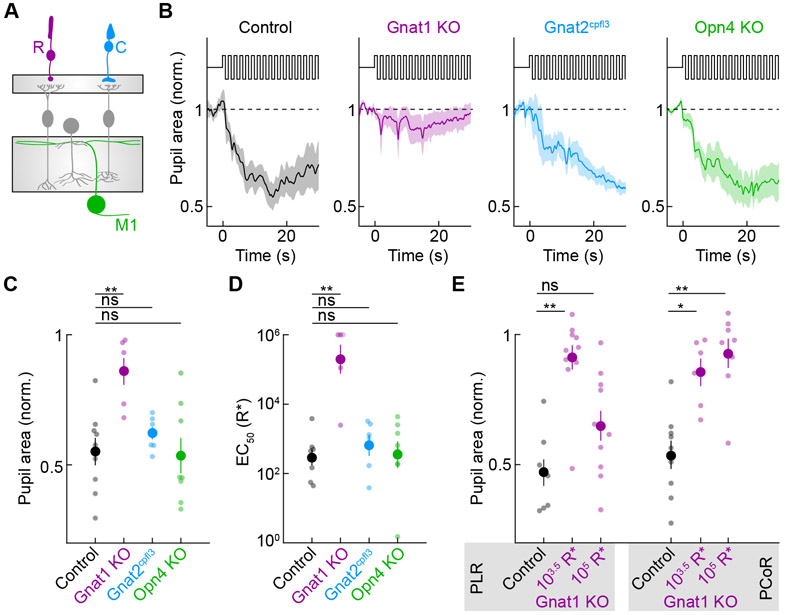
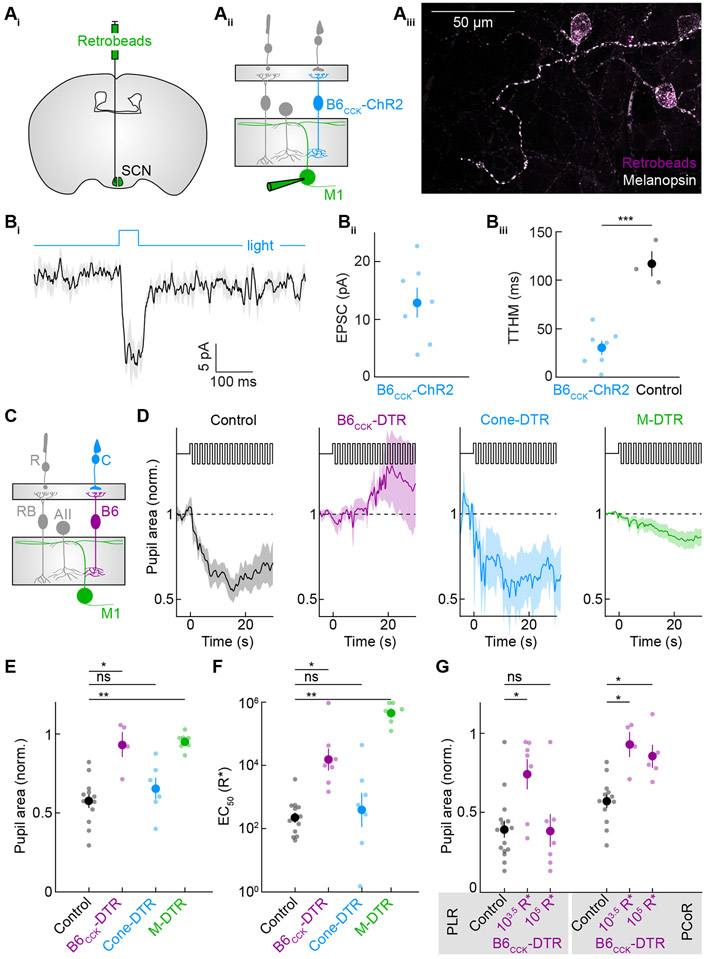
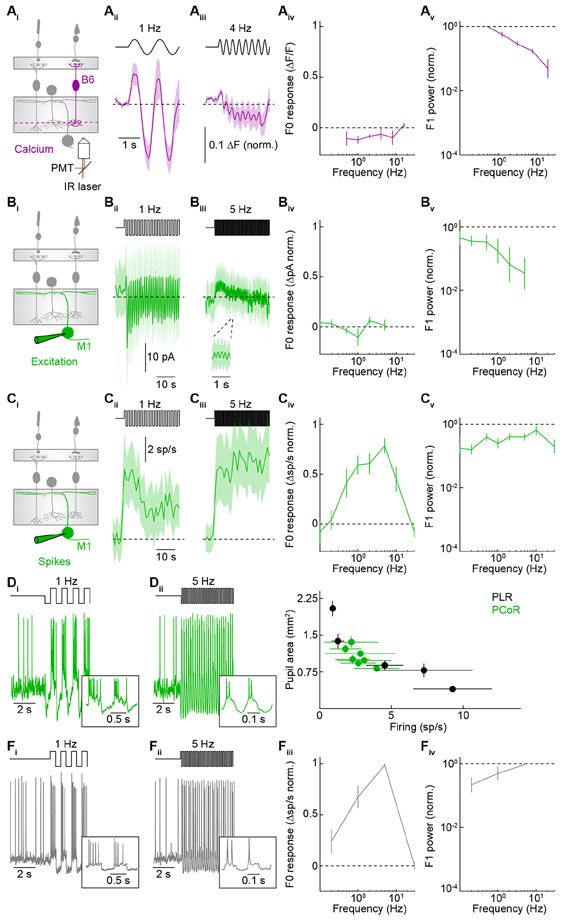
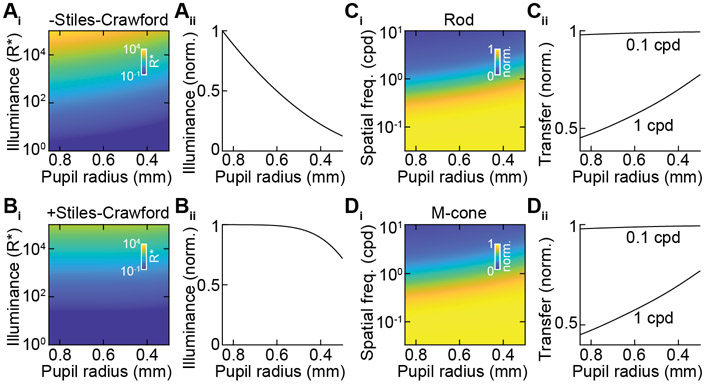
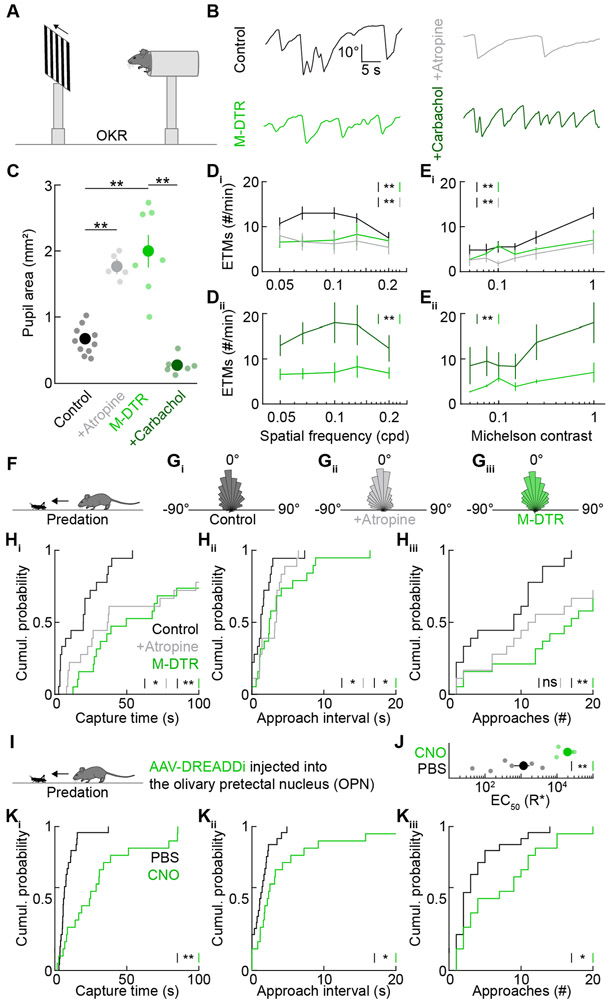
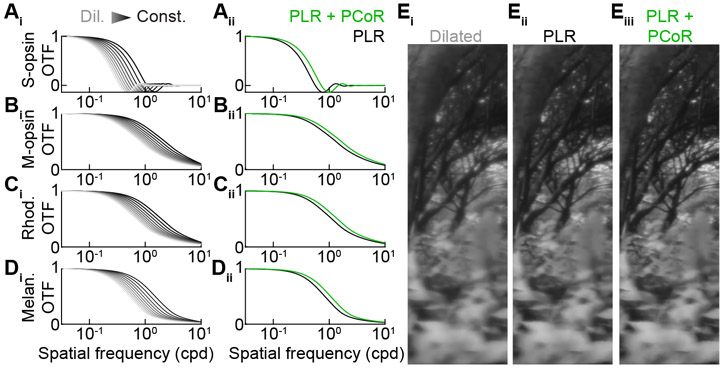
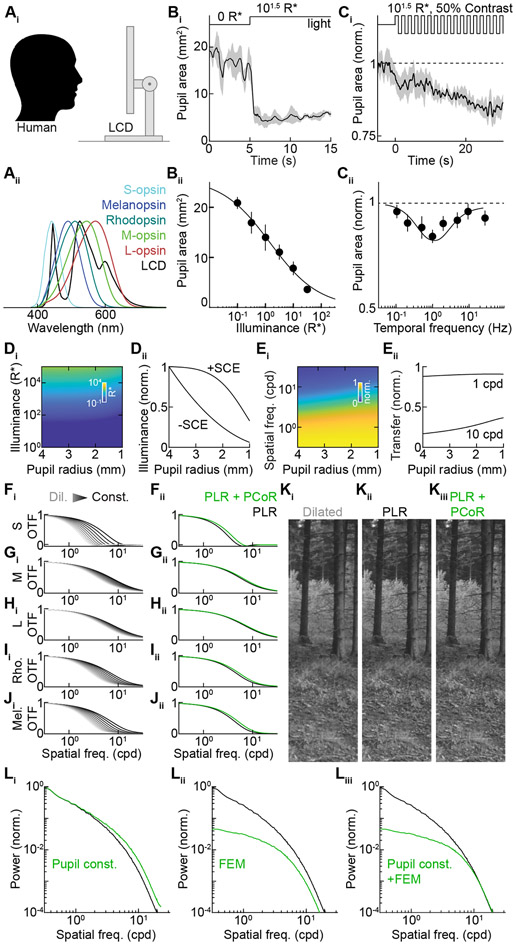
In the pupillary light response (PLR), increases in ambient light constrict the pupil to dampen increases in retinal illuminance. Here, we report that the pupillary reflex arc implements a second input-output transformation; it senses temporal contrast to enhance spatial contrast in the retinal image and increase visual acuity. The pupillary contrast response (PCoR) is driven by rod photoreceptors via type 6 bipolar cells and M1 ganglion cells. Temporal contrast is transformed into sustained pupil constriction by the M1's conversion of excitatory input into spike output. Computational modeling explains how the PCoR shapes retinal images. Pupil constriction improves acuity in gaze stabilization and predation in mice. Humans exhibit a PCoR with similar tuning properties to mice, which interacts with eye movements to optimize the statistics of the visual input for retinal encoding. Thus, we uncover a conserved component of active vision, its cell-type-specific pathway, computational mechanisms, and optical and behavioral significance.

Keywords: Stiles-Crawford effect; active vision; eye movements; ipRGCs; pupil; retina; rod pathways; visual behavior; visual optics.


Conflict of interest statement

Declaration of interests The authors declare no competing interests.

Figures

Figure 1.
Figure 1.. Pupil responses to luminance and contrast
(A) Schematic (i) of the behavioral apparatus used to assess pupillary light responses and the spectral distribution (ii) of the LED stimulus. (B) Average trace (± SEM) (i) at 103.5 R* and summary data (ii) of the pupillary light reflex (PLR) (n = 9). (C) Average trace (± SEM) (i) at 103.5 R*, 50% contrast, 5 Hz, and summary data (ii) of the pupillary contrast response (PCoR) (n = 22). (D) Pupil area (in mm2) under steady illuminance to a 50%-contrast light step (0 Hz) compared to 50% contrast modulation (5 Hz) (0 Hz: 1.02 ± 0.04 mm2, n = 8; 5 Hz 0.73 ± 0.07 mm2, n = 9; p = 0.004 by two-sample t-test). (E) Contrast dependence of the PCoR at 5 Hz (n = 9). (F) Schematic (i) of the behavioral apparatus used to assess pupillary light responses under global illuminance conditions and the spectral distribution (ii) of the DLP stimulus (black) overlayed with the scaled spectra of all mouse photoreceptors (S-opsin, M-opsin, melanopsin, rhodopsin). (G) Average trace (± SEM) (i) at 103.1 R* and summary data (ii) of the pupillary light reflex (PLR) (n=8). (H) Average trace (± SEM) (i) at 103.1 R*, 50% contrast, 5 Hz global stimulation, and summary data (ii) of the pupillary contrast response (PCoR, n = 13). (I) Cumulative probability distribution of pupil areas during locomotion (> 0.5 cm/s) either under the PCoR stimulus (green) or under steady illumination (black) (n = 13; p < 0.001 by Kolmogorov-Smirnov two-sample test). (J) Spatial frequency dependence of the PCoR at 5 Hz (n = 13). See also Figures S1-S2.
Figure 2.
Figure 2.. Photoreceptor elements of the PCoR
(A) Schematic diagram of the retina highlighting manipulations to rods (magenta, Gnat1 KO), cones (cyan, Gnat2cpfl3), or melanopsin (green, Opn4 KO). (B) Average PCoR traces (± SEM) at 103.5 R*, 50% contrast, 5 Hz for control (n = 9), Gnat1 KO (n = 6), Gnat2cpfl3 (n = 7), and Opn4 KO (n = 8). (C) PCoR relative pupil constriction at 103.5 R*, 50% contrast, 5 Hz for control (0.55 ± 0.05, n = 9), Gnat1 KO (0.8587 ± 0.0514, n = 6), Gnat2cpfl3 (0.62 ± 0.02, n = 7), Opn4 KO (0.54 ± 0.07, n = 8) (Kruskal-Wallis effect of genotype p = 0.006; control vs. Gnat1 KO p = 0.0073, control vs. Gnat2cpfl3p = 0.77, control vs. Opn4 KO p = 0.99). (D) EC50 measured from the PLR for control (102.46 ± 0.22 R*, n = 8), Gnat1 KO (105.30 ± 0.42 R*, n = 6), Gnat2cpfl3 (102.8 ± 0.31 R*, n = 6), Opn4 KO (102.55 ± 0.38 R*, n = 8) (Kruskal-Wallis effect of genotype p = 0.006; control vs. Gnat1 KO p = 0.0044, control vs. Gnat2cpfl3p = 0.85, control vs. Opn4 KO p = 0.91). (E) Relative pupil area for PLR (left) and PCoR (right) responses for control at 103.5 R*, Gnat1 KO at 103.5 R*, and Gnat1 KO at 105 R* (PLR: Kruskal-Wallis effect of group p = 0.0003; control vs. Gnat1 KO at 103.5 R* p = 0.0003, control vs. Gnat1 KO at 105 R* p = 0.2869, Gnat1 KO at 103.5 R* vs. Gnat1 KO at 105 R* p = 0.242) (PCoR: Kruskal-Wallis effect of group p = 0.0013; control vs. Gnat1 KO at 103.5 R* p = 0.0279, control vs. Gnat1 KO at 105 R* p = 0.0017, Gnat1 KO at 103.5 R* vs. Gnat1 KO at 105 R* p = 0.82
Figure 3.
Figure 3.. Circuit elements of the PCoR
(A) Strategy for labeling M1 ipRGCs and recording the optogenetically evoked input from type 6 bipolar cells (B6). Fluorescent retrobeads were injected bilaterally into the SCN (i), and M1 ipRGCs were targeted in the B6CCK-ChR2 mouse line, which expresses Channelrhodopsin-2 in all type 6 bipolar cells (ii). Fluorescent retrobead-positive cells were also positive for melanopsin (iii, scale bar = 50 μm). (B) Average trace (± SEM) (i) for M1 ipRGC EPSCs in response to optogenetic stimuli and summary data (ii, 12.90 ± 2.56 pA, n = 7). Comparison of time to half maximum (TTHM) response (in ms) for optogenetic responses in the presence of synaptic blockers vs. photoreceptor responses in control animals without synaptic blockers (p < 0.001 by two-sample t-test). (C) Schematic diagram of the retina highlighting manipulations to type 6 bipolar cells (magenta, B6CCK-DTR), cones and the secondary rod pathway (cyan, Cone-DTR), or M1 ipRGCs (green, M-DTR). (D) Average PCoR traces (± SEM) at 103.5 R*, 50% contrast, 5 Hz for control (n = 9), B6CCK-DTR (n = 4), Cone-DTR (n = 6), and M-DTR (n = 8). (E) PCoR relative pupil constriction at 103.5 R*, 50% contrast, 5 Hz for control (0.55 ± 0.05, n = 9), B6CCK-DTR (0.94 ± 0.08, n = 4), Cone-DTR (0.66 ± 0.07, n = 6), M-DTR (0.95 ± 0.02, n = 8) (Kruskal-Wallis effect of genotype p = 0.007; control vs. B6CCK-DTR p = 0.0182, control vs. Cone-DTR p = 0.9125, control vs. M-DTR p = 0.0029). (F) EC50 measured from the PLR for control (2.46 ± 0.22, n = 8), B6CCK-DTR (4.22 ± 0.35, n = 7), Cone-DTR (2.61 ± 0.54, n = 7), M-DTR (5.68 ± 0.14, n = 8) (Kruskal-Wallis effect of genotype p = 0.0001; control vs. B6CCK-DTR p = 0.0193, control vs. Cone-DTR p = 0.8867, control vs. M-DTR p = 0.0002). (G) Relative pupil area for PLR (left) and PCoR (right) responses for control at 103.5 R*, B6CCK-DTR at 103.5 R*, and B6CCK-DTR at 105 R* (PLR: Kruskal-Wallis effect of group p = 0.043; control vs. B6CCK-DTR at 103.5 R* p = 0.05, control vs. B6CCK-DTR at 105 R* p = 0.9759, B6CCK-DTR at 103.5 R* vs. B6CCK-DTR at 105 R* p = 0.0797) (PCoR: Kruskal-Wallis effect of group p = 0.0027; control vs. B6CCK-DTR at 103.5 R* p = 0.0118, control vs. B6CCK-DTR at 105 R*p = 0.0250, B6CCK-DTR at 103.5 R* vs. B6CCK-DTR at 105 R* p = 0.9170). See also Figures S3-S5.
Figure 4.
Figure 4.. Mechanism of the PCoR computation
(A) Calcium imaging of type 6 bipolar cell axon terminals. Schematic of the retina with targeted cell type and recording strategy (i). Average traces (± SEM) at low (ii) and high (iii) temporal frequencies. F0 (iv) and F1(v) responses at each tested frequency (n = 6). (B) Analogous to A, but for EPSCs from M1 ipRGCs (n = 4). (C) Analogous to A, but for spike rates recorded from M1 ipRGCs (n = 13). (D) Example spike traces at low (ii) and high (iii) temporal frequencies, with insets to show two response cycles. (E) Correlation of M1 ipRGC firing rate obtained during electrophysiology recordings (n = 6) with the pupil area observed during behavioral experiments (n = 9) for illuminance steps from darkness (1, 2, 3, 4, and 5 log10 R*, black) and light-adapted (3.5 log10 R*) contrast modulation (0.1, 0.2, 0.5, 1, 2, 5, 10 Hz, green). (F) Example spike traces to square-wave current injection at low (i) and high (ii) temporal frequencies, with insets to show two response cycles. F0 (iii) and F1 (iv) responses at each tested frequency (n = 4). See also Figure S6.
Figure 5.
Figure 5.. Pupil effect on illuminance and contrast
(A) Dependence of the absolute retinal illuminance (−SCE, color-coded) on corneal illuminance and pupil size (i) and relative retinal illuminance on pupil size alone (ii). (B) Dependence of the effective retinal illuminance (i.e., the retinal illuminance for cone vision considering the Stiles-Crawford effect, + SCE, color-coded) on corneal illuminance and pupil size (i) and relative effective retinal illuminance on pupil size alone (ii). (C) Relative optical transfer (color-coded) as a function of spatial frequency and pupil size (i), with direct comparisons of 0.1 and 1 cpd (ii) for rod-weighted vision. (D) Analogous to C, but for M-cone-weighted vision.
Figure 6.
Figure 6.. Pupil constriction enhances visual performance
(A) Schematic of the setup for recording optokinetic responses from head-fixed mice. (B) Example optokinetic responses to drifting bars (0.1 cpd, Michelson contrast = 1) for control, control + atropine, M-DTR, or M-DTR + carbachol mice. (C) Summary data of pupil size for control (n = 10), control + atropine (n = 5), M-DTR (n = 7), and M-DTR + carbachol (n = 6) mice (ANOVA effect of group p < 0.0001; control ± atropine p=0.0006; control vs. M-DTR p < 0.0001; M-DTR ± carbachol p < 0.0001). (D) Summary data of optokinetic responses in eye-tracking movements (ETMs) per minute across spatial frequencies (Michelson contrast = 1) comparing control, control + atropine, and M-DTR mice (i) or M-DTR mice ± carbachol (ii) (ANOVA effect of group p <0.0001; control ± atropine p = 0.0017; control vs M-DTR p = 0.0018; M-DTR ± carbachol p < 0.0001). (E) Same as for E, but for optokinetic responses across contrasts at 0.1 cpd (ANOVA effect of group p < 0.0001; control ± atropine p = 0.0065; control vs M-DTR p = 0.0061; M-DTR ± carbachol p < 0.0001). (F) Schematic of predation experiments in which mice hunt crickets. (G) Histogram of azimuthal cricket location during approach periods for control (i, n=5), control + atropine (ii, n = 5), and M-DTR (iii, n = 6) mice. (Bootstrap p > 0.05 between all conditions) (H) Cricket hunting performance measured by the time to capture crickets (i, control: n = 20 crickets for 5 mice, control + atropine: n = 20 crickets for 5 mice, M-DTR: n = 21 crickets for 6 mice; control ± atropine p = 0.0224, control vs M-DTR p = 0.0011 by Kruskal-Wallis test), the interval between approaches to the cricket (ii, control ± atropine p = 0.0275, control vs M-DTR p = 0.0296), and the number of approaches made (iii, control ± atropine p = 0.1131, control vs M-DTR p = 0.0061). (I) Schematic of predation experiments in which mice injected with an AAV expressing a pharmacogenetic silencer into the olivary pretectal nucleus hunt crickets. (J) Summary data of pupil sizes after PBS (n = 7) and CNO injections (n = 5, p = 0.0025) (K) Cricket hunting performance measured by the time to capture crickets (i, PBS: n = 24 crickets for 8 mice, CNO: n = 20 crickets for 7 mice, p = 0.001, by Mann-Whitney U test), the interval between approaches to the cricket (ii, p = 0.025), and the number of approaches made (iii, p = 0.045). See also Figure S7.
Figure 7.
Figure 7.. Effects of pupil size on the retinal image
(A) Optical transfer as a function of pupil size (i) across the physiological range of mouse pupil radii from dilated (gray) to constricted (black) weighted for S-opsin. Experimentally determined pupil radii for an illuminance step (PLR, black) vs. contrast modulation at that illuminance (PCoR, green) exhibit significantly different curves (p < 0.0001 by bootstrapping). (B) Analogous to A for M-opsin. (C) Analogous to A for rhodopsin. (D) Analogous to A for melanopsin. (L) Comparison of the retinal image for a dilated mouse pupil (i), illuminance constricted pupil (ii), and contrast constricted pupil (iii).
Figure 8.
Figure 8.. Human pupillary contrast response and retinal image
(A) Schematic diagram (i) of the behavioral apparatus used to assess pupillary light responses to centrally located stimuli in humans and the spectral distribution (ii) of the LCD stimulus (black) overlayed with the scaled spectra of all human photoreceptors (S-opsin, M-opsin, L-opsin, melanopsin, rhodopsin). (B) Average trace (± SEM) (i) at 101.5 R* and summary data (ii) of the pupillary light reflex (n = 3). (C) Average trace (± SEM) (i) at 101.5 R*, 50% contrast, 1 Hz, and summary data (ii) of the pupillary contrast response (n = 7). (D) Dependence of the effective retinal illuminance (i.e., the retinal illuminance for cone vision considering the Stiles-Crawford effect or SCE, the color-coded) on corneal illuminance and pupil size (i) and the relative (−SCE) and relative effective (+SCE) retinal illuminance as a function of pupil size alone (ii). (E) Relative optical transfer (color-coded) as a function of spatial frequency and pupil size (i), with direct comparisons of 1 and 10 cpd (ii) for M-opsin-weighted vision. (F) Optical transfer as a function of pupil size (i) across the physiological range of human pupil radii from dilated (gray) to constricted (black) weighted for S-opsin. Experimentally determined pupil radii for an illuminance step (PLR, black) vs. contrast modulation at that illuminance (PCoR, green) exhibit significantly different curves (p < 0.0001 by bootstrapping). (G) Analogous to F for M-opsin. (H) Analogous to F for L-opsin. (I) Analogous to F for rhodopsin. (J) Analogous to F for melanopsin. (K) Comparison of the retinal image for a dilated human pupil (i), illuminance constricted pupil (ii), and contrast constricted pupil (iii). (L) Distributions of power across spatial frequencies in naturalistic movies (black traces) and their modulation by pupil constriction (i), fixational eye movements (ii), and the combination of pupil constriction and fixational eye movements (iii). See also Figure S8.

Similar articles

Cited by

References

    1. Schroeder CE, Wilson DA, Radman T, Scharfman H, and Lakatos P (2010). Dynamics of Active Sensing and perceptual selection. Curr. Opin. Neurobiol 20, 172–176. 10.1016/j.conb.2010.02.010. - DOI - PMC - PubMed
    1. Gibson JJ (2014). The ecological approach to visual perception: classic edition (Psychology press; ).
    1. Findlay JM, and Gilchrist ID (2003). Active Vision: The Psychology of Looking and Seeing (Oxford University Press; ).
    1. Yarbus AL, and Haigh B (1973). Eye Movements and Vision (Plenum Press; ).
    1. Meyer AF, O’Keefe J, and Poort J (2020). Two Distinct Types of Eye-Head Coupling in Freely Moving Mice. Curr. Biol 30, 2116–2130.e6. 10.1016/j.cub.2020.04.042. - DOI - PMC - PubMed

LinkOut - more resources