. 2024 May 14;57(5):1005-1018.e7.
doi: 10.1016/j.immuni.2024.04.007. Epub 2024 May 1.

A CTCF-binding site in the Mdm1-Il22-Ifng locus shapes cytokine expression profiles and plays a critical role in early Th1 cell fate specification

Affiliations

A CTCF-binding site in the Mdm1-Il22-Ifng locus shapes cytokine expression profiles and plays a critical role in early Th1 cell fate specification

Chunhong Liu et al. Immunity. .

Abstract

Cytokine expression during T cell differentiation is a highly regulated process that involves long-range promoter-enhancer and CTCF-CTCF contacts at cytokine loci. Here, we investigated the impact of dynamic chromatin loop formation within the topologically associating domain (TAD) in regulating the expression of interferon gamma (IFN-γ) and interleukin-22 (IL-22); these cytokine loci are closely located in the genome and are associated with complex enhancer landscapes, which are selectively active in type 1 and type 3 lymphocytes. In situ Hi-C analyses revealed inducible TADs that insulated Ifng and Il22 enhancers during Th1 cell differentiation. Targeted deletion of a 17 bp boundary motif of these TADs imbalanced Th1- and Th17-associated immunity, both in vitro and in vivo, upon Toxoplasma gondii infection. In contrast, this boundary element was dispensable for cytokine regulation in natural killer cells. Our findings suggest that precise cytokine regulation relies on lineage- and developmental stage-specific interactions of 3D chromatin architectures and enhancer landscapes.

Keywords: CBSs; CTCF; Hi-C; Th1; Th17; Toxoplasma gondii; interferon-gamma; interleukin-22; lymphocytic choriomeningitis virus; natural killer cells; super-enhancers; three-dimensional; topologically associating domains.


Conflict of interest statement

Declaration of interests The authors declare no competing interests.

Figures
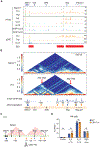
Figure 1.
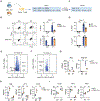
Figure 1.. Inducible 3D genome architectures insulate Il22 and Ifng enhancer landscapes during CD4+ helper T cell differentiation
A. Genomic snapshots of the Mdm1-Il22-Ifng locus showing selective enhancer usage in murine lymphocytes. ATAC-seq data were derived from GSE7769513; p300 ChIP-seq data were obtained from GSE40463. Super-enhancers (SEs) marked on the bottom were defined by the density of p300 load. B. Heatmaps showing the frequency of chromatin interactions for the Mdm1-Il22-Ifng locus captured by in situ focused Hi-C in naïve T and Th1 cells differentiated for 3 days. Interaction matrices were created and normalized using HOMER with parameters -res 1000 -window 15000 -balance -corr, followed by data visualization using HiCExplorer after merging two biological replicates. The arrows show the inducible TADs formed in Th1 cells. Naïve T, n=2. Th1, n=2. Genomic snapshots of the Mdm1-Il22-Ifng locus reveal CTCF binding in Th1 cells by ChIP-seq. Triangles indicate the motif orientations. Blue, forward orientation. Orange, reverse orientation. C. Schematic representation of the 3D genome architecture in Th1 cells and the location of engineered CBS. D. Bar graphs illustrating IFN-γ protein expression in NK cells from WT and CBS-70Δ mice with or without interleukin-12 (IL-12, 10 ng/mL) plus interleukin-18 (IL-18, 100 ng/mL), phorbol 12-myristate 13-acetate (PMA, 50 ng/mL) and ionomycin (500 ng/mL) measured by flow cytometry. Representative results were shown from three repeated experiments. WT, n=3; CBS-70Δ, n=3; ns, not significant.
Figure 2.
Figure 2.. CTCF-mediated 3D genome architecture is required for initial Th1 cell differentiation
A-I. Th1 cell differentiation of naïve CD4+ helper cells from WT and CBS-70Δ mice. Murine splenic CD4+ naïve T cells were isolated from WT or CBS-70Δ mice and polarized to Th0 (with TCR and CD28 signals), Th1 cells (with TCR, CD28, and IL-12 (20ng/ml), and anti-IL-4 (10μg/ml)) and Th2 cells (with TCR , CD28, and IL-4 (20ng/ml), and anti-IFN-γ (10μg/ml)) in vitro for 3 days (A and B) or 7 days prior to flow cytometry (C and D) and bulk RNA-seq (E-I), as described in the methods. IFN-γ and T-bet protein expression were measured by flow cytometry. Representative results were shown from three repeated experiments. B) WT, n=2; CBS-70Δ, n=3. D) WT, n=6; CBS-70Δ, n=6. *, p<0.05; **, p<0.005; ns, not significant. E-F. Volcano plots for bulk RNA-seq showing differentially expressed genes between WT and CBS-70Δ mice in Th1 cells on Day 3 and Day 7. The dashed horizontal line indicates statistical significance threshold (p-values ≤ 0.05). The two vertical lines represent the threshold of log2 fold-change ≥1 and ≤−1. WT, n=3; CBS-70Δ, n=3. G-I. RNA-Seq analysis of gene expression level (RPKM) in WT and CBS-70Δ Th1 cells differentiated for 3 days and 7 days. Statistical significance was assessed using a non-paired two-tailed Student’s t test. WT, n=3; CBS-70Δ, n=3. *, p<0.05; ns, not significant.
Figure 3.
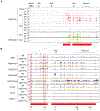
Figure 3.. Activation of Ifng enhancers does not require 3D genome architecture
A. Genomic snapshots for a 500kb genomic region across the Mdm1-Il22-Ifng loci showing H3K27ac histone mark distribution in naïve T cells, Th1 cells at Day 1, 3, 6 and 10, Th2 cells at Day1, 3, 6 and 10, as well as NK cells before and after stimulation with IL-2 and IL-12. Additionally, the distribution of H3K4me1 histone mark in NK cells before and after stimulation is presented. NK cell ChIP-seq data were derived from GSE145299. B. Genomic snapshots showing the chromatin accessibility by ATAC-seq, histone mark distribution (H3K4me1, H3K27ac, H3K4me3 and H3K27me3) and transcription factor binding (p300, Rad21 and CTCF) by ChIP-seq in Th1 cells of WT (n=2) and CBS-70Δ (n=2) mice at day 3. Triangles indicate the motif orientations. Blue, forward orientation. Orange, reverse orientation.
Figure 4.
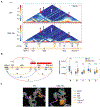
Figure 4.. Re-organization of three-dimensional chromatin architecture and re-distribution of enhancer usage in the mutant Th1 cells
A. Genomic 3-D chromatin architecture for the Mdm1-Il22-Ifng locus in Th1 cells of WT and CBS-70Δ mice by focused Hi-C showing the re-organization of the chromatin architecture. The arrows show gained or lost chromatin interactions between WT and CBS-70Δ mice. B. Quantification of the frequency of chromatin interactions revealing 3-D chromatin architecture differences in WT and CBS-70Δ mice. The loop A-E show the paired regions of long-range chromatin interactions for quantification. The box plots show pixel values among the paired regions for the 5 loops. Statistical significance was assessed with non-paired two-tailed Student’s t test. C. 3D models of the focused Hi-C in Th1 cells built by GenomeFlow show the difference of the 3D structure of the chromatin between WT and CBS-70Δ mice.
Figure 5.
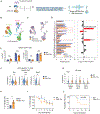
Figure 5.. Dysregulated helper T cell differentiation upon lymphocytic choriomeningitis virus infection in CBS-70Δ mice
A. Schematic representation of experimental design. Both WT and CBS-70Δ mice were infected with LCMV. NK cells, CD4+ T helper cells and CD8+ cytotoxic T cells from spleens were isolated and sorted at day 4 and day 7 after infection prior to 10x Genomics single cell RNA-seq analysis. B. UMAP of the single cell RNA-seq data combining all the timepoints and cell types showing all the clusters representing different cell types. The number of CD4+ cells on day 4 for WT and CBS-70Δ was 2,814 and 2,533, respectively. On day 7, the CD4+ cell numbers were 3,473 and 3,447 for WT and CBS-70Δ, respectively. For CD8+ cells, the numbers on day 4 were 603 and 709 for WT and CBS-70Δ, respectively, while on day 7 the numbers were 1,712 and 1,567 for WT and CBS-70Δ, respectively. The numbers of NK cells on day 4 for WT and CBS-70Δ were 1,448 and 1,011, respectively, while on day 7 the numbers were 2,069 and 1,965 for WT and CBS-70Δ, respectively. The data were combined from two biological replicates. C. Gene expression profiles for NK and T cell signature among 23 scRNA-seq clusters defined by Seurat. D-F. Proportion of each cluster and their ration on day4 and day 7 in WT and CBS-70Δ mice determined by scRNA-seq. G. IFN-γ protein expression in CD4+ T cells of WT and CBS-70Δ mice at day 4 and day 7 after LCMV infection by flow cytometry. WT, n=3; CBS-70Δ, n=4. H. The viral titer of WT and CBS-70Δ mice at day 4 and day 7 after LCMV infection showing the deficiency of clearing the virus at day 4 in CBS-70Δ mice. All experiments were done in duplicate. WT, n=3; CBS-70Δ, n=4. I-J. Pathway enrichment analysis for cluster 1 and 4, which are the most different clusters between WT and CBS-70Δ mice.
Figure 6.
Figure 6.. Aberrant Th1 and Th17 differentiation and higher susceptibility upon Toxoplasma gondii infection in Ifng −70kb CTCF deleted mice
A. Schematic representation of experimental design. Both WT and CBS-70Δ mice were infected with 15 Toxoplasma gondii cyst by i.p. NK cells and CD4+ T helper cells from spleens and peritoneal extrudate cells (PECs) were isolated and sorted at day 3 and day 7 after infection prior to 10x Genomics single cell RNA-seq analysis. B-C. UMAP of the single cell RNA-seq data combining all the timepoints and cell types showing the clusters (B) and differential clusters between WT and CBS-70Δ mice (C). The numbers of NK cells for WT and CBS-70Δ were 14,093 and 12,819, respectively. The numbers of CD4+ cells on day 3 for WT and CBS-70Δ were 6,690 and 5,791, respectively, while on day 7, the CD4+ cell numbers were 10,075 and 8,397 for WT and CBS-70Δ, respectively. D. Percentage of cells in each cluster of the single cells RNA-seq and the comparison in WT and CBS-70Δ mice. E. IFN-γ and T-bet protein expression in CD4+ T cells of WT and CBS-70Δ mice at day 3 and day 7 after Toxoplasma gondii infection analyzed by flow cytometry. Statistical significance was assessed with non-paired two-tailed Student’s t test. WT, n=3; CBS-70Δ, n=4. ***, p<0.0005; ns, not significant. F-G. Expression of Ifng and interferon-induced genes in spleens and PECs at day 3 and day 7 after infection in F) AS15-specific TH, and G) NK cells measured by scRNAseq. **, p<0.005. H-J. Phenotype analysis of Toxoplasma godii-infected WT and CBS-70Δ mice included infected cell analysis (H), with a sample size of n=3 for WT and n-4 for CBS-70Δ mice, weight analysis (I), and survival analysis (J) with a sample size of n=11 for both WT and CBS-70Δ mice. Statistical significance was assessed with non-paired two-tailed Student’s t test. **, p<0.005. All experiments were done in duplicate.

Similar articles

Cited by

References

    1. Rowley MJ, and Corces VG (2018). Organizational principles of 3D genome architecture. Nat Rev Genet 19, 789–800. 10.1038/s41576-018-0060-8. - DOI - PMC - PubMed
    1. Dixon JR, Gorkin DU, and Ren B (2016). Chromatin Domains: The Unit of Chromosome Organization. Mol Cell 62, 668–680. 10.1016/j.molcel.2016.05.018. - DOI - PMC - PubMed
    1. Davidson IF, and Peters JM (2021). Genome folding through loop extrusion by SMC complexes. Nat Rev Mol Cell Biol 22, 445–464. 10.1038/s41580-021-00349-7. - DOI - PubMed
    1. Xiang JF, and Corces VG (2021). Regulation of 3D chromatin organization by CTCF. Curr Opin Genet Dev 67, 33–40. 10.1016/j.gde.2020.10.005. - DOI - PMC - PubMed
    1. Nichols MH, and Corces VG (2015). A CTCF Code for 3D Genome Architecture. Cell 162, 703–705. 10.1016/j.cell.2015.07.053. - DOI - PMC - PubMed

Publication types

MeSH terms