Review
. 2024 Oct:228:116241.
doi: 10.1016/j.bcp.2024.116241. Epub 2024 May 1.

The fatty acid omega hydroxylase genes (CYP4 family) in the progression of metabolic dysfunction-associated steatotic liver disease (MASLD): An RNA sequence database analysis and review

Affiliations
Review

The fatty acid omega hydroxylase genes (CYP4 family) in the progression of metabolic dysfunction-associated steatotic liver disease (MASLD): An RNA sequence database analysis and review

Charles Leahy et al. Biochem Pharmacol. 2024 Oct.

Abstract

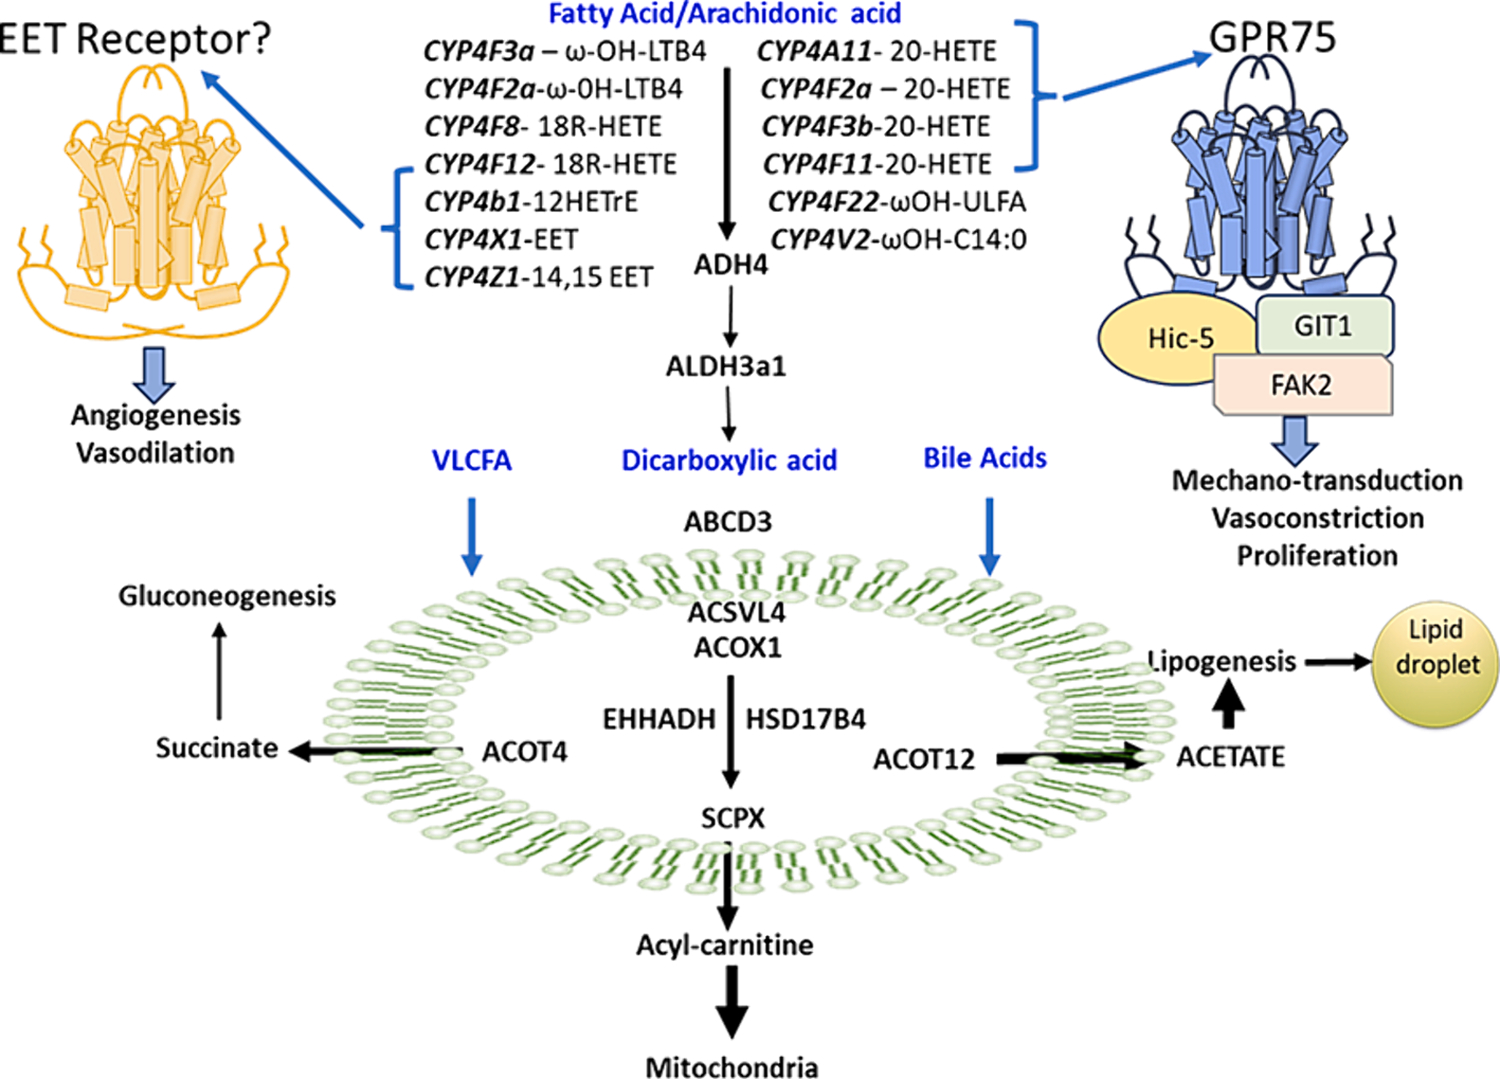
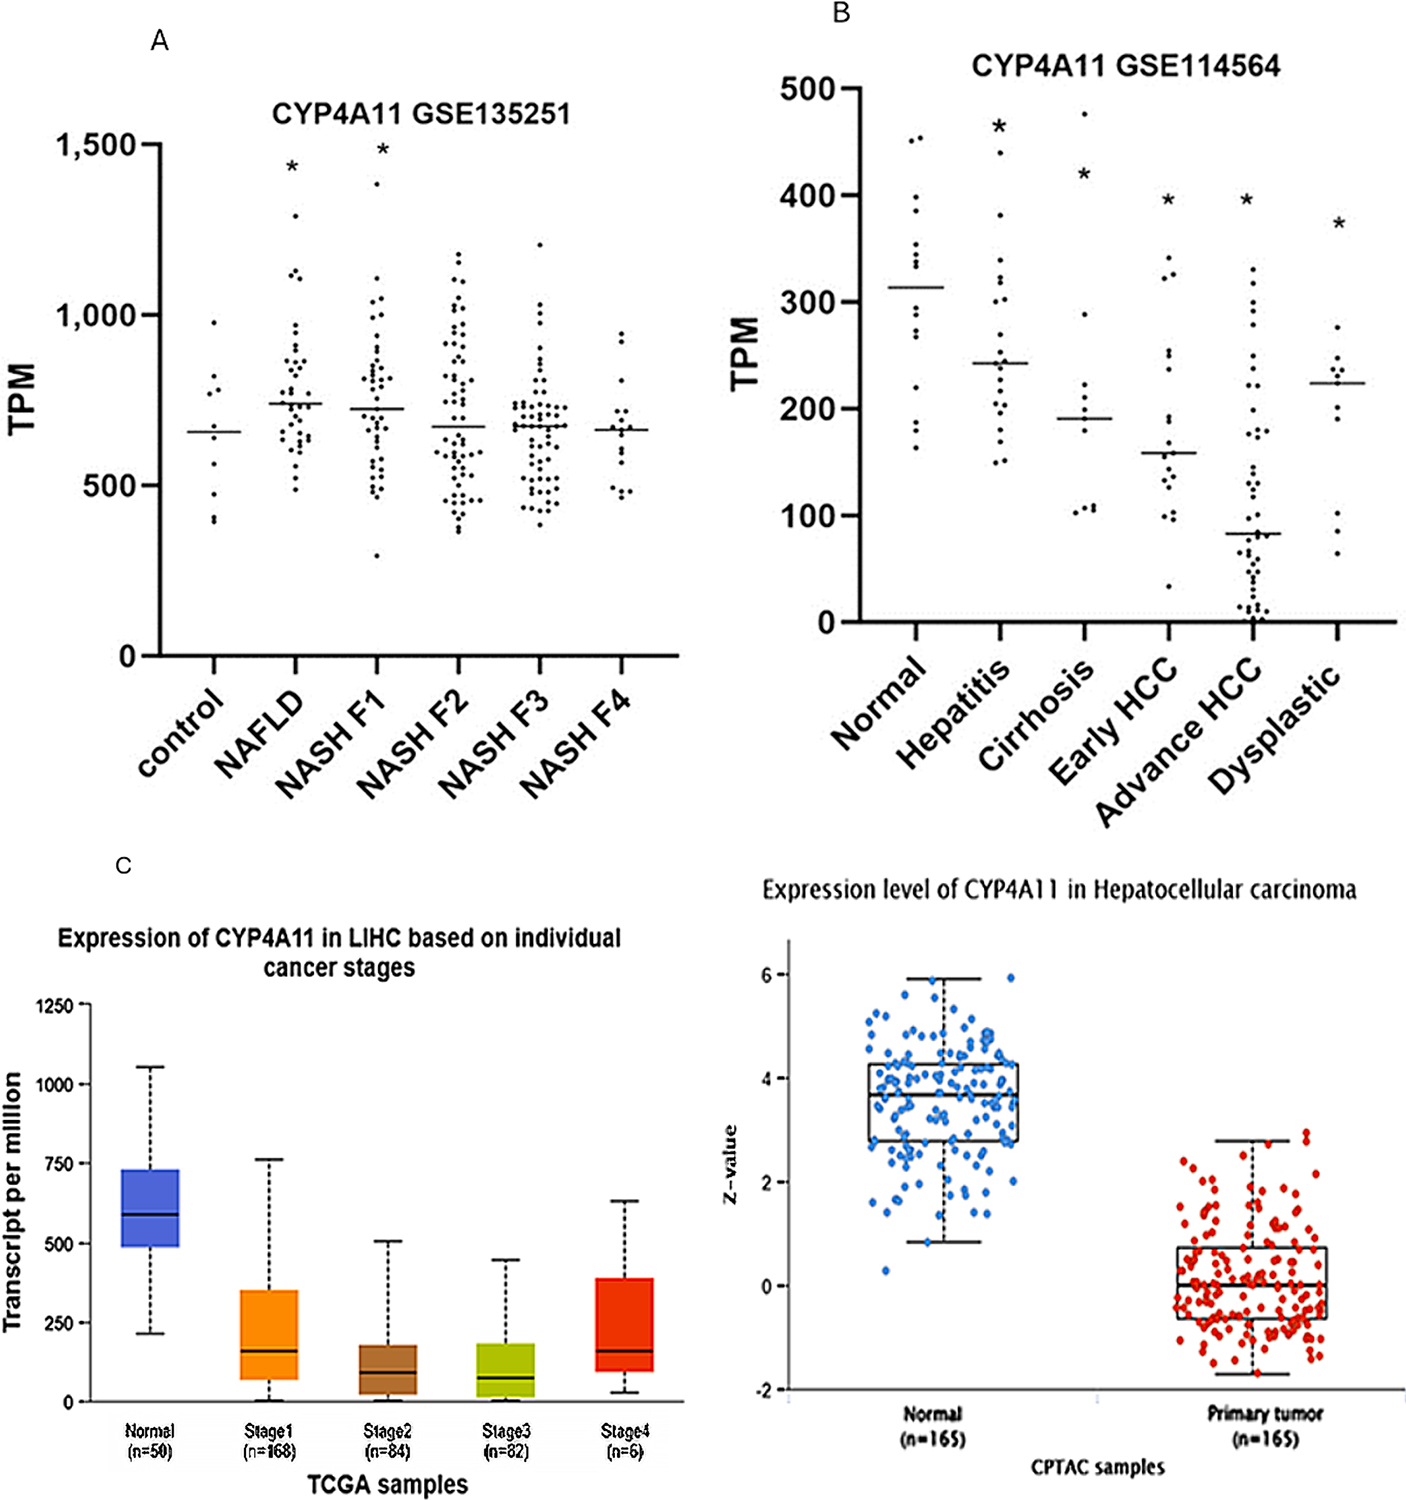
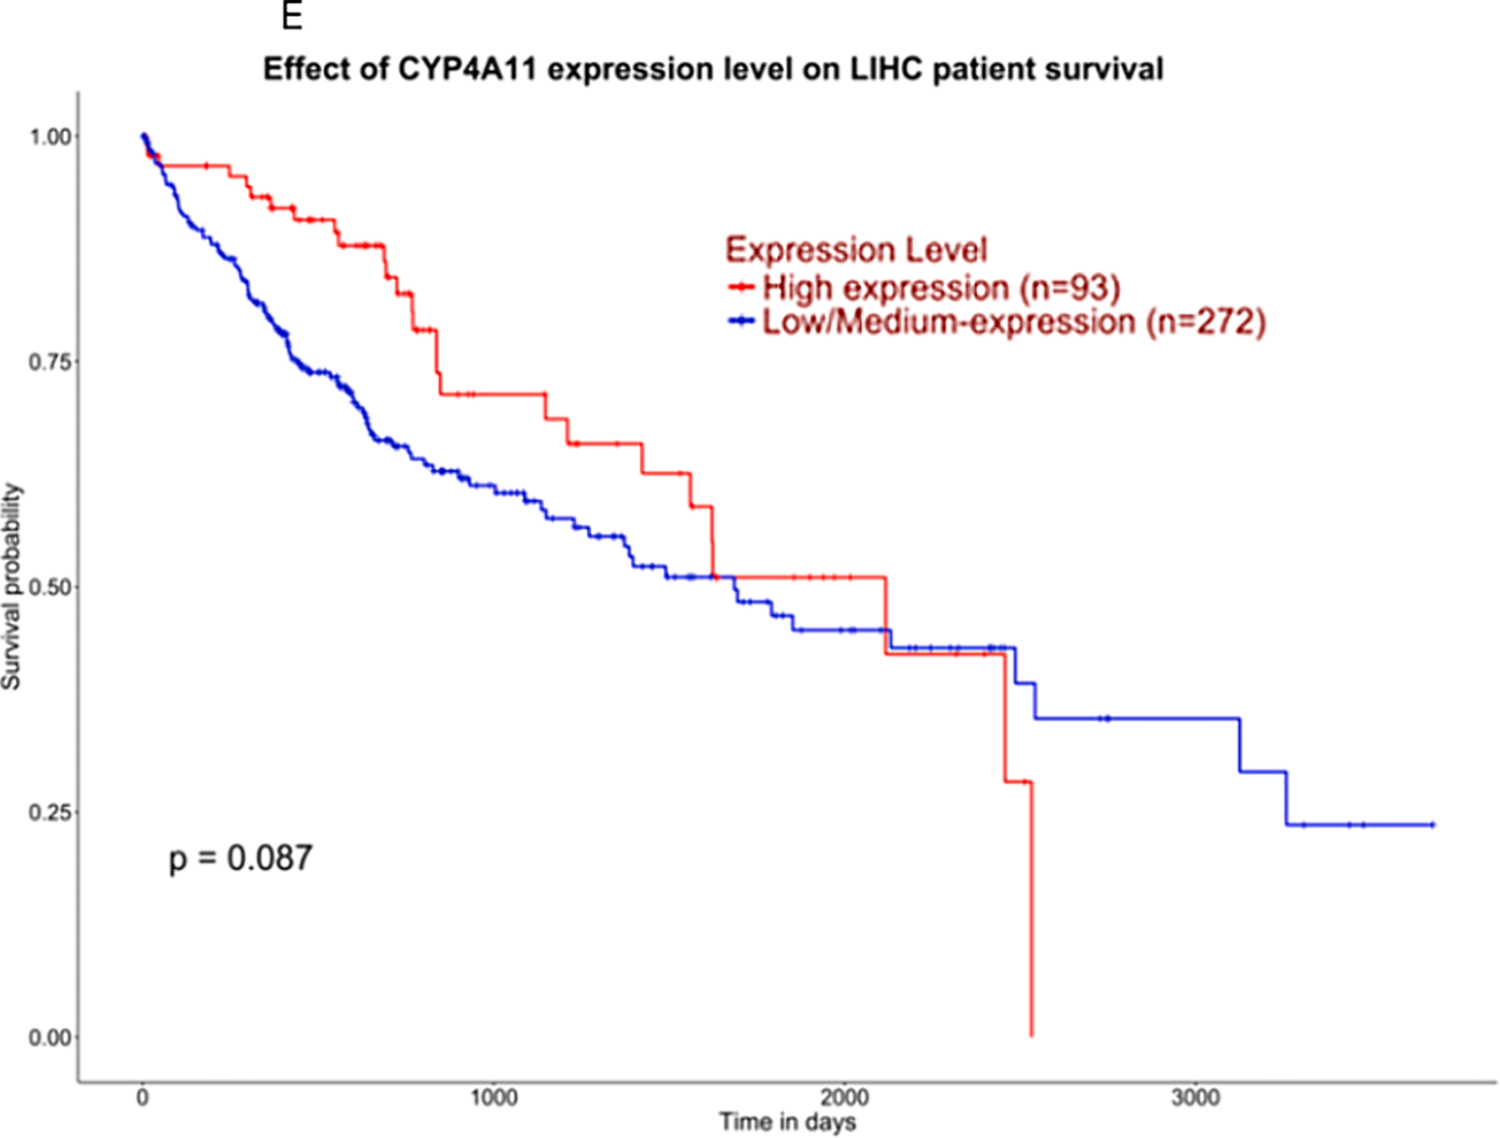
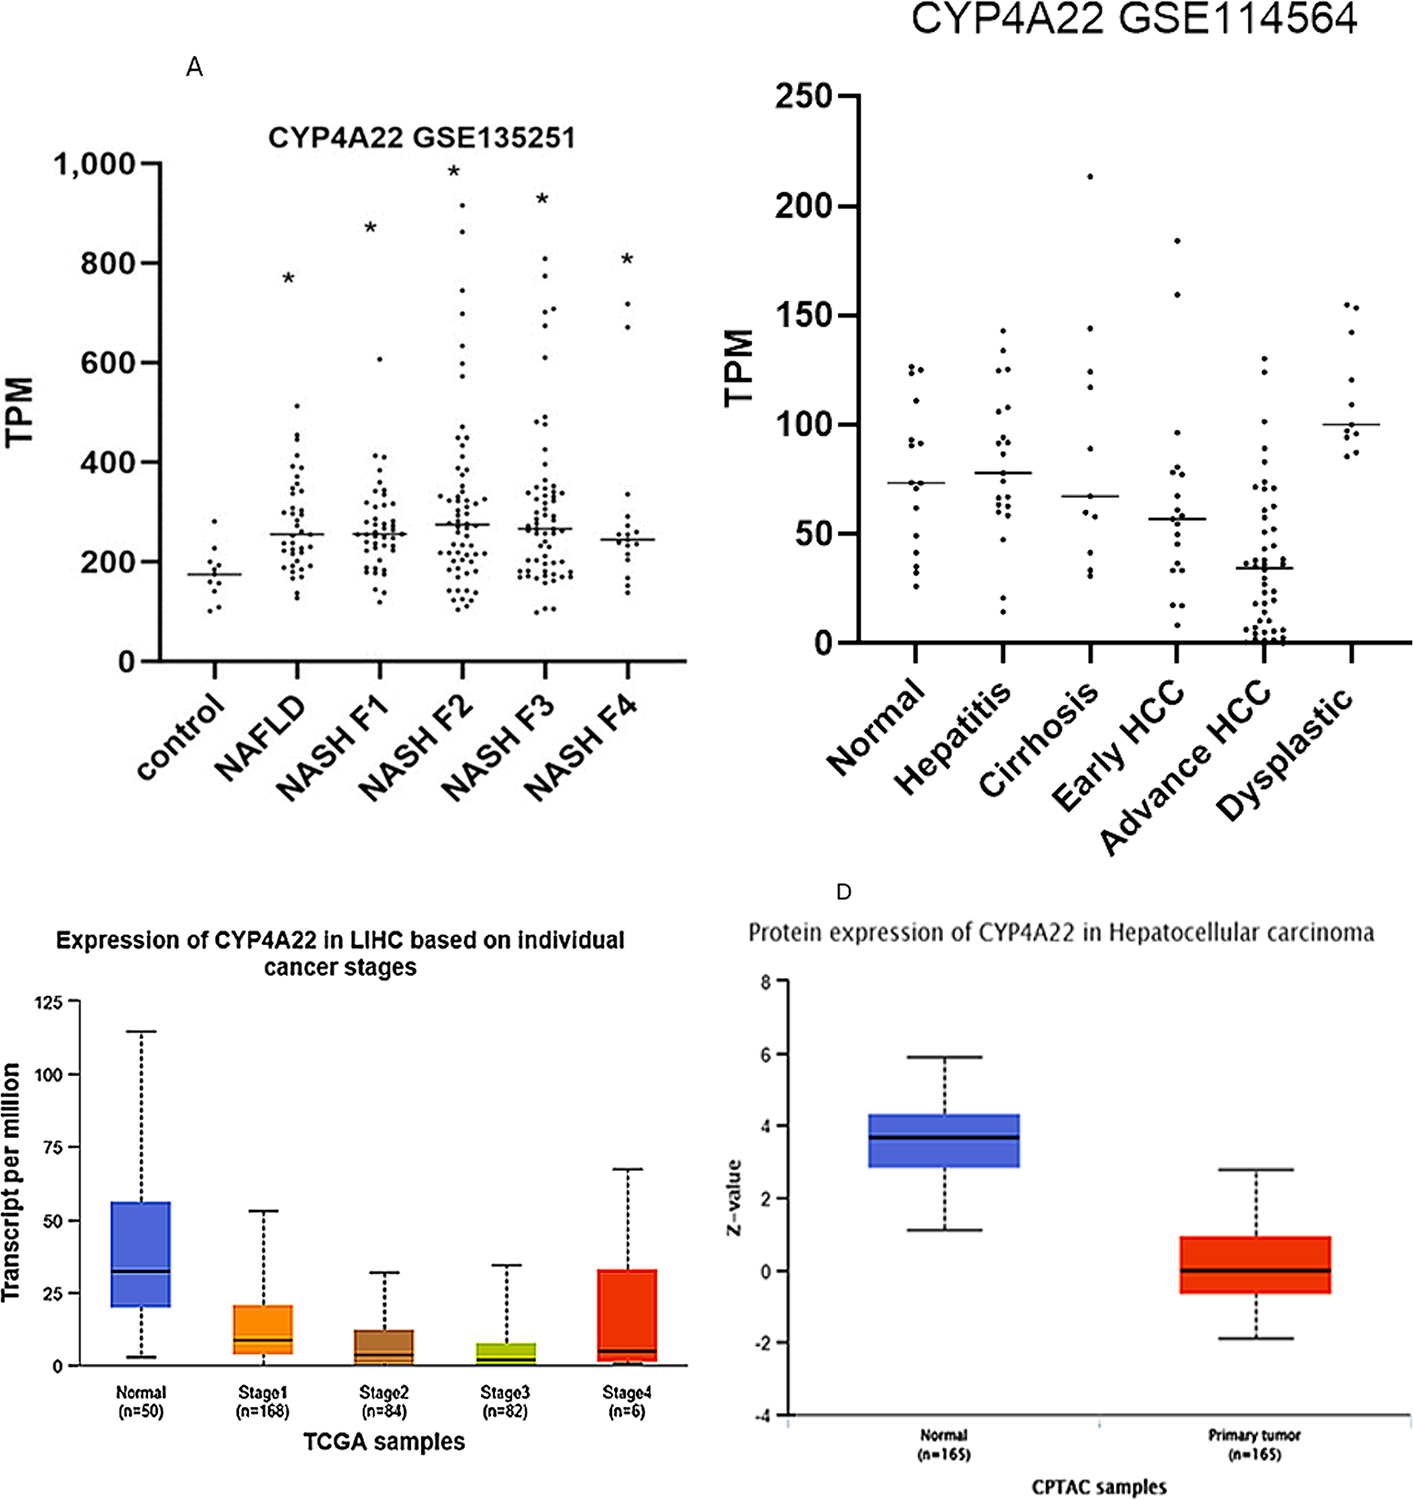
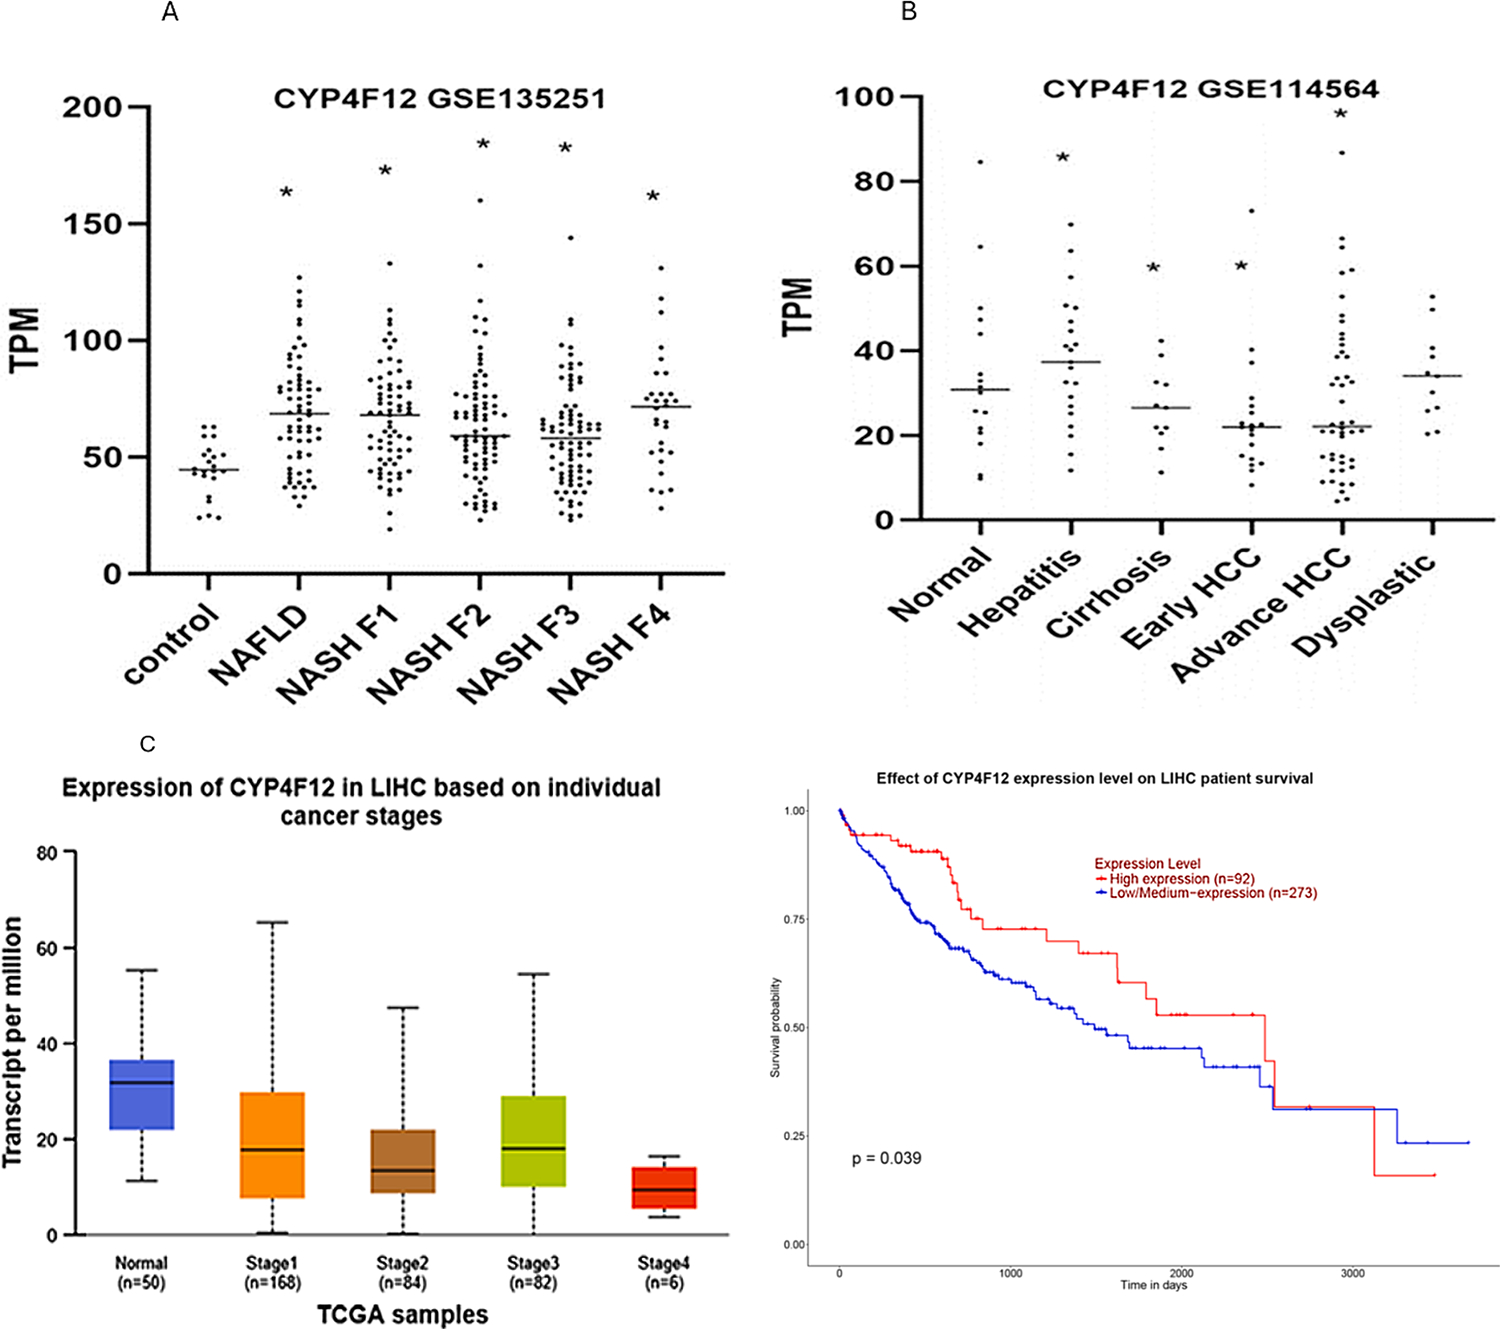
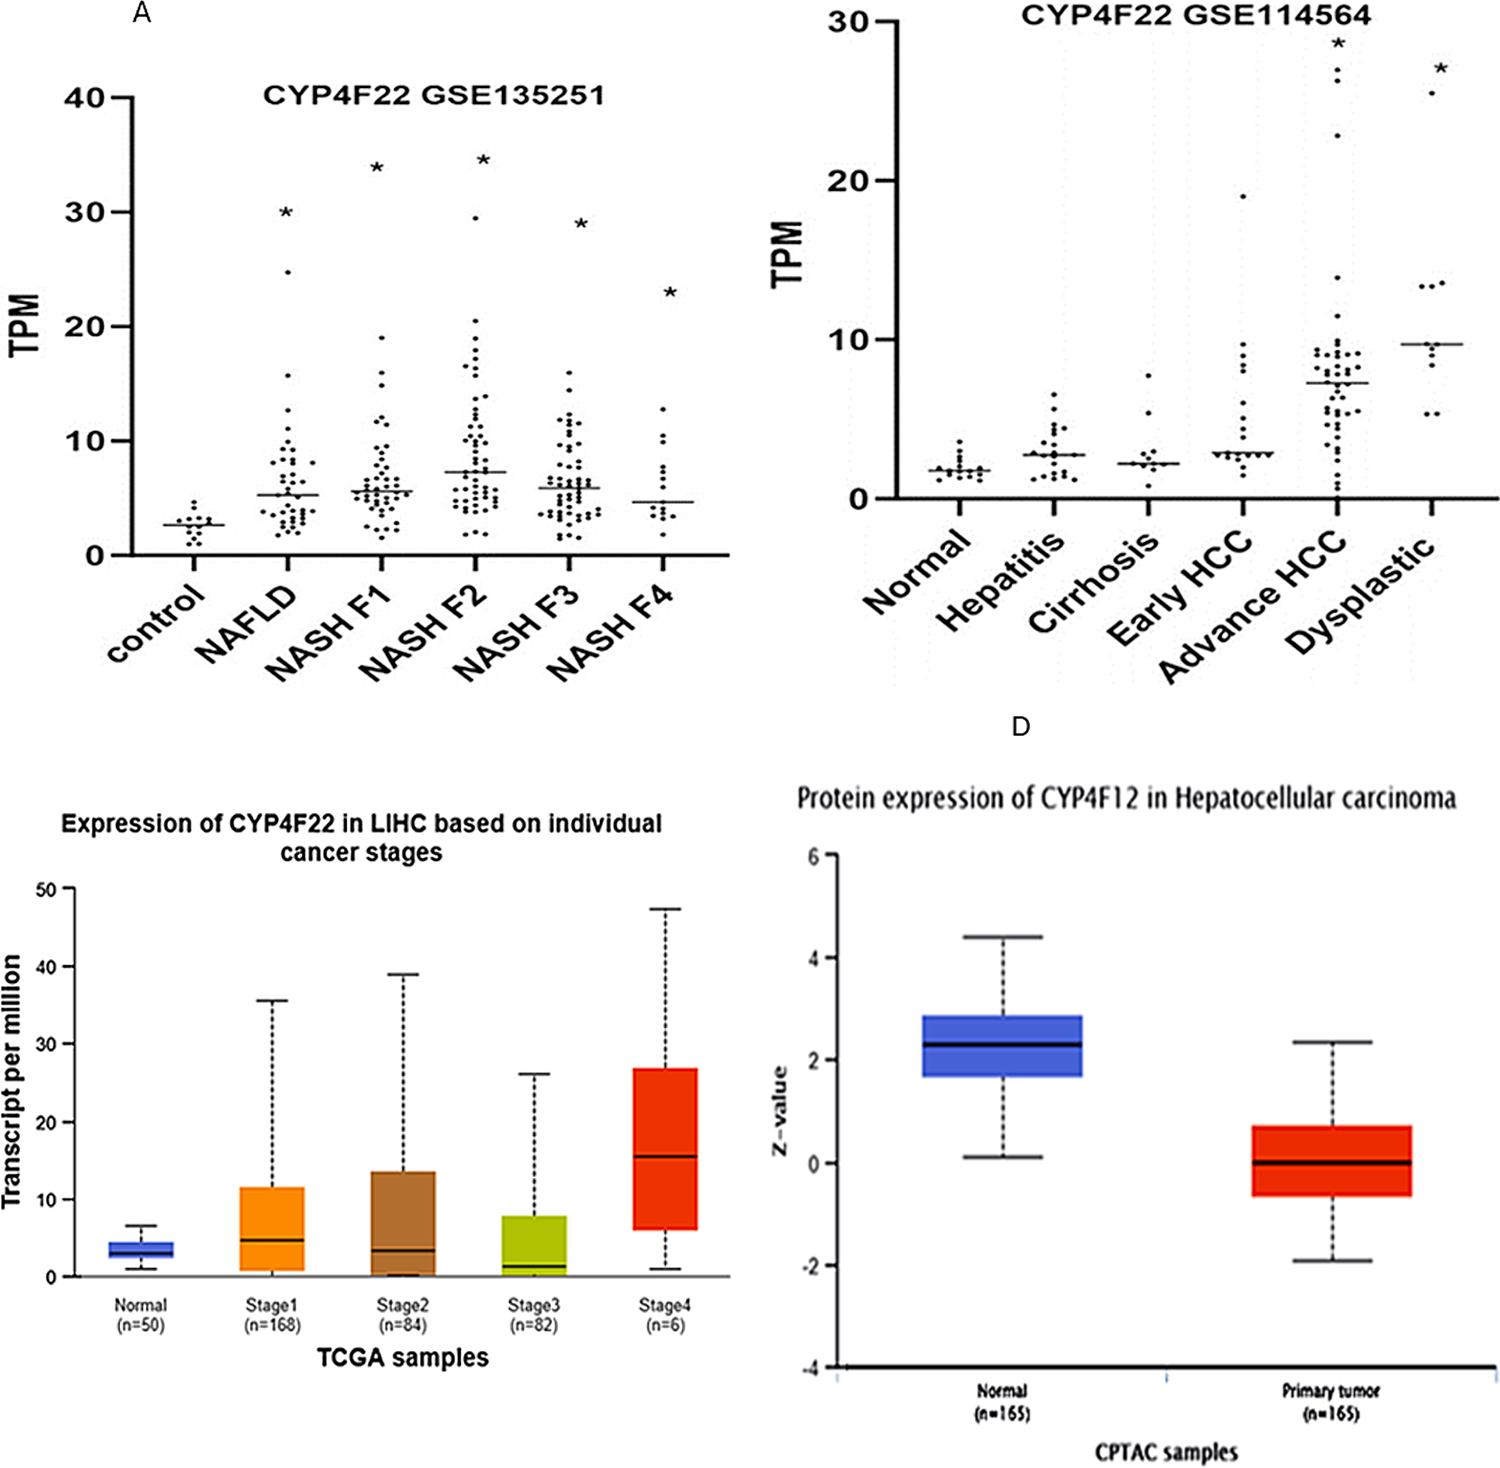
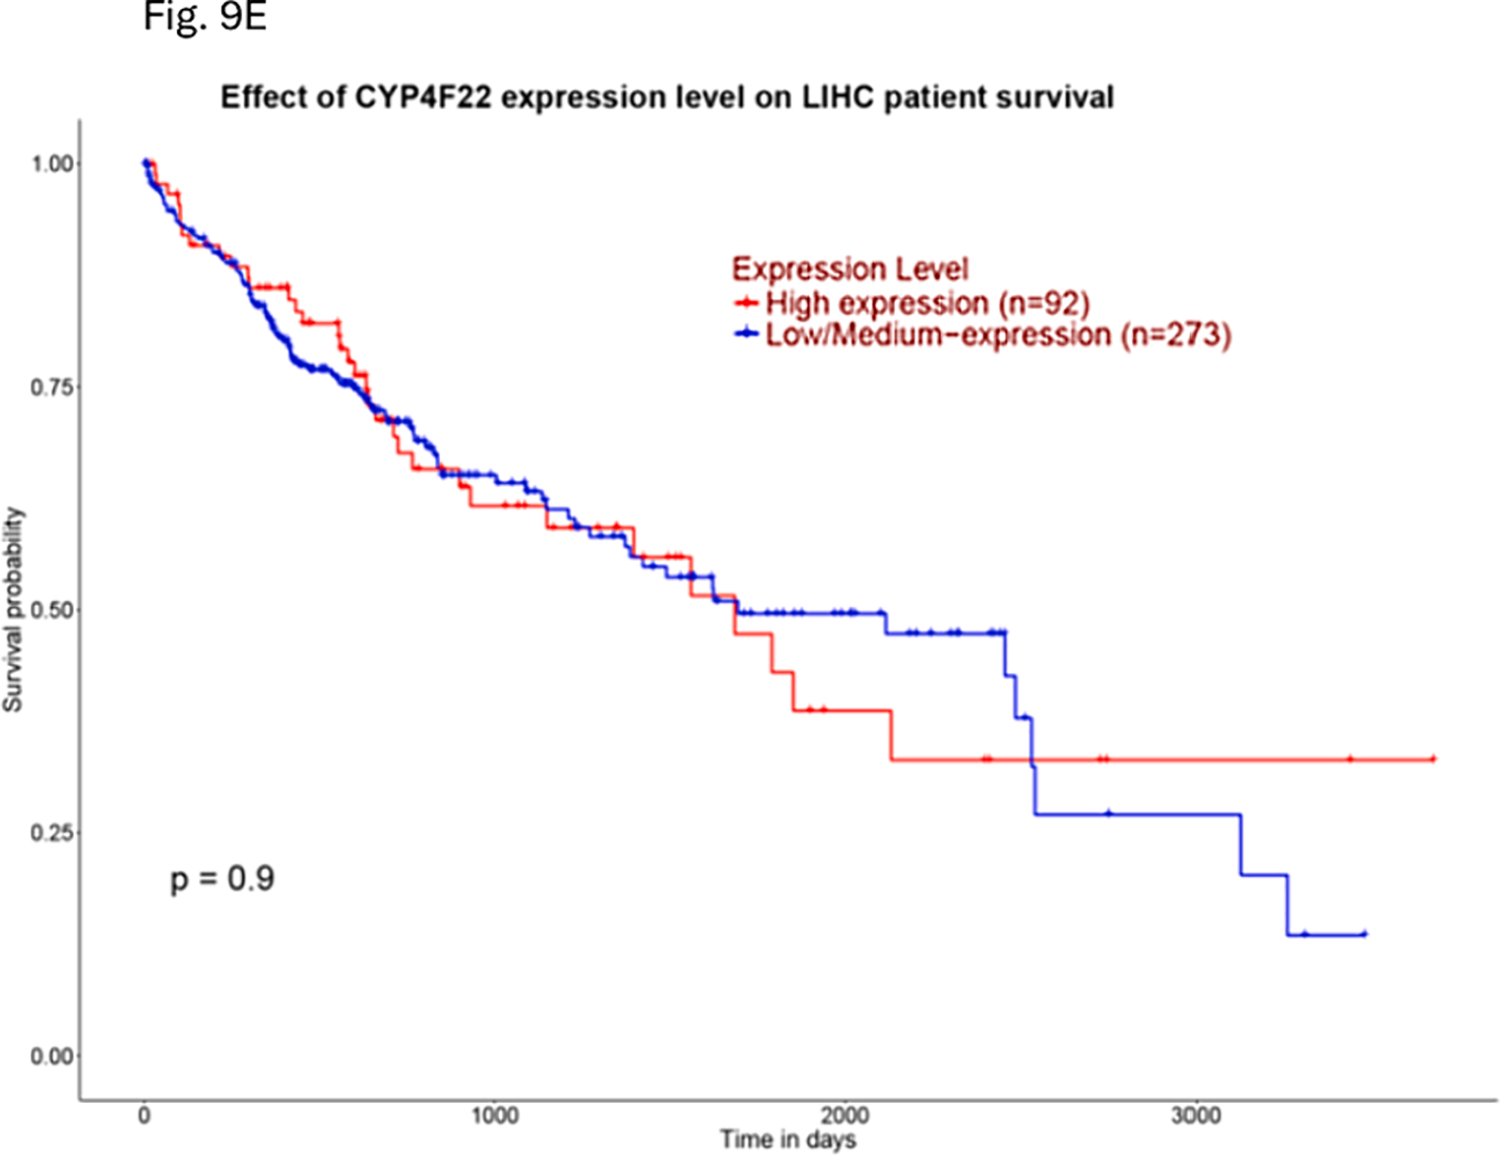
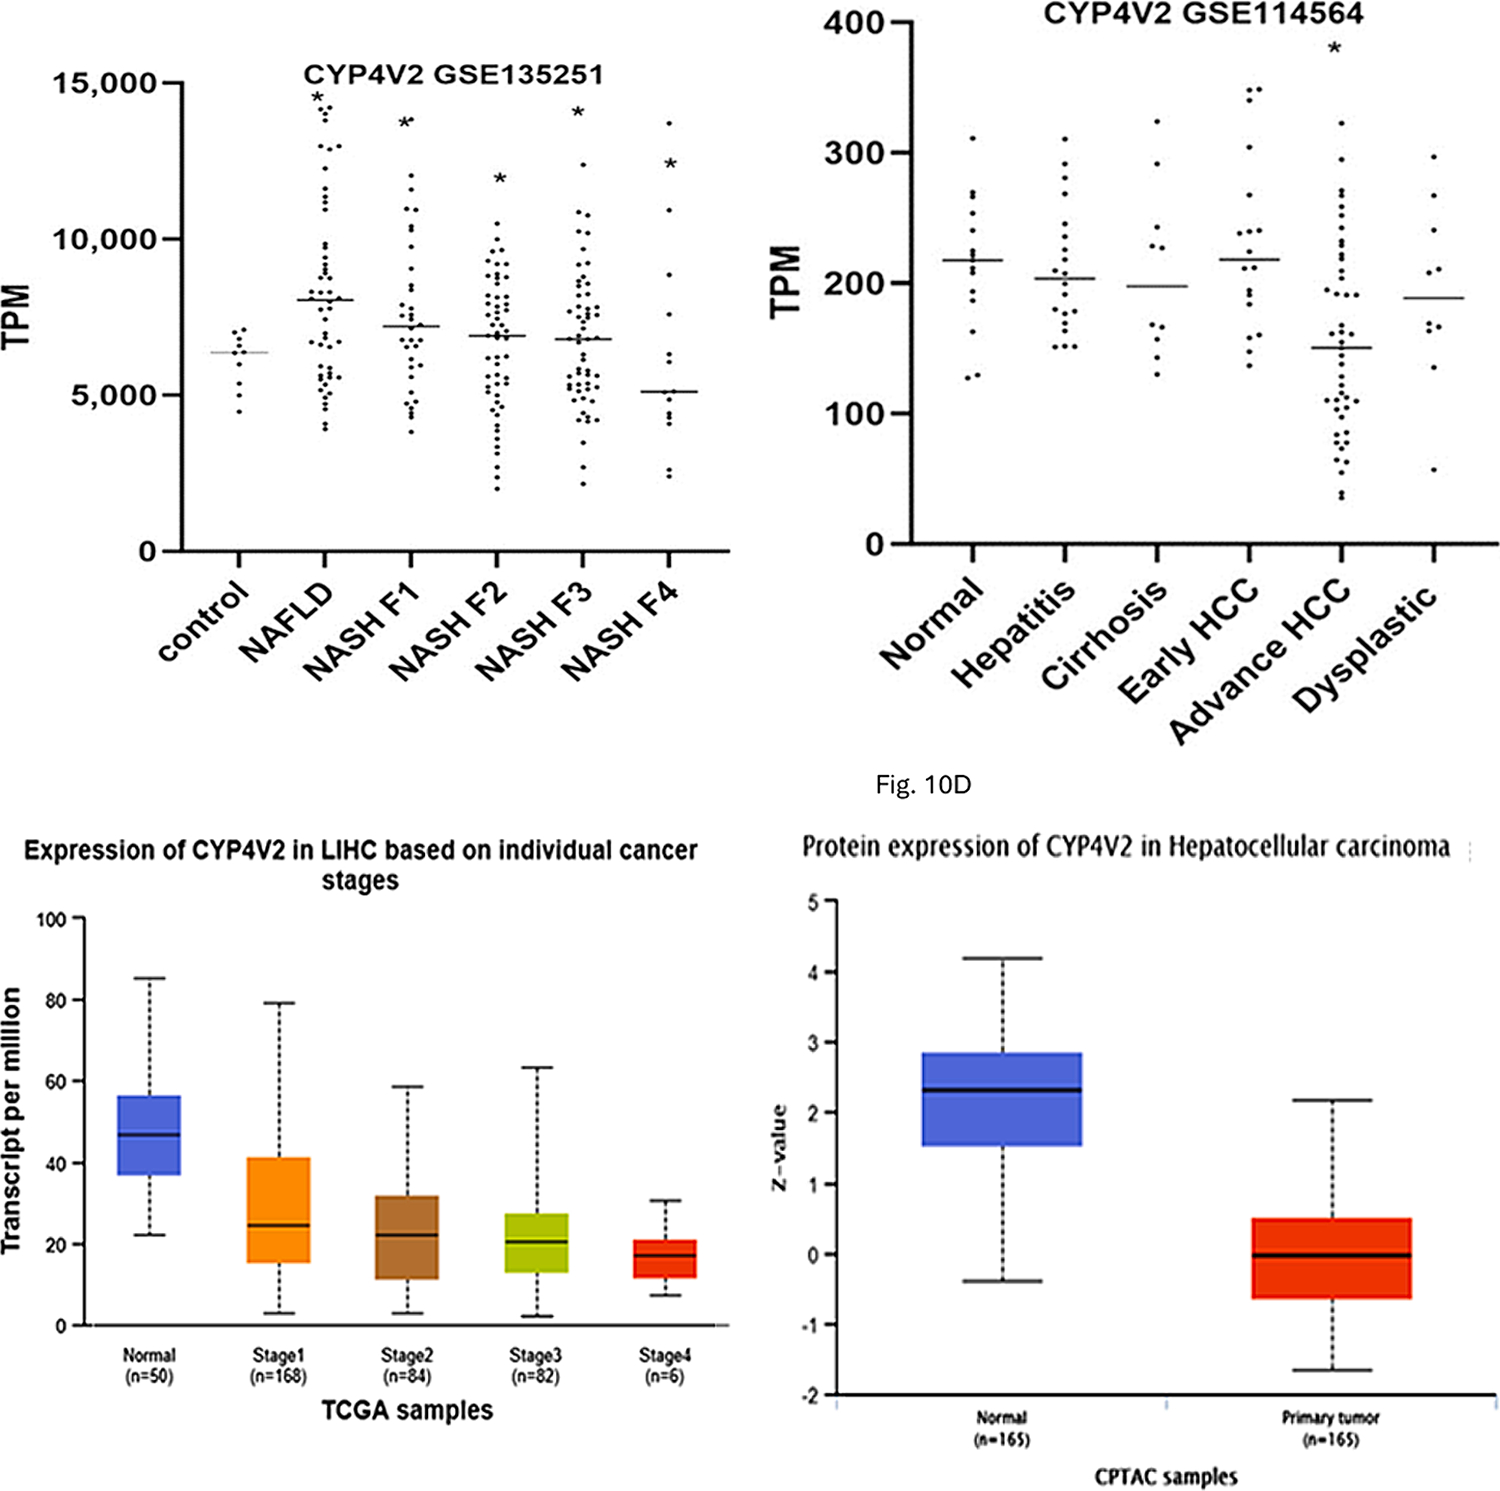
Fatty acid omega hydroxylase P450s consist of enzymes that hydroxylate various chain-length saturated and unsaturated fatty acids (FAs) and bioactive eicosanoid lipids. The human cytochrome P450 gene 4 family (CYP4) consists of 12 members that are associated with several human diseases. However, their role in the progression of metabolic dysfunction-associated fatty liver disease (MASLD) remains largely unknown. It has long been thought that the induction of CYP4 family P450 during fasting and starvation prevents FA-related lipotoxicity through FA metabolism to dicarboxylic acids that are chain-shortened in peroxisomes and then transported to the mitochondria for complete oxidation. Several studies have revealed that peroxisome succinate transported to the mitochondria is used for gluconeogenesis during fasting and starvation, and recent evidence suggests that peroxisome acetate can be utilized for lipogenesis and lipid droplet formation as well as epigenetic modification of gene transcription. In addition, omega hydroxylation of the bioactive eicosanoid arachidonic acid to 20-Hydroxyeicosatetraenoic acid (20-HETE) is essential for activating the GPR75 receptor, leading to vasoconstriction and cell proliferation. Several mouse models of diet-induced MASLD have revealed the induction of selective CYP4A members and the suppression of CYP4F during steatosis and steatohepatitis, suggesting a critical metabolic role in the progression of fatty liver disease. Thus, to further investigate the functional roles of CYP4 genes, we analyzed the differential gene expression of 12 members of CYP4 gene family in datasets from the Gene Expression Omnibus (GEO) from patients with steatosis, steatohepatitis, fibrosis, cirrhosis, and hepatocellular carcinoma. We also observed the differential expression of various CYP4 genes in the progression of MASLD, indicating that different CYP4 members may have unique functional roles in the metabolism of specific FAs and eicosanoids at various stages of fatty liver disease. These results suggest that targeting selective members of the CYP4A family is a viable therapeutic approach for treating and managing MASLD.

Keywords: Arachidonic acid; Fatty liver disease; Fibrosis; cirrhosis. Steatosis; cytochrome P450; hepatocellular carcinoma (HCC); metabolic dysfunction-associated steatotic liver disease (MASLD).


Conflict of interest statement

Declaration of competing interest The authors declare that they have no known competing financial interests or personal relationships that could have appeared to influence the work reported in this paper.

Figures

Fig. 1.
Fig. 1.. The role of ω-hydroxylase in the metabolism of fatty acids and Eicosanoids in MAFLD
Twelve members of the Human CYP4 gene family metabolize FA or eicosanoid metabolites (s)they metabolize. GRP75 is activated by the arachidonic metabolite 20-HETE to induce mechano-transduction to actin-myosin fibers through focal adhesion 2 (FAK2), whereas G-protein coupled receptor kinase interacting protein-1 (GIT1) releases c-Src to stimulate epithelial growth factor receptor (EGFR) transactivation. Gαq/11 release by GIT1 induces Ca2+ influx and vasoconstriction. Hydrogen peroxide-inducible clone 5 (Hic-5), associated with focal adhesion sites within the extracellular matrix (ECM) via integrins or GPR75, promotes fibrosis and proliferation. In contrast, the activation of unidentified EET receptors by epoxyeicosatrienoic acids (EET) induces vasodilation and angiogenesis. Lastly, CYP4 mediated ω-hydroxylation of FAs is converted to their respective dicarboxylic acids by alcohol dehydrogenase (ADH) and aldehyde dehydrogenase (ALDH) isozymes. These metabolites are taken up by peroxisomes through the ABCD3 transporter and chain-shortened by peroxisome β-oxidation to shorter chain dicarboxylic acids that are transported to mitochondria for complete β-oxidation or used as substrates by the liver for gluconeogenesis. The final product of peroxisome β-oxidation is acetate, which can be used as an energy source by peripheral tissues or as a substrate for lipogenesis in the liver. Acyl-CoA synthetase long-chain family member 4 (ACSVL4), acyl-CoA oxidase (ACOX1), Enoyl-CoA Hydratase, and 3-Hydroxyacyl-CoA Dehydrogenase (EHHADH), Hydroxysteroid 17-Beta Dehydrogenase 4 (HSD17B4), sterol acyl-CoA thioesterase carrier protein 2(SCP-2)/sterol carrier protein-x (SCPX), acyl-CoA thioesterase 4 (ACOT4), and acyl-CoA thioesterase 12 (ACOT12). ULFA, ultra-long chain FA.
Fig. 2.
Fig. 2.. Expression of 20-HETE CYP4A11 gene in the progression of MAFLD to cirrhosis and HCC
Transcripts per million (TPM) reads of CYP4A11 mRNA levels in patients with MAFLD and four stages of liver fibrosis in MASH in dataset GSE135251 (2A). CYP4A11 mRNA levels in liver hepatitis, cirrhosis, and different stages of HCC in the dataset GSE114564 (2B). Expression of CYP4A11 mRNA in very early (stage 1), early (stage 2), intermediate (stage 3), and very late (stage 4) HCC in the TCGA samples (2C). Protein expression of P4504A11 in primary HCC tumors from the Clinical Proteomic Tumor Analysis Consortium (CPTAC) samples (2D). Survival curves of HCC patients with high and low expression of CYP4A11 mRNA(2E). *p < 0.05.
Fig. 3.
Fig. 3.. Expression of CYP4A22 gene in the progression of MAFLD to cirrhosis and HCC
Transcripts per million reads of CYP4A22 mRNA levels in patients with NAFLD steatosis and four stages of liver fibrosis in MASH in the dataset GSE135251 (3A). CYP4A22 mRNA levels in liver hepatitis, cirrhosis, and different stages of HCC in the dataset GSE114564 (3B). Expression of CYP4A22 mRNA in very early (stage 1), early (stage 2), intermediate (stage 3), and very late (stage 4) HCC in TCGA samples (3). Protein expression of P4504A22 in primary HCC tumors obtained from CPTAC samples (3D). Survival curves of HCC patients with high and low expression of CYP4A22 mRNA (3E). *p < 0.05.
Fig. 4.
Fig. 4.. Expression of the 20-HETE CYP4F2 gene in the progression of MAFLD to cirrhosis and HCC
Transcripts per million reads of CYP4F2 mRNA levels in patients with MAFLD and four stages of liver fibrosis in MASH in the dataset GSE135251 (4A). CYP4F2 mRNA levels in liver hepatitis, cirrhosis, and different stages of hepatocellular carcinoma (HCC) in the dataset GSE114564 (4B). Expression of CYP4F2 mRNA in very early (stage 1), early (stage 2), intermediate (stage 3), and very late (stage 4) HCC in TCGA samples (Fig. 4C). Protein expression of P4504F2 in primary HCC tumors obtained from CPTAC samples (4D). Survival curves of HCC patients with high and low expression of CYP4F2 mRNA (4E). *p < 0.05.
Fig. 5.
Fig. 5.. Expression of the 20-OH LTB4 CYP4F3A gene in the progression of MAFLD to cirrhosis and HCC
Transcripts per million reads of CYP4F3A mRNA levels in patients with MAFLD and four stages of liver fibrosis in MASH in the dataset GSE135251 (5A). CYP4F3A mRNA levels in liver hepatitis, cirrhosis, and different stages of HCC in the dataset GSE114564 (5B). Expression of CYP4F3A mRNA in very early (stage 1), early (stage 2), intermediate (stage 3), and very late (stage 4) HCC in TCGA samples (Fig. 5D). Protein expression of P4504F3A in primary HCC tumors derived from CPTAC samples (2D). Survival curves of HCC patients with high and low expression of CYP4F3A mRNA (5E). *p < 0.05.
Fig. 6.
Fig. 6.. Expression of the prostaglandin hydroxylase CYP4F8 gene in the progression of MAFLD to cirrhosis and HCC
Transcripts per million reads of CYP4F8 mRNA levels in patients with MAFLD and four stages of liver fibrosis in MASH in dataset GSE135251 (6A). CYP4AF8 mRNA levels in liver hepatitis, cirrhosis and different stages of HCC in dataset GSE114564 (6B). Expression of CYP4F8 mRNA in hepatocellular carcinoma, fibrolamellar carcinoma, and hepato-cholangiocarcinoma in TCGA samples (6C). *p < 0.05.
Fig. 7.
Fig. 7.. Expression of steric acid ω-hydroxylase CYP4F11 gene in the progression of MAFLD to cirrhosis and HCC
Transcripts per million reads of CYP4F11 mRNA levels in patients with MAFLD and four stages of liver fibrosis in MASH in dataset GSE135251 (7A). CYP4AF11 mRNA levels in liver hepatitis, cirrhosis and different stages of HCC in dataset GSE114564 (7B). Expression of CYP4F11 mRNA in very early (stage 1), early (stage 2), intermediate (stage 3) and very late (stage 4) of HCC in TCGA samples (7C). Protein expression of P4504F11 in primary HCC tumors from CPTAC samples (7D). Patient survival curves of HCC patients with high and low expression of CYP4F11 mRNA (7E). *p < 0.05.
Fig. 8.
Fig. 8.. Expression of PGH2 hydroxylase CYP4F12 gene in the progression of MAFLD to cirrhosis and HCC
Transcripts per million reads of CYP4F12 mRNA levels in patients with MAFLD and four stages of liver fibrosis in MASH in dataset GSE135251 (8A). CYP4AF12 mRNA levels in liver hepatitis, cirrhosis and different stages of HCC in dataset GSE114564 (8B). Expression of CYP4F12 mRNA in very early (stage 1), early (stage 2), intermediate (stage 3) and very late (stage 4) of HCC in TCGA samples (8C). Protein expression of P4504F12 in primary HCC tumors from CPTAC samples (8D). Patient survival curves of HCC patients with high and low expression of CYP4F12 mRNA (8E). *p < 0.05.
Fig. 9.
Fig. 9.. Expression of ultra very long chain ω-hydroxylase CYP4F22 gene in the progression of MAFLD to cirrhosis and HCC
Transcripts per million reads of CYP4F22 mRNA levels in patients with MAFLD and four stages of liver fibrosis in MASH in dataset GSE135251 (9A). CYP4AF22 mRNA levels in liver hepatitis, cirrhosis and different stages of HCC in dataset GSE114564 (9B). Expression of CYP4F22 mRNA in very early (stage 1), early (stage 2), intermediate (stage 3) and very late (stage 4) of HCC in TCGA samples (9C). Protein expression of P4504F22 in primary HCC tumors from CPTAC samples (9D). Patient survival curves of HCC patients with high and low expression of CYP4F22 mRNA (9E). *p < 0.05.
Fig. 10.
Fig. 10.. Expression of myristic acid ω-hydroxylase CYP4V2 gene in the progression of MAFLD to cirrhosis and HCC
Transcripts per million reads of CYP4V2 mRNA levels in patients with MAFLD and four stages of liver fibrosis in MASH in dataset GSE135251 (10A). CYP4V2 mRNA levels in liver hepatitis, cirrhosis and different stages of HCC in dataset GSE114564 (10B). Expression of CYP4V2 mRNA in very early (stage 1), early (stage 2), intermediate (stage 3) and very late (stage 4) of HCC in TCGA samples (10C). Protein expression of P4504V2 in primary HCC tumors from CPTAC samples (10D). Patient survival curves of HCC patients with high and low expression of CYP4V2 mRNA (10E). *p < 0.05.
Fig. 11.
Fig. 11.. Expression of octanoic acid ω-hydroxylase CYP4B1 gene in the progression of MAFLD to cirrhosis and HCC
Transcripts per million reads of CYP4B1 mRNA levels in patients with MAFLD and four stages of liver fibrosis in MASH in dataset GSE135251 (11A). CYP4AF22 mRNA levels in liver hepatitis, cirrhosis and different stages of HCC in dataset GSE114564 (11B). Expression of CYP4B1 mRNA in very early (stage 1), early (stage 2), intermediate (stage 3) and very late (stage 4) of HCC in TCGA samples (11C). Patient survival curves of HCC patients with high and low expression of CYP4B1 mRNA (11D). *p < 0.05.
Fig. 12.
Fig. 12.. Expression of arachidonic acid epoxygenase (EET) CYP4X1 gene in the progression of MAFLD to cirrhosis and HCC
Transcripts per million reads of CYP4X1 mRNA levels in patients with MAFLD and four stages of liver fibrosis in MASH in dataset GSE135251 (12A). CYP4AX1 mRNA levels in liver hepatitis, cirrhosis and different stages of HCC in dataset GSE114564 (12B). Expression of CYP4F22 mRNA in very early (stage 1), early (stage 2), intermediate (stage 3) and very late (stage 4) of HCC in TCGA samples (12C). Patient survival curves of HCC patients with high and low expression of CYP4F2 mRNA (9D). *p < 0.05.
Fig. 13.
Fig. 13.. Expression of arachidonic acid epoxygenase (EET) CYP4Z1 gene in the progression of MAFLD to cirrhosis and HCC
Transcripts per million reads of CYP4Z1 mRNA levels in patients with MAFLD and four stages of liver fibrosis in MASH in dataset GSE135251 (13A). CYP4AF22 mRNA levels in liver hepatitis, cirrhosis and different stages of HCC in dataset GSE114564 (13B). Expression of CYP4Z1 mRNA in very early (stage 1), early (stage 2), intermediate (stage 3) and very late (stage 4) of HCC in TCGA samples (13C). Patient survival curves of HCC patients with high and low expression of CYP4F2 mRNA (13D). *p < 0.05.
Fig. 14.
Fig. 14.. Expression of CYP3A4, CYP2E1, PNPLA3 and MBOAT7 in MAFLD, Fibrosis, Cirrhosis and HCC.
Transcripts per million reads (TPM) of CYP3A4 mRNA levels are determined in patients with MAFLD, fibrosis (14A), liver cirrhosis, and HCC (14B). Expression of CYP2E1 mRNA levels in progression of MAFLD (14C) and livers from patients with hepatitis, cirrhosis and HCC (14D). PNPLA3 (Calcium-independent phospholipase A2-epsilon) mRNA levels in dataset GSE135251 (14E) and GSE114564 (14F). Expression of the Lysophospholipid acyltransferase 7 (MBOAT7) gene in datasets GSE134251(14G) and GSE114564 (14H). *p < 0.05.

Similar articles

Cited by

References

    1. Garcia V, Gilani A, Shkolnik B, Pandey V, Zhang FF, Dakarapu R, Gandham SK, Reddy NR, Graves JP, Gruzdev A, Zeldin DC, Capdevila JH, Falck JR, Schwartzman ML, 20-HETE Signals Through G-Protein-Coupled Receptor GPR75 (G(q)) to Affect Vascular Function and Trigger Hypertension, Circ. Res 120 (11) (2017) 1776–1788. - PMC - PubMed
    1. Park SK, Herrnreiter A, Pfister SL, Gauthier KM, Falck BA, Falck JR, Campbell WB, GPR40 is a low-affinity epoxyeicosatrienoic acid receptor in vascular cells, J. Biol. Chem 293 (27) (2018) 10675–10691. - PMC - PubMed
    1. Buch S, Stickel F, Trepo E, Way M, Herrmann A, Nischalke HD, Brosch M, Rosendahl J, Berg T, Ridinger M, Rietschel M, McQuillin A, Frank J, Kiefer F, Schreiber S, Lieb W, Soyka M, Semmo N, Aigner E, Datz C, Schmelz R, Bruckner S, Zeissig S, Stephan AM, Wodarz N, Deviere J, Clumeck N, Sarrazin C, Lammert F, Gustot T, Deltenre P, Volzke H, Lerch MM, Mayerle J, Eyer F, Schafmayer C, Cichon S, Nothen MM, Nothnagel M, Ellinghaus D, Huse K, Franke A, Zopf S, Hellerbrand C, Moreno C, Franchimont D, Morgan MY, Hampe J, A genome-wide association study confirms PNPLA3 and identifies TM6SF2 and MBOAT7 as risk loci for alcohol-related cirrhosis, Nat. Genet 47 (12) (2015) 1443–1448. - PubMed
    1. Longo M, Meroni M, Paolini E, Erconi V, Carli F, Fortunato F, Ronchi D, Piciotti R, Sabatini S, Macchi C, Alisi A, Miele L, Soardo G, Comi GP, Valenti L, Ruscica M, Fracanzani AL, Gastaldelli A, Dongiovanni P, TM6SF2/PNPLA3/MBOAT7 Loss-of-Function Genetic Variants Impact on NAFLD Development and Progression Both in Patients and in In Vitro Models, Cell. Mol. Gastroenterol. Hepatol 13 (3) (2022) 759–788. - PMC - PubMed
    1. Mansoor S, Maheshwari A, Di Guglielmo M, Furuya K, Wang M, Crowgey E, Molle-Rios Z, He Z, The PNPLA3 rs738409 Variant but not MBOAT7 rs641738 is a Risk Factor for Nonalcoholic Fatty Liver Disease in Obese U.S, Children of Hispanic Ethnicity, Pediatr Gastroenterol Hepatol Nutr 24 (5) (2021) 455–469. - PMC - PubMed

Substances