. 2025 Feb;232(2):230.e1-230.e19.
doi: 10.1016/j.ajog.2024.04.034. Epub 2024 Apr 30.

High rates of placental inflammation among samples collected by the Multi-Omics for Mothers and Infants consortium

Affiliations

High rates of placental inflammation among samples collected by the Multi-Omics for Mothers and Infants consortium

Joshua F Robinson et al. Am J Obstet Gynecol. 2025 Feb.

Abstract

Background: The Multi-Omics for Mothers and Infants consortium aims to improve birth outcomes. Preterm birth is a major obstetrical complication globally and causes significant infant and childhood morbidity and mortality.

Objective: We analyzed placental samples (basal plate, placenta or chorionic villi, and the chorionic plate) collected by the 5 Multi-Omics for Mothers and Infants sites, namely The Alliance for Maternal and Newborn Health Improvement Bangladesh, The Alliance for Maternal and Newborn Health Improvement Pakistan, The Alliance for Maternal and Newborn Health Improvement Tanzania, The Global Alliance to Prevent Prematurity and Stillbirth Bangladesh, and The Global Alliance to Prevent Prematurity and Stillbirth Zambia. The goal was to analyze the morphology and gene expression of samples collected from preterm and uncomplicated term births.

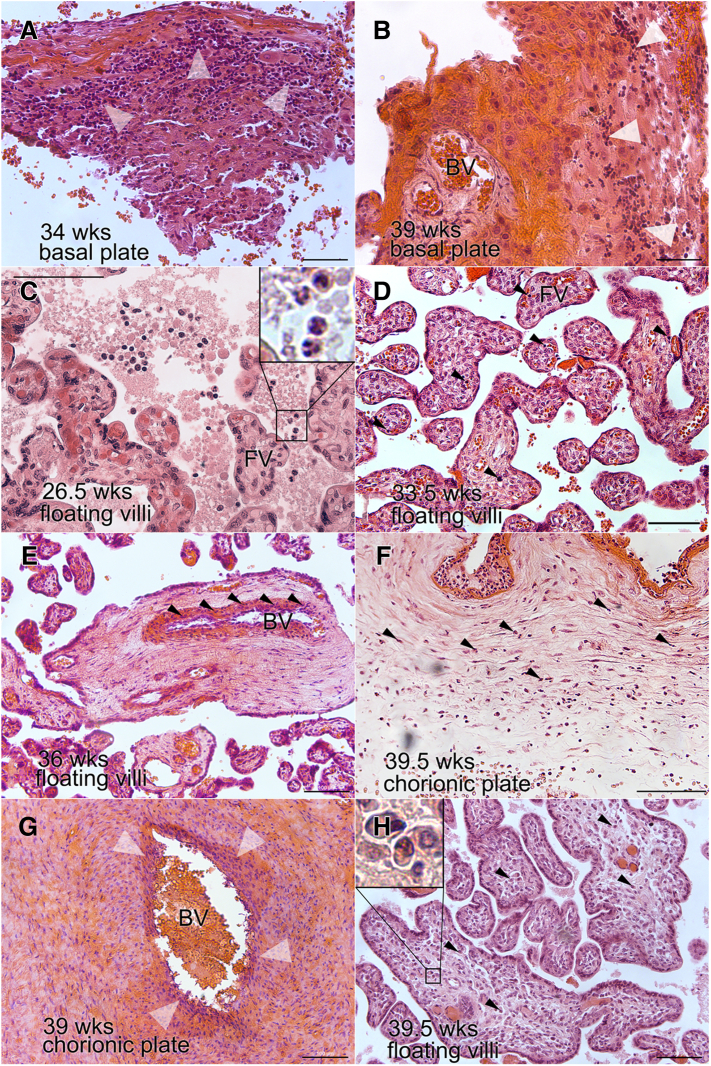
Study design: The teams provided biopsies from 166 singleton preterm (<37 weeks' gestation) and 175 term (≥37 weeks' gestation) deliveries. The samples were fixed in formalin and paraffin embedded. Tissue sections from these samples were stained with hematoxylin and eosin and subjected to morphologic analyses. Other placental biopsies (n=35 preterm, 21 term) were flash frozen, which enabled RNA purification for bulk transcriptomics.

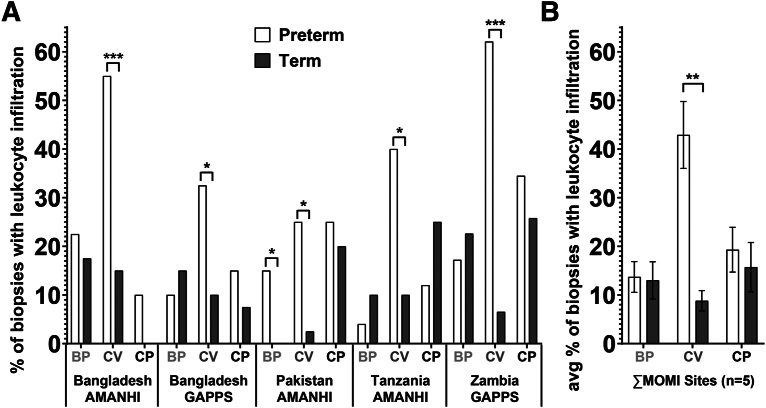
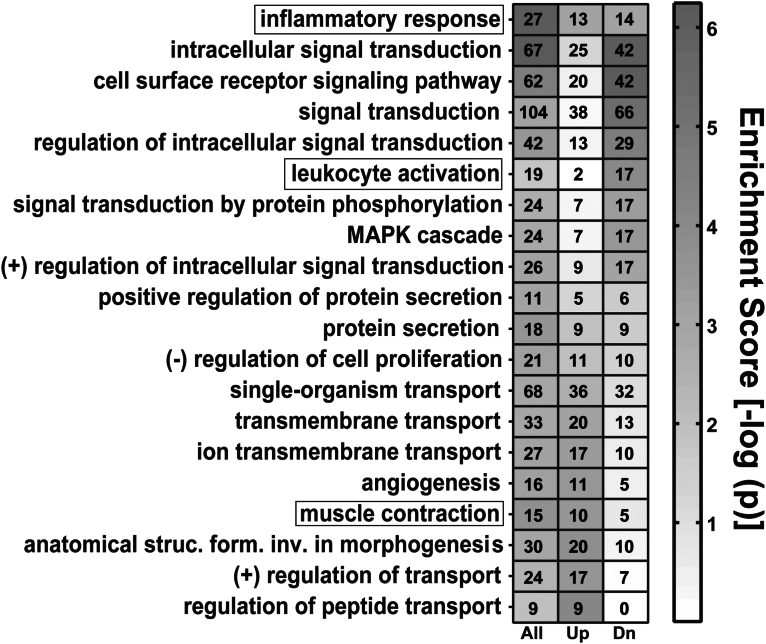
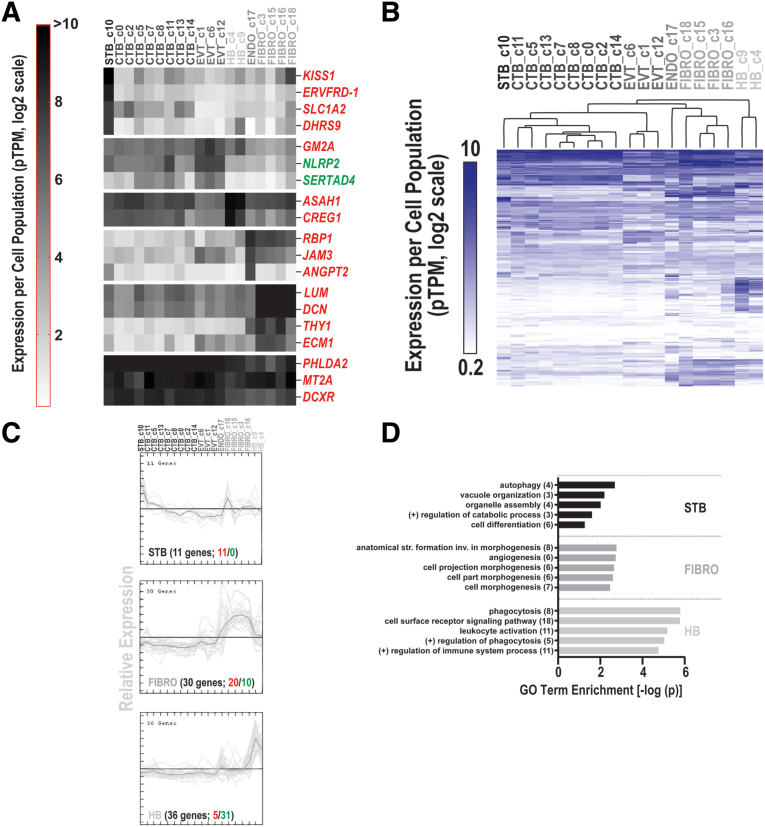
Results: The morphologic analyses revealed a surprisingly high rate of inflammation that involved the basal plate, placenta or chorionic villi, and the chorionic plate. The rate of inflammation in chorionic villus samples, likely attributable to chronic villitis, ranged from 25% (Pakistan site) to 60% (Zambia site) of cases. Leukocyte infiltration in this location vs in the basal plate or chorionic plate correlated with preterm birth. Our transcriptomic analyses identified 267 genes that were differentially expressed between placentas from preterm vs those from term births (123 upregulated, 144 downregulated). Mapping the differentially expressed genes onto single-cell RNA sequencing data from human placentas suggested that all the component cell types, either singly or in subsets, contributed to the observed dysregulation. Consistent with the histopathologic findings, gene ontology analyses highlighted the presence of leukocyte infiltration or activation and inflammatory responses in both the fetal and maternal compartments.

Conclusion: The relationship between placental inflammation and preterm birth is appreciated in developed countries. In this study, we showed that this link also exists in developing geographies. In addition, among the participating sites, we found geographic- and population-based differences in placental inflammation and preterm birth, suggesting the importance of local factors.

Keywords: chorionic villi; chronic villitis; inflammation; parturition; placenta; pregnancy; prematurity preterm birth; transcriptomics.


Figures

Figure 1
Figure 1
Composition of full thickness placental biopsies The bars indicate the percentage of biopsies that contained the basal plate (BP), chorionic villi (CV) or the chorionic plate (CP). The results are grouped by outcome (preterm birth [PTB] or term delivery). AMANHI, The Alliance for Maternal and Newborn Health Improvement; BP, basal plate; CP, chorionic plate; CV, chorionic villi; GAPPS, The Global Alliance to Prevent Prematurity and Stillbirth; MOMI, Multi-Omics for Mothers and Infants; PTB, preterm birth. Robinson. Inflammationamong placentas from Multi-Omics for Mothers and Infants sites. Am J Obstet Gynecol 2025.
Figure 2
Figure 2
Microscopic evidence of increased inflammation in the placental chorionic villus compartment The bars indicate the percentage of biopsies that had evidence of leukocyte infiltration in either the basal plate (BP), chorionic villi (CV), or the chorionic plate (CP). The results are shown for the individual sites (A) and the consortium as a whole (B). The white bars indicate preterm births (<37 weeks’ gestation); the black bars indicate term births (≥37 weeks’ gestation). The asterisks denote significant differences between PTB and term births, determined using Fisher’s exact tests (panel A) or unpaired t tests (Panel B). Asterisk indicates P<.05; double asterisks indicate P<.005; and triple asterisks indicate P<.0005. AMANHI, The Alliance for Maternal and Newborn Health Improvement; BP, basal plate; CP, chorionic plate; CV, chorionic villi; GAPPS, The Global Alliance to Prevent Prematurity and Stillbirth; MOMI, Multi-Omics for Mothers and Infants; PTB, preterm birth. Robinson. Inflammation among placentas from Multi-Omics for Mothers and Infants sites. Am J Obstet Gynecol 2025.
Figure 3
Figure 3
Examples of inflammatory lesions observed in the placental biopsies A, Basal plate: at the maternal-fetal interface, robust leukocyte infiltration (arrowheads) of the decidua was the most frequent finding. B, In some cases, the perivascular regions of uterine blood vessels (BVs) were infiltrated along with the decidua (arrowheads). Chorionic villi: leukocyte infiltration was most frequently associated with chorionic villi from the preterm group (Figure 2). C, An example of cells with a neutrophil morphology in the intervillous space (see inset). D, Hofbauer cell (fetal macrophage; arrowheads) infiltration of the villus stroma in a PTB case. E, Leukocyte infiltration (arrowheads) of a BV and its walls within the villus stroma. F, Chorionic plate: leukocyte infiltration was a relatively common feature (arrowheads), (G) which sometimes involved the BVs in this region (arrowheads). H, Rare pathologic features: in this example, there was abundant plasma cell infiltrate (arrowheads) of the chorionic villous stroma (see inset). Bars = 100 μm. BV, blood vessel; FV, floating villi; PTB, preterm birth. Robinson. Inflammation among placentas from Multi-Omics for Mothers and Infants sites. Am J Obstet Gynecol 2025.
Figure 4
Figure 4
Global gene expression analysis of placentas from preterm and term births revealed DE genes Uniform Manifold Approximation and Projection (UMAP) analysis showed that samples failed to cluster according to (A) collection site or (B) gestational age at birth. C, Volcano plot displaying significance (y-axis) and mean fold change (FC) (x-axis) differences in gene expression between preterm and term chorionic villi. Red indicates up-regulated genes (n=123) and blue indicates down-regulated genes (n=144). AMANHI, The Alliance for Maternal and Newborn Health Improvement; DE, differentially expressed; FC, fold change; GAPPS, The Global Alliance to Prevent Prematurity and Stillbirth; UMAP, Uniform Manifold Approximation and Projection. Robinson. Inflammation among placentas from Multi-Omics for Mothers and Infants sites. Am J Obstet Gynecol 2025.
Figure 5
Figure 5
Mapping of DE genes to GO biological processes In total, 20 GO terms were enriched in genes that were DE between preterm and term chorionic villi (P<.001; n≥8 DE genes per pathway). The total number of genes (All), as well as those that were up-regulated (Up) and down-regulated (Dn), is shown. Shading denotes significance (−log [P]). DE, differentially expressed; GO, gene ontology. Robinson. Inflammation among placentas from Multi-Omics for Mothers and Infants sites. Am J Obstet Gynecol 2025.
Figure 6
Figure 6
Single-cell transcriptomic profiles of DE genes A, Examples of placental genes with cell type– and subtype-specific expression patterns. Genes are color coded based on predicted dysregulation in PTB vs term (up-regulated, red; down-regulated green). B, Hierarchical clustering of the DE genes revealed cell type specificity. C, K-means clustering analysis identified clusters that were specific to syncytiotrophoblasts (STBs) (n=11), fibroblasts (FIBRO) (n=30), or Hofbauer cells (HB) (n=36). D, Shows the GO biologic process enrichment analysis of the population-specific clusters. The 5 most significantly enriched terms are shown for each cluster. CTB, cytotrophoblast; DE, differentially expressed; Endo, endothelial cells; EVT, extravillous trophoblast; FIBRO, fibroblasts; HB, Hofbauer cells; PTB, preterm birth; STB, syncytiotrophoblast. Robinson. Inflammation among placentas from Multi-Omics for Mothers and Infants sites. Am J Obstet Gynecol 2025.
Figure 7
Figure 7
qRT-PCR validation of selected targets A, Confirmation of targets in PTB cases (n=36) vs term controls (n=20) via qRT-PCR. The asterisks represent significant differences between PTB and term controls (t test; asterisk indicates P<.05; double asterisks indicate P<.005). B, Correlation between average fold change (FC) values for candidate genes derived using qRT-PCR and those derived using RNA-seq (R2=.98). FC, fold change; PTB, preterm birth; qRT-PCR, quantitative reverse transcriptase–polymerase chain reaction; RNA-seq, RNA sequencing. Robinson. Inflammation among placentas from Multi-Omics for Mothers and Infants sites. Am J Obstet Gynecol 2025.
Supplemental Figure 1
DE genes in selected GO pathways A, GO pathways replicated from Figure 5. B, Inflammatory response pathway. C, Leukocyte activation. D, Muscle contraction. DE, differentially expressed; GO, gene ontology. Robinson. Inflammation among placentas from Multi-Omics for Mothers and Infants sites. Am J Obstet Gynecol 2025.
Supplemental Figure 2
The MOMI data vs Sobhani et al, 2022 A, A meta-analysis of 3 published placental transcriptomic data sets (total PTB cases, n=11 vs total term controls, n=15) identified 174 genes that were DE in cases vs controls. An aggregated analysis that included the MOMI data (267 DE genes) revealed that 9 genes were common in all 4 studies. B, As shown in the heatmap, they were also regulated in the same manner. C, Shows the gene expression levels of individual samples in comparison with their average control values in the Sobhani meta-analysis and the MOMI data set. Plotting of the data in panel C showed that expression of (D) ASB2, (E) SERTAD4, and (F) CA1 significantly correlated (P<.0001) with gestational age at birth. DE, differentially expressed; MOMI, Multi-Omics for Mothers and Infants. Robinson. Inflammation among placentas from Multi-Omics for Mothers and Infants sites. Am J Obstet Gynecol 2025.

References

    1. Preterm birth. World Health Organization. 2018. https://www.who.int/news-room/fact-sheets/detail/preterm-birth Available at: Accessed April 20, 2023.
    1. Liu L., Oza S., Hogan D., et al. Global, regional, and national causes of under-5 mortality in 2000–15: an updated systematic analysis with implications for the Sustainable Development Goals. Lancet. 2016;388:3027–3035. - PMC - PubMed
    1. Halloran D.R., Alexander G.R. Preterm delivery and age of SIDS death. Ann Epidemiol. 2006;16:600–606. - PubMed
    1. Urs R., Kotecha S., Hall G.L., Simpson S.J. Persistent and progressive long-term lung disease in survivors of preterm birth. Paediatr Respir Rev. 2018;28:87–94. - PubMed
    1. Luu T.M., Rehman Mian M.O., Nuyt A.M. Long-term impact of preterm birth: neurodevelopmental and physical health outcomes. Clin Perinatol. 2017;44:305–314. - PubMed