. 2024;18(2):101348.
doi: 10.1016/j.jcmgh.2024.04.005. Epub 2024 Apr 30.

RASSF4 Attenuates Metabolic Dysfunction-Associated Steatotic Liver Disease Progression via Hippo Signaling and Suppresses Hepatocarcinogenesis

Affiliations

RASSF4 Attenuates Metabolic Dysfunction-Associated Steatotic Liver Disease Progression via Hippo Signaling and Suppresses Hepatocarcinogenesis

Chaofei Xu et al. Cell Mol Gastroenterol Hepatol. 2024.

Abstract

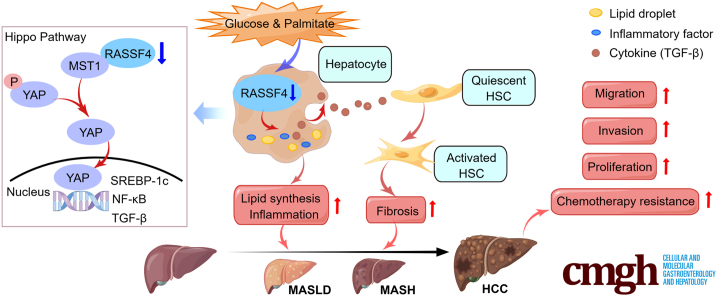
Background & aims: Metabolic dysfunction-associated steatotic liver disease (MASLD) is a dynamic chronic liver disease closely related to metabolic abnormalities such as diabetes and obesity. MASLD can further progress to metabolic dysfunction-associated steatohepatitis (MASH), fibrosis, cirrhosis, and even hepatocellular carcinoma (HCC). However, the mechanisms underlying the progression of MASLD and further progression to liver fibrosis and liver cancer are unknown.

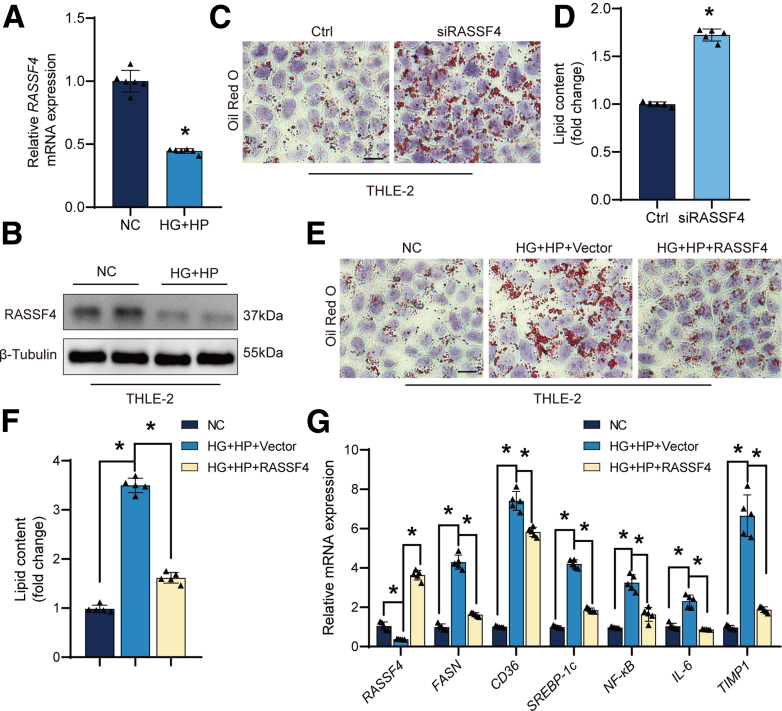
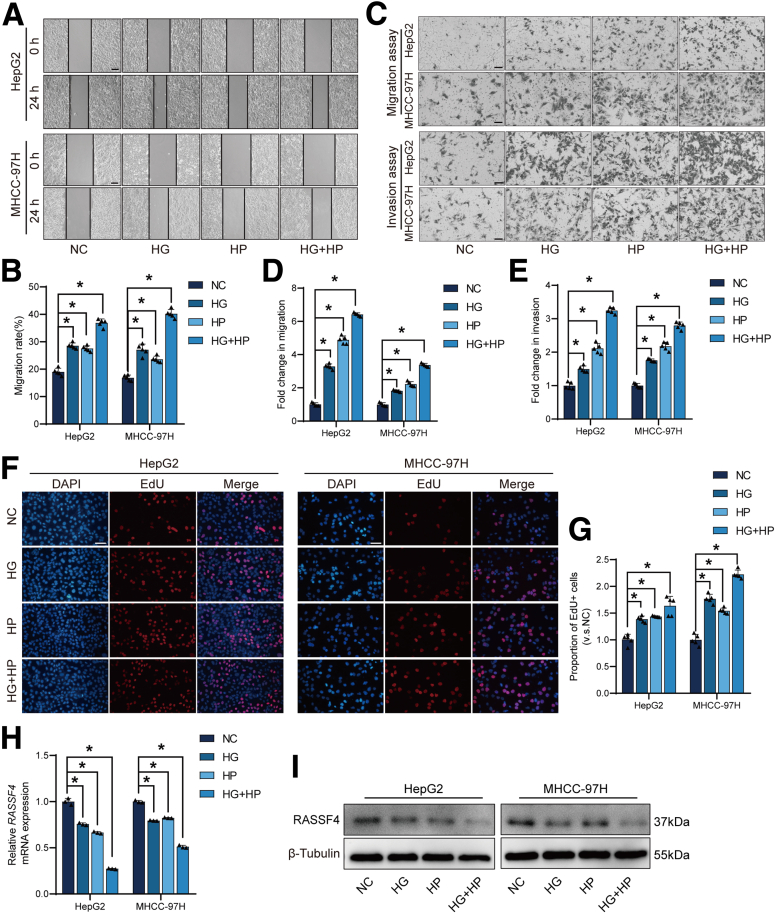
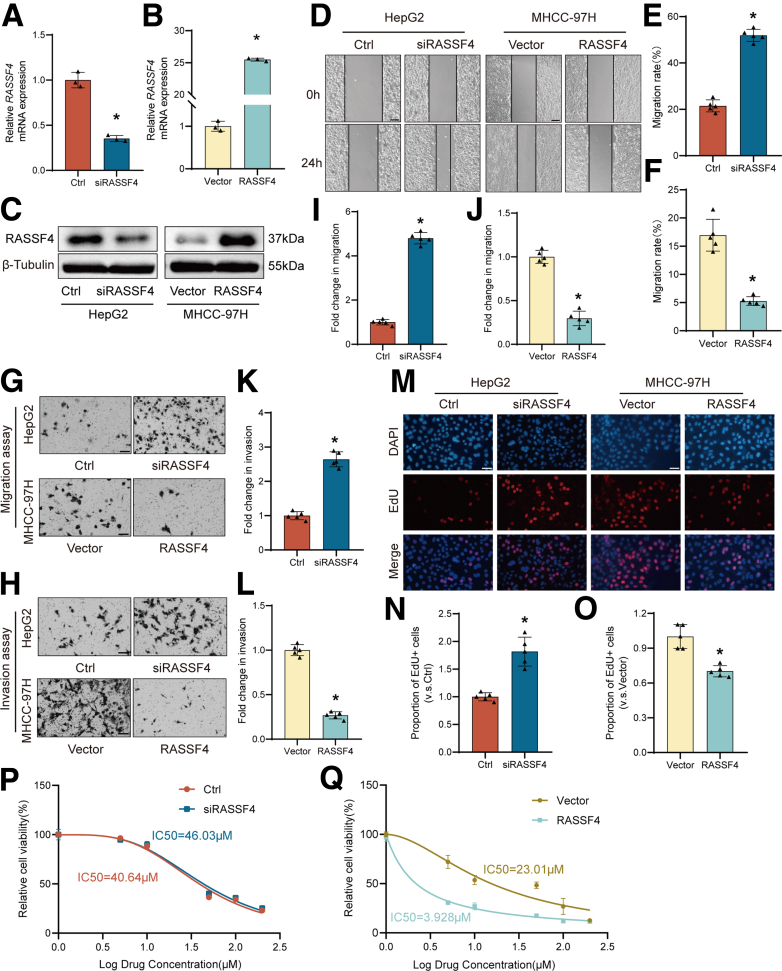
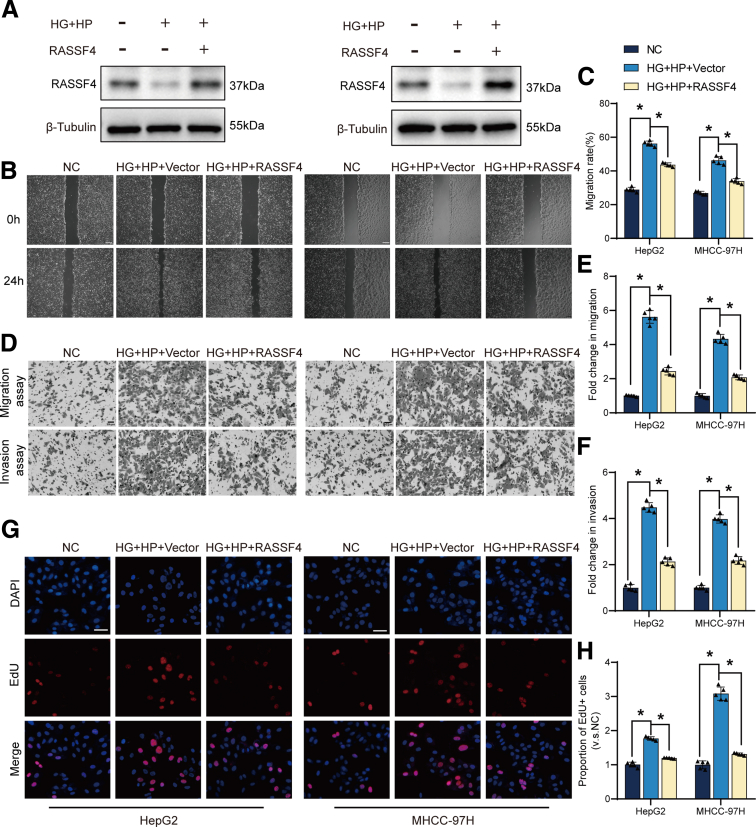
Methods: In this study, we performed transcriptome analysis in livers from mice with MASLD and found suppression of a potential anti-oncogene, RAS association domain protein 4 (RASSF4). RASSF4 expression levels were measured in liver or tumor tissues of patients with MASH or HCC, respectively. We established RASSF4 overexpression and knockout mouse models. The effects of RASSF4 were evaluated by quantitative polymerase chain reaction, Western blotting, histopathological analysis, wound healing assays, Transwell assays, EdU incorporation assays, colony formation assays, sorafenib sensitivity assays, and tumorigenesis assays.

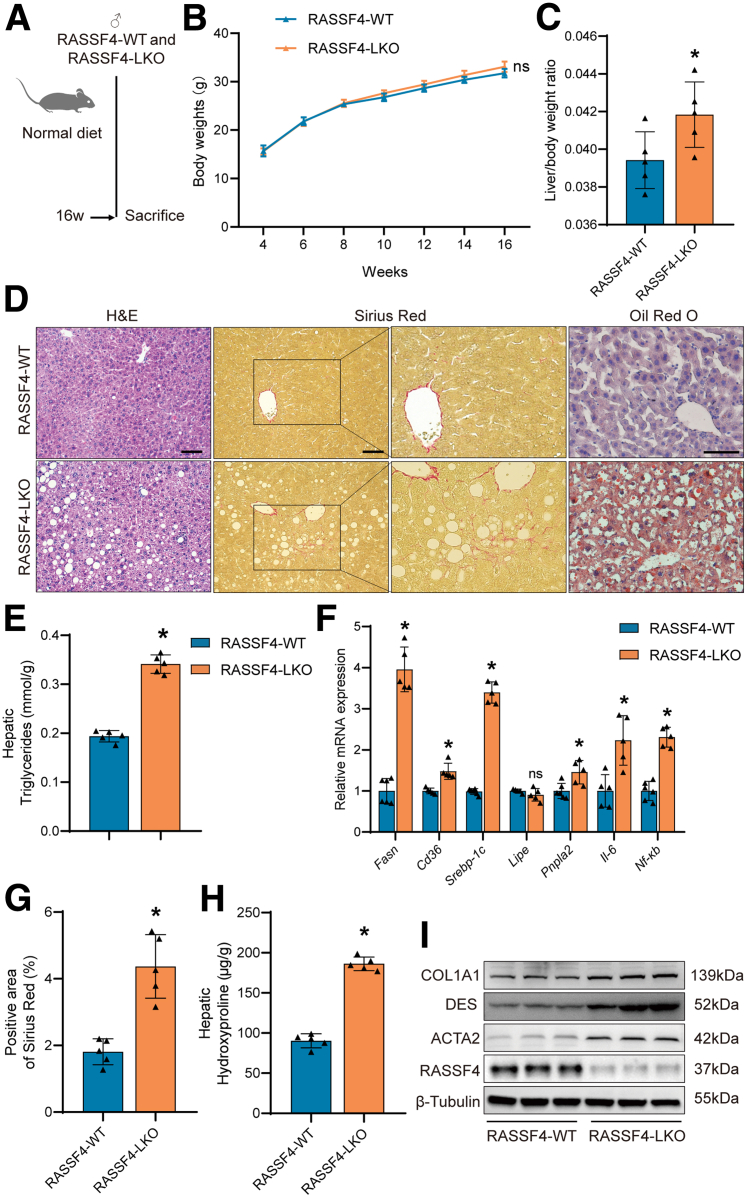
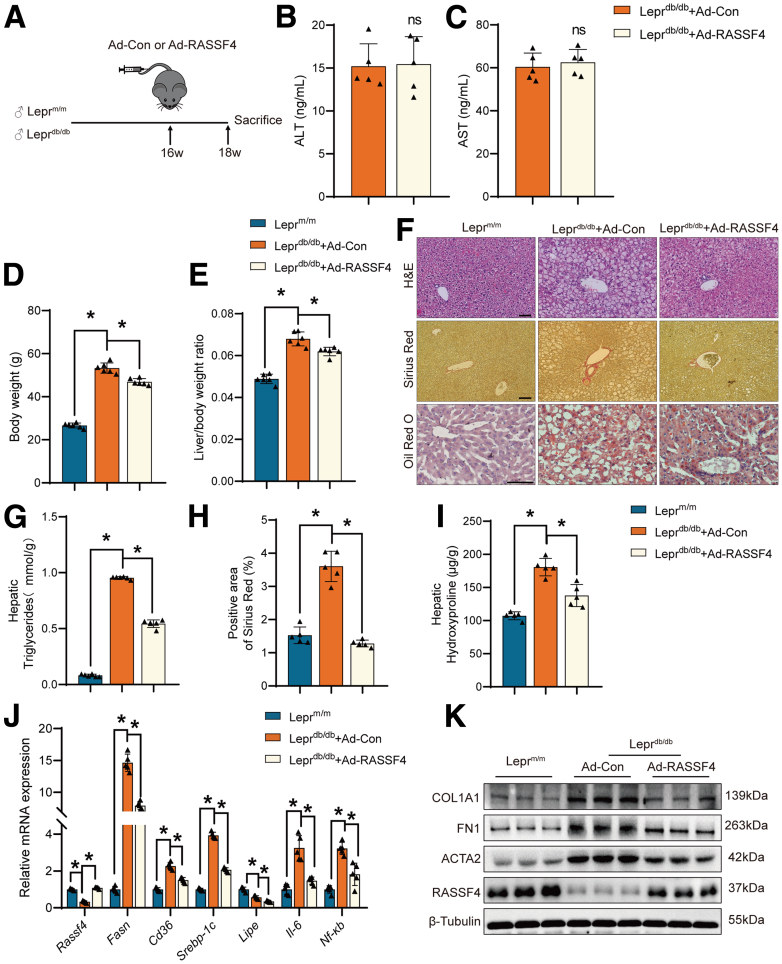
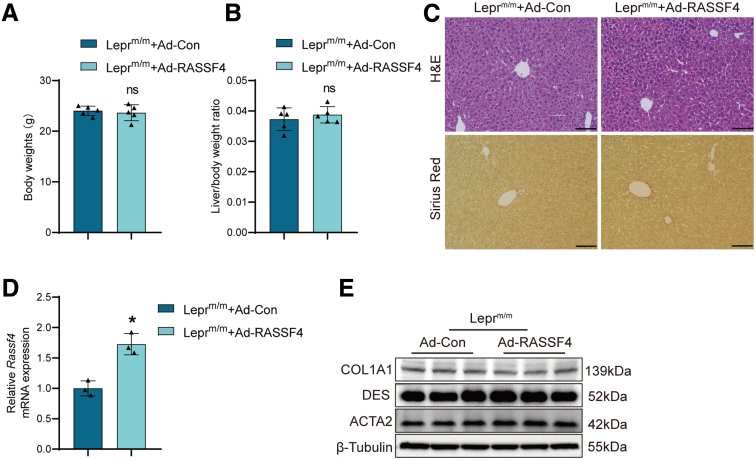
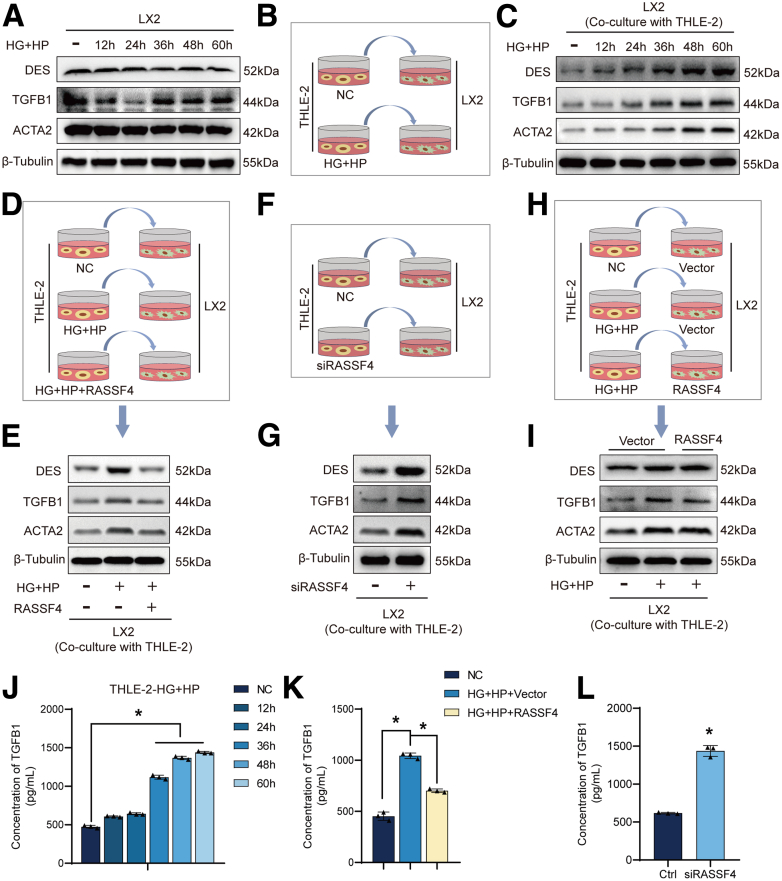
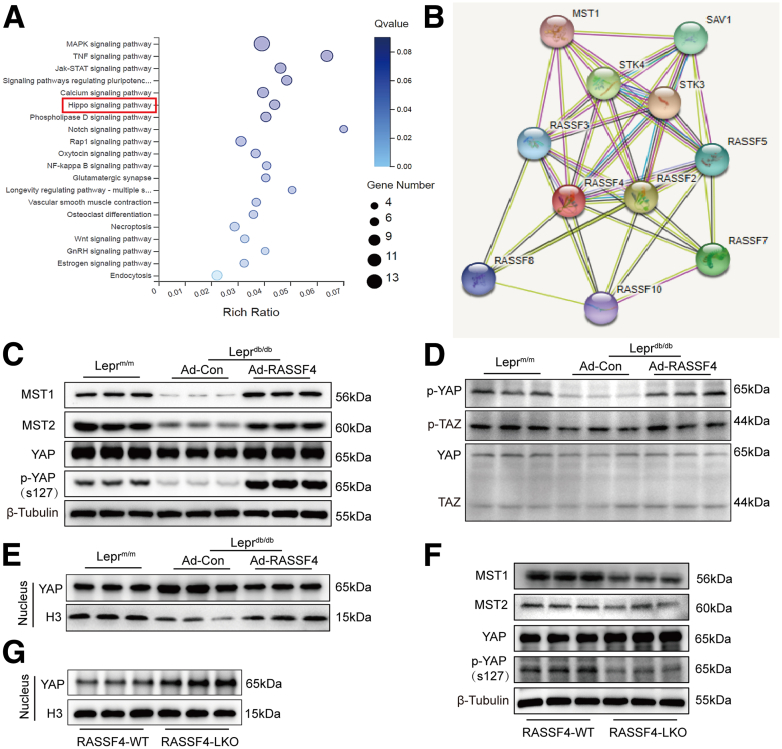
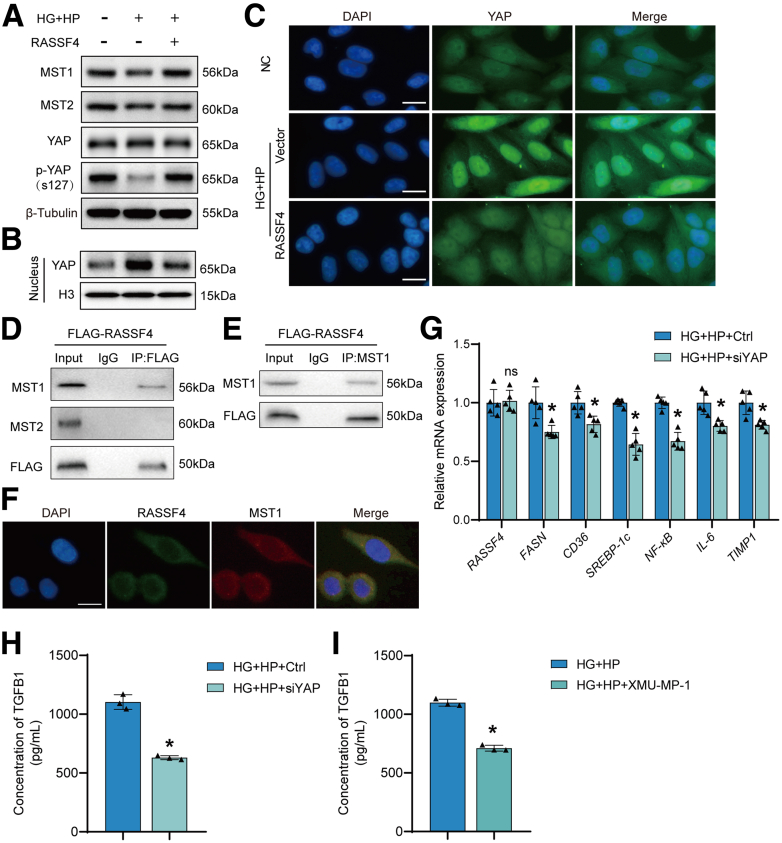
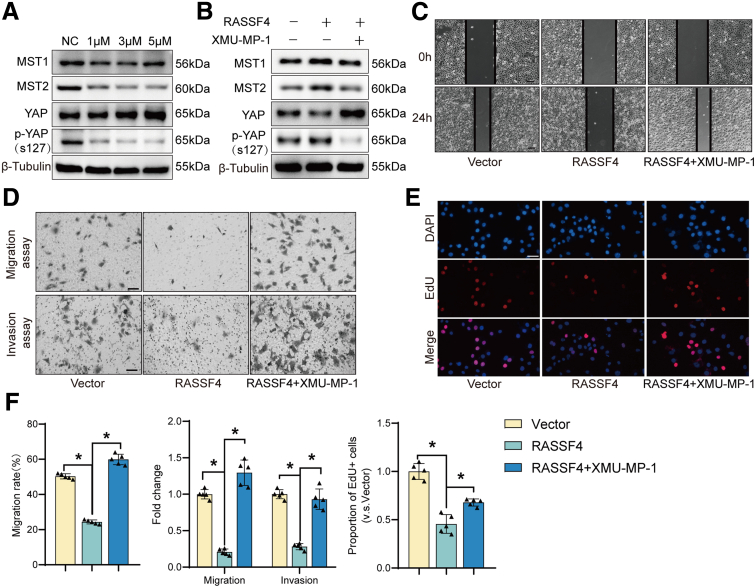
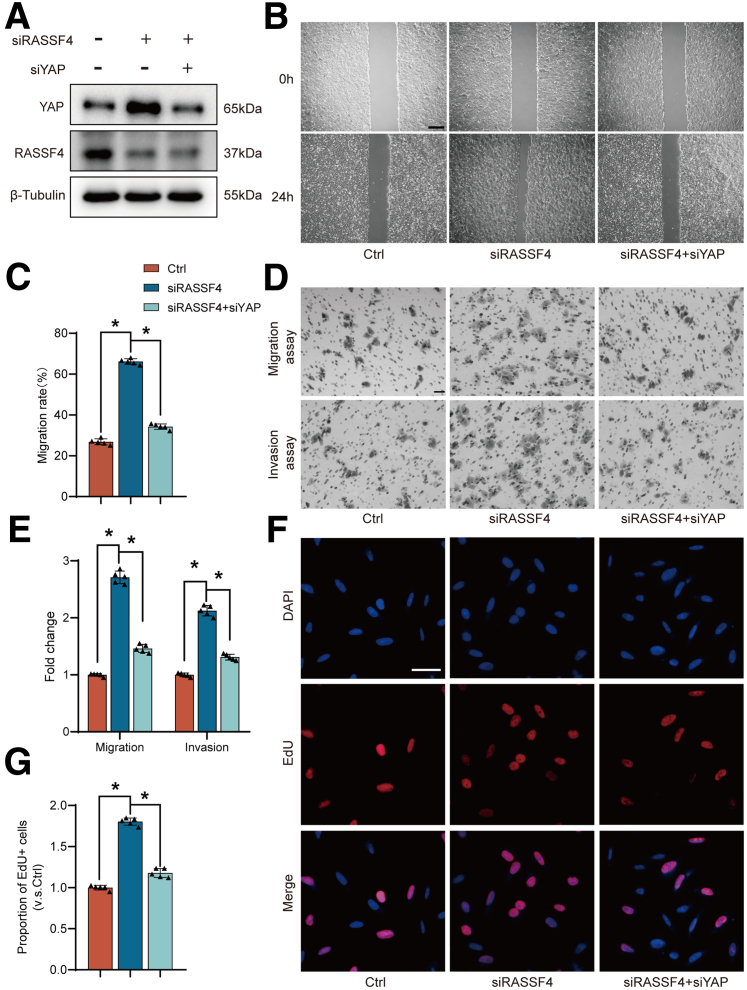
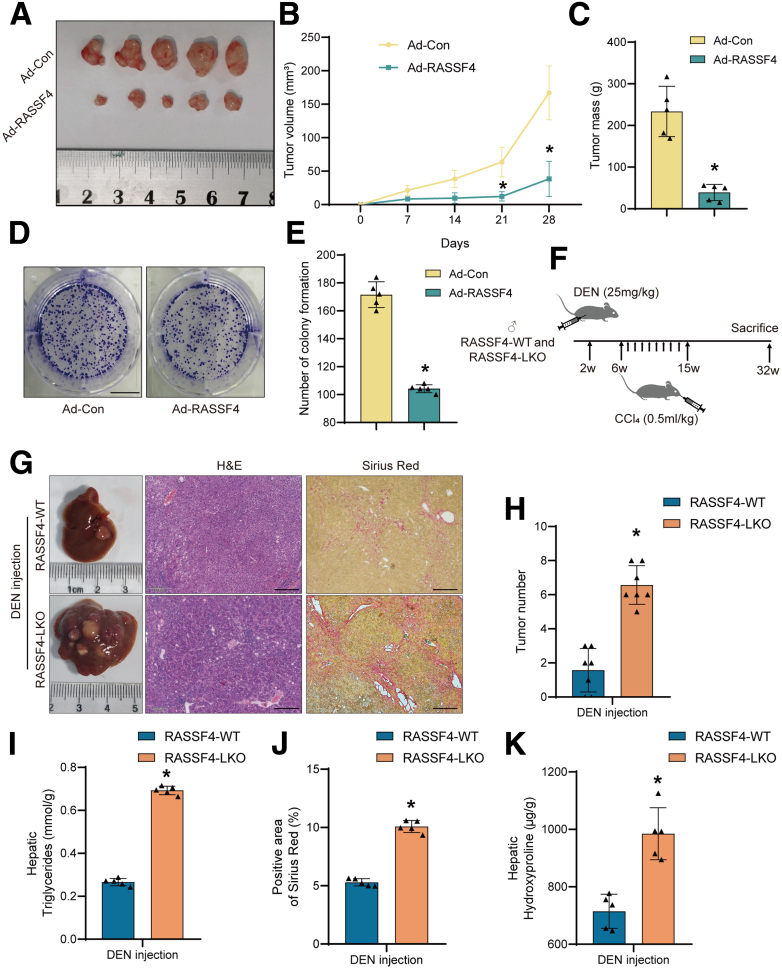
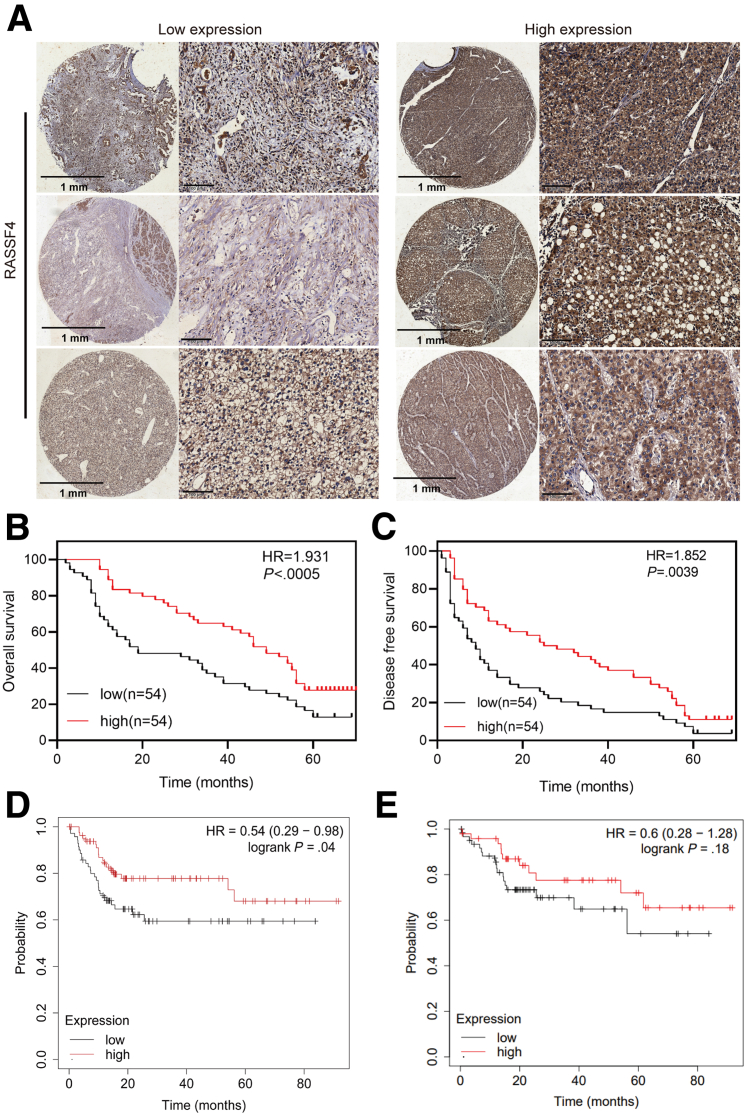
Results: RASSF4 was significantly down-regulated in MASH and HCC samples. Using liver-specific RASSF4 knockout mice, we demonstrated that loss of hepatic RASSF4 exacerbated hepatic steatosis and fibrosis. In contrast, RASSF4 overexpression prevented steatosis in MASLD mice. In addition, RASSF4 in hepatocytes suppressed the activation of hepatic stellate cells (HSCs) by reducing transforming growth factor beta secretion. Moreover, we found that RASSF4 is an independent prognostic factor for HCC. Mechanistically, we found that RASSF4 in the liver interacts with MST1 to inhibit YAP nuclear translocation through the Hippo pathway.

Conclusions: These findings establish RASSF4 as a therapeutic target for MASLD and HCC.

Keywords: HCC; Hepatic Stellate Cells; Hippo Pathway; MASLD; RASSF4.


Figures

None
Graphical abstract
Figure 1
Figure 1
Leprdb/dbmice developed metabolic dysfunction-associated steatotic liver disease. (A) Representative images of whole livers and liver sections stained with H&E and Oil Red O from Leprm/m and Leprdb/db mice (n = 5 mice/group). Scale bar = 100 μm. (B) qPCR analysis of Fasn and Srebp-1c in the livers of Leprm/m and Leprdb/db mice (n = 5 mice/group). (C) Representative images of immunofluorescence staining of ACTA2 in liver samples (n = 5 mice/group). Scale bar = 100 μm. (D) Western blot of RASSF4 protein expression in liver sections (n = 5 mice/group). (E) Heatmap of differentially expressed genes in Leprm/m and Leprdb/db livers. (F) Disease-related analysis of IPA from RNA-seq. ∗P < .05.
Figure 2
Figure 2
RASSF4 was down-regulated in livers of Leprdb/dbmice and HCC samples. (A) Venn diagram of the RNA-seq and GEO data sets. The DEN reagent was diluted in saline. The control group had no intervention. The comparison between the control and saline groups was performed mainly to exclude the effect of vehicle on the mice. (B) Heatmap of 8 common differentially expressed genes. (C–H) qPCR and Western blot analysis of RASSF4 in livers of mice (n = 5 mice/group). HCC was induced by DEN plus CCl4 or DEN plus CCl4 and HFD and explained in Methods. (I) Representative images of IHC staining of RASSF4 in paracancer and HCC samples. Scale bar = 100 μm. (J and K) qPCR and Western blots showing RASSF4 expression in livers of paracancer and HCC samples (n = 5 samples/group). (L and M) qPCR and Western blots showing RASSF4 expression in THLE-2 and HCC cell lines (n = 3 samples/group). (N and O) qPCR and Western blot analysis of RASSF4 in livers of Normal and MASH samples (n = 4 samples/group). ∗P < .05. For L and M, n = 3 independent studies per group and performed with 3 technical replicates.
Figure 3
Figure 3
Representative images of immunohistochemistry staining of RASSF4 in paracancer and cancer samples from HCC patients with fatty liver. Scale bar = 100 μm.
Figure 4
Figure 4
Loss of RASSF4 exacerbates hepatic fibrosis, lipid metabolism, and inflammation in mice. (A) Schematic of RASSF4 knockout mouse model. (B and C) Body weight and liver/body weight ratio of RASSF4-WT and RASSF4-LKO mice. (D) Representative images of liver H&E, Sirius red, and Oil Red O staining. Scale bar = 100 μm. (E) Quantification of liver triglycerides. (F) Quantification of the liver fibrosis area. (G) Quantification of liver hydroxyproline. (H) qPCR analysis of genes involved in lipid metabolism and inflammation in the livers of mice. (I) Western blot analysis of fibrosis-related genes. (n =5 mice/group). ∗P < .05.
Figure 5
Figure 5
RASSF4 attenuates hepatic fibrosis, lipid synthesis, and inflammation in mice. (A) Schematic of the RASSF4 overexpression mouse model. (B and C) The levels of serum alanine aminotransferase (ALT) and aspartate aminotransferase (AST) in mice with adenovirus injection. (D and E) Body weight and liver/body weight ratio of mice. (F) Representative images of liver H&E, Sirius red, and Oil Red O staining. Scale bar = 100 μm. (G) Quantification of liver triglycerides. (H) Quantification of the liver fibrosis area. (I) Quantification of liver hydroxyproline. (J) qPCR analysis of genes involved in lipid metabolism and inflammation in the livers of mice. (K) Western blot analysis of fibrosis-related genes. (n =5 mice/group). ∗P < .05.
Figure 6
Figure 6
RASSF4 overexpression in Leprm/mmice does not produce significant changes. (A and B) Body weight and liver/body weight ratio of Leprm/m+Ad-Con and Leprm/m+Ad-RASSF4 mice (n = 5 mice/group). Scale bar = 100 μm. (C) Representative images of liver H&E and Sirius red staining. (n = 5 mice/group). (D) qPCR analysis of RASSF4 in the livers of mice. (n =5 mice/group). (E) Western blot analysis of fibrosis-related genes (n =5 mice/group). ∗P < .05.
Figure 7
Figure 7
RASSF4 inhibits lipid synthesis and inflammation in hepatocytes. (A and B) qPCR and Western blots showing RASSF4 expression in THLE-2 cells treated with HG plus HP. (C–F) Representative images and quantitative analysis of Oil Red O staining of THLE-2 cells. Scale bar = 50 μm. (G) qPCR analysis of lipid synthesis and inflammation in THLE-2 cells. ∗P < .05. The THLE-2 cells were treated with HG (25 mmol/L) plus HP (0.25 mmol/L) for 24 hours. For A–G, n = 3 independent studies per group. All experiments were performed with 3 technical replicates.
Figure 8
Figure 8
RASSF4 in hepatocytes reduces hepatic stellate cell activation. (A) Western blot analysis of LX2 cells treated with HG plus HP. (B–I) Experimental schema (B, D, F, and H) and Western blot analysis of LX2 cells cocultured with THLE-2 cells treated with HG plus HP. (J–L) ELISA of TGF-β levels in the supernatant of THLE-2 cells. ∗P < .05. The THLE-2 cells were treated with HG (25 mmol/L) plus HP (0.25 mmol/L) for 24 hours. For A–L, n = 3 independent studies per group. All experiments were performed with 3 technical replicates.
Figure 9
Figure 9
RASSF4 inhibits YAP nuclear translocation in mice. (A) KEGG pathway enrichment of RNA-seq. (B) STRING data analysis of RASSF4-interacting proteins. (C and F) Protein expression of MST1, MST2, YAP, and p-YAP (n = 5 mice/group). (D) Protein expression of YAP, p-YAP, TAZ, and p-TAZ (n = 5 mice/group). (E and G) Western blot analysis of YAP expression in the nucleus (n = 5 mice/group).
Figure 10
Figure 10
RASSF4 inhibits YAP nuclear translocation in THLE-2 cells through the Hippo pathway. (A) Protein expression of MST1, MST2, YAP, and p-YAP in THLE-2 cells. (B) Western blot analysis of YAP expression in the nucleus. (C) Representative images of immunofluorescence staining of YAP in THLE-2 cells. Scale bar = 20 μm. (D) Co-immunoprecipitation with anti-Flag agarose beads in THLE-2 cells transfected with Flag-RASSF4. (E) Co-immunoprecipitation with anti-MST1 agarose beads in THLE-2 cells transfected with Flag-RASSF4. (F) Representative images of immunofluorescence staining of RASSF4 and MST1 in THLE-2 cells. Scale bar = 20 μm. (G) qPCR analysis of lipid synthesis and inflammation in THLE-2 cells. (H and I) ELISA of TGFβ levels in the supernatant of THLE-2 cells. ∗P < .05. The THLE-2 cells were treated with HG (25 mmol/L) plus HP (0.25 mmol/L) for 24 hours. For A–I, n = 3 independent studies per group and performed with 3 technical replicates.
Figure 11
Figure 11
HG and HP promote migration, invasion, and proliferation in HCC cells. (A and B) Wound healing assays using HepG2 or MHCC-97H cells treated with HG or HP. Scale bar = 200 μm. (C–E) Representative images of Transwell chamber and Matrigel invasion assays using HepG2 or MHCC-97H cells treated with HG or HP. Scale bar = 50 μm. (F and G) Representative images of Click-iT EdU assays using HepG2 or MHCC-97H cells treated with HG or HP. (H and I) qPCR and Western blot analysis of RASSF4 in HepG2 and MHCC-97H cells. Scale bar = 50 μm. ∗P < .05. The cells were treated with HG (25 mmol/L) or HP (0.25 mmol/L) for 24 hours. For A–I, n = 3 independent studies per group. All experiments were performed with 3 technical replicates.
Figure 12
Figure 12
RASSF4 inhibits cell migration, invasion, proliferation, and chemotherapy resistance in HCC cells. (A–C) qPCR and Western blot analysis of RASSF4 in HepG2 and MHCC-97H cells. (D–F) Wound healing assays using RASSF4-knockdown or RASSF4-overexpressing cells and their corresponding control cells. Scale bar = 200 μm. (G–L) Representative images of Transwell chamber and Matrigel invasion assays using RASSF4-knockdown or RASSF4-overexpressing cells and their corresponding control cells. Scale bar = 50 μm. (M–O) Representative images of Click-iT EdU assays using RASSF4-knockdown or RASSF4-overexpressing cells and their corresponding control cells. Scale bar = 50 μm. (P and Q) Cell viability assays using RASSF4-knockdown or RASSF4-overexpressing cells and their corresponding control cells under sorafenib treatment. ∗P < .05. For A–Q, n =3 independent studies per group and performed with 3 technical replicates.
Figure 13
Figure 13
RASSF4 ameliorates cell migration, invasion, and proliferation in different HCC cells. (A) Western blot analysis of RASSF4 expression in HepG2 and MHCC-97H cells. (B and C) Representative images and quantification of wound healing assays. Scale bar = 200 μm. (D–F) Representative images and quantification of Transwell chamber and Matrigel invasion assays. Scale bar = 50 μm. (G and H) Representative images and quantification of Click-iT EdU assays. Scale bar = 50 μm. ∗P < .05. The cells were treated with HG (25 mmol/L) plus HP (0.25 mmol/L) for 24 hours. For A–H, n = 3 independent studies per group. All experiments were performed with 3 technical replicates.
Figure 14
Figure 14
Hippo signaling is required for RASSF4 to function in HCC cells. (A and B) Western blot analysis of MST1, MST2, YAP, and p-YAP expression in HepG2 cells treated with XMU-MP-1. (C–E) Representative images of wound healing assays, Transwell chamber and Matrigel invasion assays, and Click-iT EdU assays using HepG2 cells overexpressing RASSF4 or treated with XMU-MP-1. Scale bar = 50 μm. (F) Quantification of C–E. For A–F, n = 3 independent studies per group. All experiments were performed with 3 technical replicates.
Figure 15
Figure 15
YAP is required for RASSF4 to function in HCC cells. (A) Western blot analysis of RASSF4 and YAP expression in HepG2 cells. (B and C) Representative images and quantification of wound healing assays. Scale bar = 200 μm. (D and E) Representative images and quantification of Transwell chamber and Matrigel invasion assays. Scale bar = 50 μm. (F and G) Representative images and quantification of Click-iT EdU assays. Scale bar = 50 μm. ∗P < .05. For A–G, n = 3 independent studies per group. All experiments were performed with 3 technical replicates.
Figure 16
Figure 16
RASSF4 inhibits the growth of HCC. (A) Representative images of the xenograft tumors from the RASSF4-overexpressing and control groups (n = 5 mice/group). (B) Tumor volumes were measured and presented (n = 5 mice/group). (C) The final tumor weights of the RASSF4-overexpressing and control groups (n = 5 samples/group). (D and E) Representative images and quantification of colony formation in RASSF4-overexpressing and control cells. Scale bar = 1 cm. (F) Schematic of the RASSF4 overexpression mouse model. (G) Representative images of whole livers and liver sections stained with H&E and Sirius red from DEN-induced HCC mice (n = 5 mice/group). Scale bar = 100 μm. (H) Tumor number of DEN-induced HCC mice (n = 5 mice/group). (I) Quantification of liver triglycerides. (J) Quantification of the liver fibrosis area. (K) Quantification of liver hydroxyproline. ∗P < .05. For D and E, n = 3 independent studies per group and performed with 3 technical replicates.
Figure 17
Figure 17
Loss of RASSF4 is associated with poor prognosis of HCC patients. (A) Representative immunohistochemistry staining intensity of RASSF4 expression in HCC samples (n = 54 samples/group). Scale bar = 100 μm. (B and C) Kaplan–Meier analyses of the overall survival (OS) and disease-free survival (DFS) of 108 patients with HCC (n = 54 samples/group). (D and E) Kaplan–Meier analyses of OS in HCC patients (D) or hepatitis B virus–positive HCC patients (E) from The Cancer Genome Atlas clinical data.
Figure 18
Figure 18
Knockout of RASSF4 does not affect the expression of TEAD family in liver. (A) qPCR analysis of TEAD family in the livers of HCC mice (n = 5 mice/group). (B) qPCR analysis of TEAD family in the livers of RASSF4 knockout mice (n = 5 mice/group). (C) qPCR analysis of TEAD family in the livers of RASSF4 knockout HCC mice (n = 5 mice/group). HCC was induced by DEN plus CCl4. ∗P < .05.

Similar articles

Cited by

References

    1. Li J., Zou B., Yeo Y.H., Feng Y., et al. Prevalence, incidence, and outcome of non-alcoholic fatty liver disease in Asia, 1999-2019: a systematic review and meta-analysis. Lancet Gastroenterol Hepatol. 2019;4:389–398. - PubMed
    1. Zhou F., Zhou J., Wang W., et al. Unexpected rapid increase in the burden of NAFLD in China from 2008 to 2018: a systematic review and meta-analysis. Hepatology. 2019;70:1119–1133. - PubMed
    1. Huang D.Q., El-Serag H.B., Loomba R. Global epidemiology of NAFLD-related HCC: trends, predictions, risk factors and prevention. Nat Rev Gastroenterol Hepatol. 2021;18:223–238. - PMC - PubMed
    1. Ioannou G.N. Epidemiology and risk-stratification of NAFLD-associated HCC. J Hepatol. 2021;75:1476–1484. - PubMed
    1. El-Serag H.B., Rudolph K.L. Hepatocellular carcinoma: epidemiology and molecular carcinogenesis. Gastroenterology. 2007;132:2557–2576. - PubMed

MeSH terms

Substances