. 2024 May 2;7(7):e202302474.
doi: 10.26508/lsa.202302474. Print 2024 Jul.

VDR restores the expression of PINK1 and BNIP3 in TECs of streptozotocin-induced diabetic mice

Affiliations

VDR restores the expression of PINK1 and BNIP3 in TECs of streptozotocin-induced diabetic mice

Cheng Yang et al. Life Sci Alliance. .

Abstract

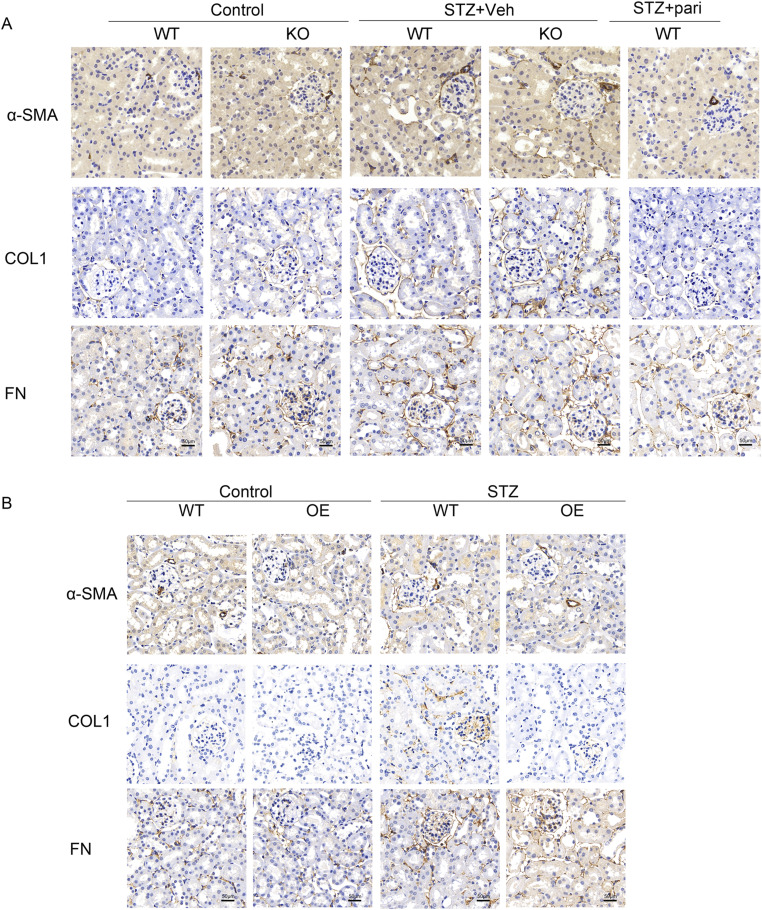
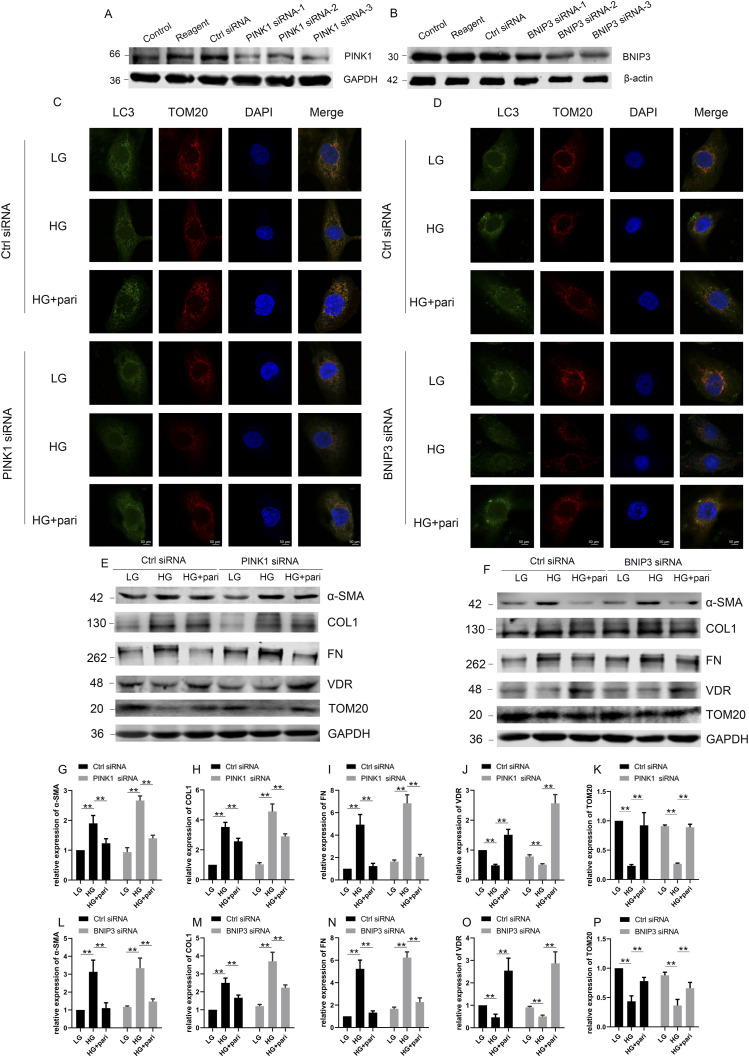
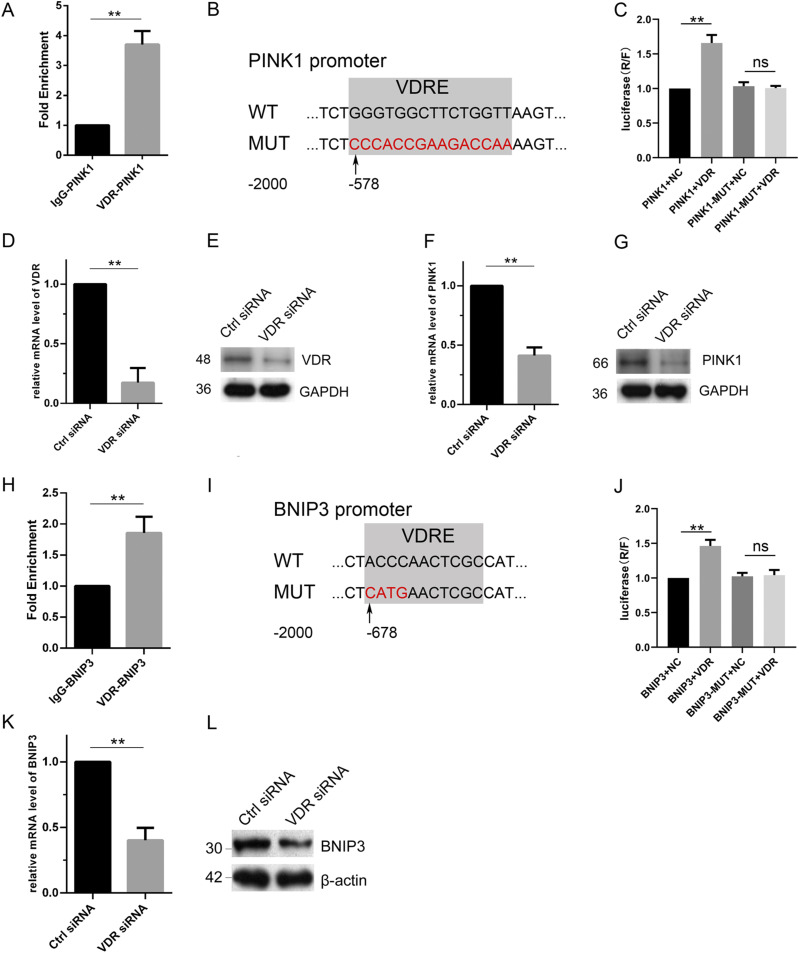
Defective mitophagy in renal tubular epithelial cells is one of the main drivers of renal fibrosis in diabetic kidney disease. Our gene sequencing data showed the expression of PINK1 and BNIP3, two key molecules of mitophagy, was decreased in renal tissues of VDR-knockout mice. Herein, streptozotocin (STZ) was used to induce renal interstitial fibrosis in mice. VDR deficiency exacerbated STZ-induced renal impairment and defective mitophagy. Paricalcitol (pari, a VDR agonist) and the tubular epithelial cell-specific overexpression of VDR restored the expression of PINK1 and BNIP3 in the renal cortex and attenuated STZ-induced kidney fibrosis and mitochondrial dysfunction. In HK-2 cells under high glucose conditions, an increased level of α-SMA, COL1, and FN and a decreased expression of PINK1 and BNIP3 with severe mitochondrial damage were observed, and these alterations could be largely reversed by pari treatment. ChIP-qPCR and luciferase reporter assays showed VDR could positively regulate the transcription of Pink1 and Bnip3 genes. These findings reveal that VDR could restore mitophagy defects and attenuate STZ-induced fibrosis in diabetic mice through regulation of PINK1 and BNIP3.


Conflict of interest statement

The authors declare that they have no conflict of interest.

Figures

None
Graphical abstract
Figure 1.
Figure 1.. VDR loss leads to down-regulation of BNIP3 and PINK1 in C57 mice.
(A) Down-regulated mRNA expression of Bnip3 and Pink1 from the whole RNA-sequencing and analysis. (B, C) mRNA levels of PINK1 (B) and BNIP3(C) in the cortex of WT and KO mice. (D) Representative blots of VDR, PINK1, and BNIP3 in the cortex of WT and KO mice. GAPDH was used as a loading control. (E, F) Densitometric analysis of PINK1 and BNIP3 between the WT and KO group. The data in (A, B, C, E, F) are presented as the mean ± SD. A two-tailed unpaired t test was used. P < 0.05 was considered to be statistically significant. **P < 0.01. n ≥ 5. Source data are available for this figure.
Figure 2.
Figure 2.. VDR deficiency reinforces kidney fibrosis in STZ-induced diabetic mice.
(A) Changes in body weight after STZ injections every 4 wk. (B) Blood glucose fluctuation was measured every 4 wk within 16 wk after STZ injections. The data in (A, B) are presented as the mean ± SD, *P < 0.05, **P < 0.01 compared with the WT-control group, #P < 0.05, ##P < 0.01 compared with the KO-control group, and ▲▲P < 0.01 compared with the WT-STZ group. (C) Serum creatinine levels at 16 wk after STZ injections. (D) Urinary ACR values at 16 wk after STZ injections. (E) Representative images of PAS staining. (F) Representative images of the Masson staining at 16 wk after STZ injections. Scale bar = 50 μm. (G, H, I, J) Representative blots and densitometric analysis of fibrosis markers (α-SMA, COL1, and FN) in the kidney of the indicated groups at 16 wk after STZ injections or vehicle. GAPDH was set as a loading control. The bands of proteins were measured with ImageJ software. n = 5 mice. The data are presented as the mean ± SD, *P < 0.05, **P < 0.01. Source data are available for this figure.
Figure S1.
Figure S1.. Loss of VDR exacerbates renal fibrosis in STZ mice, and the VDR agonist or VDR overexpression could alleviate renal fibrosis.
(A, B) Representative images of IHC staining of α-SMA, COL1, and FN in the kidney at 16 wk after STZ injections. Scale bar = 50 μm.
Figure 3.
Figure 3.. Loss of VDR aggravates mitophagy defects in STZ mice.
(A) Representative images of TEM (left) showing the structure of mitochondria in TECs of mice among five groups at 12 wk after STZ injections and quantification of broken mitochondria (right). Black arrows indicate the autophagosomes, which wrap the damaged mitochondria. Scale bars = 2 μm. (B) Representative blots of LC3, SQSTM1, PINK1, Parkin, BNIP3, TOM20, VDAC1, and VDR. GAPDH was set as a loading control. (C, D, E, F, G, H, I, J) Densitometric analysis of LC3, SQSTM1, PINK1, Parkin, BNIP3, TOM20, VDAC1, and VDR in the indicated groups. Values are the mean ± SEM, *P < 0.05, **P < 0.01 (two-way ANOVA and one-way ANOVA). (K) Representative images of IHC staining in the renal cortex of the indicated groups at 12 wk after STZ injections. Scale bar = 50 μm. n = 5. Source data are available for this figure.
Figure S2.
Figure S2.. VDR deficiency aggravated the decrease of TOM20 expression in STZ mice, and TOM20 expression could be restored in VDR-OE STZ mice or by pari treatment.
(A, B) Representative images of TOM20 by immunofluorescence staining in the indicated groups of mice raised for 12 wk after STZ injection. Scale bar = 50 μm.
Figure 4.
Figure 4.. VDR overexpression in TECs reduces renal fibrosis in diabetic mice.
(A) Body weight changes in WT, OE, and mice that received STZ treatment (WT-STZ, OE-STZ) within 16 wk. (B) Blood glucose levels in the indicated groups within 16 wk after STZ injections. Values are the mean ± SD. *P < 0.05, **P < 0.01 compared with the WT-control group and ##P < 0.01 compared with the OE-control group. (C) Serum creatinine values were assessed at 16 wk after STZ injections. (D) Urinary ACR values were tested at 16 wk after STZ injections. (E, F) Representative images of the PAS staining (E) and the Masson staining (F) at 16 wk after STZ injections. Scale bar = 50 μm. (G, H, I, J) Western blot analysis of α-SMA, COL1, and FN expression in the kidney of the indicated mice. Values are the mean ± SD. *P < 0.05, **P < 0.01. n = 5. Source data are available for this figure.
Figure 5.
Figure 5.. Overexpression of VDR in TECs attenuated the abnormality of mitophagy in diabetes.
(A) Representative TEM images (left) of mitochondrial structures in TECs of WT-control, OE-control, WT-STZ, and OE-STZ mice at 12 wk after STZ injections and quantification of broken mitochondria (right). Scale bar = 2 μm. (B, C, D, E, F, G, H, I, J) Western blotting (B) and densitometric quantifications (C, D, E, F, G, H, I, J) of LC3, SQSTM1, PINK1, Parkin, BNIP3, TOM20, VDAC1, and VDR at 12 wk after STZ injections in the indicated groups. GAPDH was set as a loading control. The data are displayed as the mean ± SD, *P < 0.05, **P < 0.01. (K) Representative images of IHC staining of PINK1 and BNIP3 in the kidney at 12 wk after STZ injections. Scale bar = 50 μm. n = 5. Source data are available for this figure.
Figure 6.
Figure 6.. VD restored fibrosis and mitophagy induced by high glucose in HK-2 cells.
(A) Representative TEM images of the indicated groups (left) and quantification of broken mitochondria (right). Scale bar = 1 μm. (B) HK-2 cells were collected for immunofluorescence of LC3 (autophagosomes, green) and TOM20 (mitochondria, red). Representative fluorescent images were captured by a confocal microscope. Scale bar = 50 μm. (C) Representative blots of α-SMA, COL1, FN, PINK1, and BNIP3 in HK-2 cells cultured with LG or HG medium. Meanwhile, the HG groups were added with pari (100 nM) for 48 h or not. GAPDH and β-actin were set as loading controls. (D, E, F) Densitometric quantifications of α-SMA, COL1, and FN. The data are presented as the mean ± SD from three independent experiments. **P < 0.01. (G, H) Densitometric quantifications of PINK1 and BNIP3 in HK-2 cells treated with pari or not. The data are expressed as the mean ± SD, *P < 0.05, **P < 0.01. All the experiments above were repeated at least three times. Source data are available for this figure.
Figure 7.
Figure 7.. Effect of pari on mitophagy and fibrosis was largely mediated by PINK1 and BNIP3 in HG-treated HK-2 cells.
(A) Western blot analysis for PINK1 expression in HK-2 with GAPDH as a loading control. HK-2 cells were transfected with transfection reagent, control siRNA, or three PINK1 siRNAs for 48 h. (B) Western blot analysis of BNIP3 expression in HK-2 with β-actin as a loading control. HK-2 cells were transfected with transfection reagent, control siRNA, or three BNIP3 siRNAs for 48 h. (C) HK-2 cells were divided into six groups: Ctrl siRNA+LG, Ctrl siRNA+HG, Ctrl siRNA+HG+pari (100 nM, 48 h), PINK1 siRNA+LG, PINK1 siRNA+HG, and PINK1 siRNA+HG+pari. HK-2 cells cultured in LG or HG medium were transfected with control or PINK1 siRNA for 48 h and subsequently collected for immunofluorescence of LC3 and TOM20. Representative images from three independent experiments were captured via confocal microscopy. Scale bar = 50 μm. (D) Cultured HK-2 cells were divided into six groups: Ctrl siRNA+LG, Ctrl siRNA+HG, Ctrl siRNA+HG+pari, BNIP3 siRNA+LG, BNIP3 siRNA+HG, and BNIP3 siRNA+HG+pari. Representative images from three independent experiments are shown. Scale bar = 50 μm. (E, F) Representative blots of α-SMA, COL1, FN, VDR, and TOM20 in HK-2 cells treated with the same as in C (E) or D (F). GAPDH was set as a loading control. (E, F, G, H, I, J, K, L, M, N, O, P) Densitometric quantifications of α-SMA, COL1, FN, VDR, and TOM20 in (E, F). The data are presented as the mean ± SD from three independent experiments. **P < 0.01. Ctrl = control. Source data are available for this figure.
Figure 8.
Figure 8.. Pari could not improve mitophagy and fibrosis in HK-2 cells with PINK1 and BNIP3 siRNA transfection.
Cultured HK-2 cells were divided into six groups: Ctrl siRNA+LG, Ctrl siRNA+HG, Ctrl siRNA+HG+pari, PINK1 and BNIP3 siRNA+LG, PINK1 and BNIP3 siRNA+HG, and PINK1 and BNIP3 siRNA+HG+pari. (A) Representative fluorescent images for LC3 and TOM20 captured from three independent experiments. Scale bar = 50 μm. (B) Representative blots of α-SMA, COL1, FN, VDR, and TOM20 in HK-2 cells. GAPDH was set as a loading control. (B, C, D, E, F, G) Densitometric quantifications of α-SMA, COL1, FN, VDR, and TOM20 in (B). The data are presented as the mean ± SD from three independent experiments. **P < 0.01. Ctrl = control. Source data are available for this figure.
Figure 9.
Figure 9.. VDR could transcriptionally regulate the expression of PINK1 and BNIP3.
(A, H) ChIP-qPCR analysis between VDR and Pink1 gene or Bnip3 gene in mouse renal tubular epithelial cells. (B, I) Sequences of the WT and mutated VDRE in the luciferase reporter gene vectors. (C, J) Luciferase reporter assay between VDR and Pink1 gene or Bnip3 gene in HEK-293T cells. (D, E) Relative mRNA level (D) and representative blot of VDR (E) in HK-2 with VDR siRNA or control siRNA plasmid transfection for 48 h. (F, G) Relative mRNA level (F) and representative blot of PINK1 (G) in HK-2 with VDR siRNA or control siRNA plasmid transfection for 48 h. GAPDH was used as a loading control. (C, D, K, L) Relative mRNA level (C) and representative blot (D) of BNIP3 with the down-regulation of VDR. β-Actin was set as a loading control. The data are displayed as the mean ± SD; t test was used between the two groups. **P < 0.01. Ctrl = control. NC = negative control. ns, no significance. All the experiments were repeated at least three times.

Similar articles

Cited by

References

    1. Tönnies T, Rathmann W, Hoyer A, Brinks R, Kuss O (2021) Quantifying the underestimation of projected global diabetes prevalence by the international diabetes federation (IDF) diabetes atlas. BMJ Open Diabetes Res Care 9: e002122. 10.1136/bmjdrc-2021-002122 - DOI - PMC - PubMed
    1. Wu W, Huang XR, You Y, Xue L, Wang XJ, Meng X, Lin X, Shen J, Yu X, Lan HY, et al. (2021) Latent TGF-β1 protects against diabetic kidney disease via Arkadia/Smad7 signaling. Int J Biol Sci 17: 3583–3594. 10.7150/ijbs.61647 - DOI - PMC - PubMed
    1. Xue M, Cheng Y, Han F, Chang Y, Yang Y, Li X, Chen L, Lu Y, Sun B, Chen L (2018) Triptolide attenuates renal tubular epithelial-mesenchymal transition via the MiR-188-5p-mediated PI3K/AKT pathway in diabetic kidney disease. Int J Biol Sci 14: 1545–1557. 10.7150/ijbs.24032 - DOI - PMC - PubMed
    1. Puglisi S, Rossini A, Poli R, Dughera F, Pia A, Terzolo M, Reimondo G (2021) Effects of SGLT2 inhibitors and GLP-1 receptor agonists on renin-angiotensin-aldosterone system. Front Endocrinol (Lausanne) 12: 738848. 10.3389/fendo.2021.738848 - DOI - PMC - PubMed
    1. Liu XQ, Jiang L, Lei L, Nie ZY, Zhu W, Wang S, Zeng HX, Zhang SQ, Zhang Q, Yard B, et al. (2020) Carnosine alleviates diabetic nephropathy by targeting GNMT, a key enzyme mediating renal inflammation and fibrosis. Clin Sci (Lond) 134: 3175–3193. 10.1042/CS20201207 - DOI - PMC - PubMed

Publication types

MeSH terms