. 2024 May 2;15(1):3724.
doi: 10.1038/s41467-024-47621-w.

The environmental sustainability of digital content consumption

Affiliations

The environmental sustainability of digital content consumption

Robert Istrate et al. Nat Commun. .

Abstract

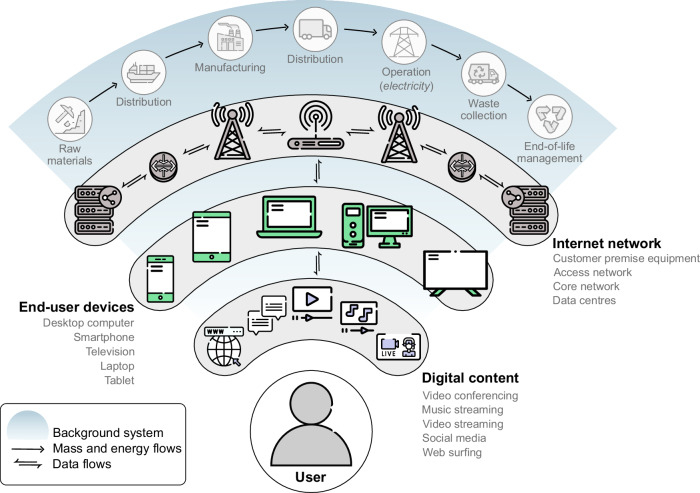
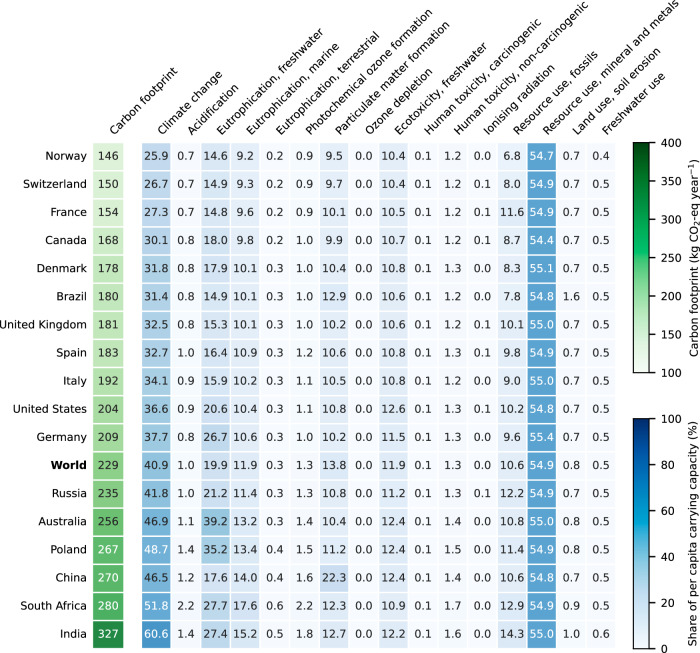
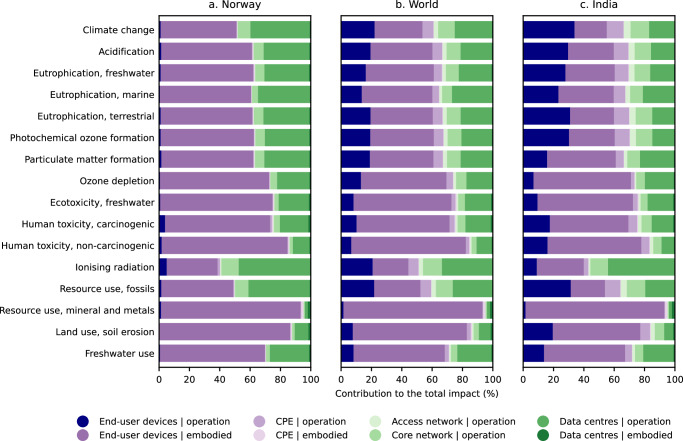
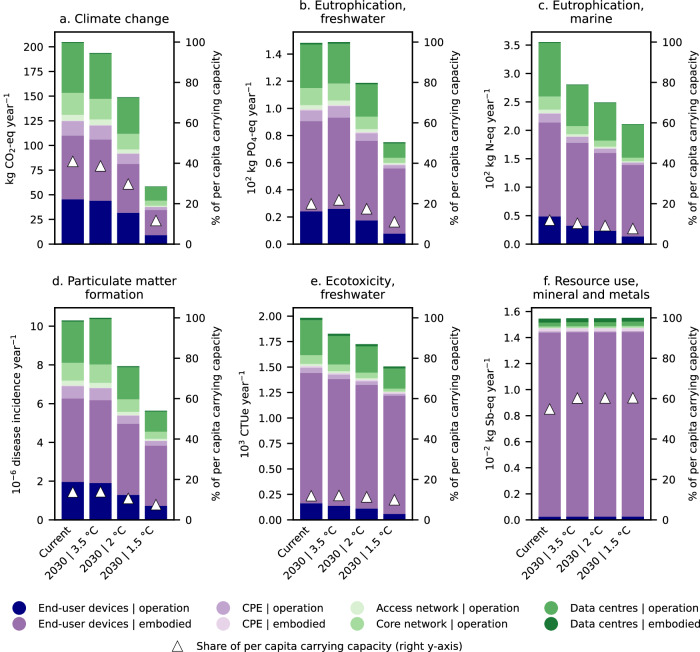
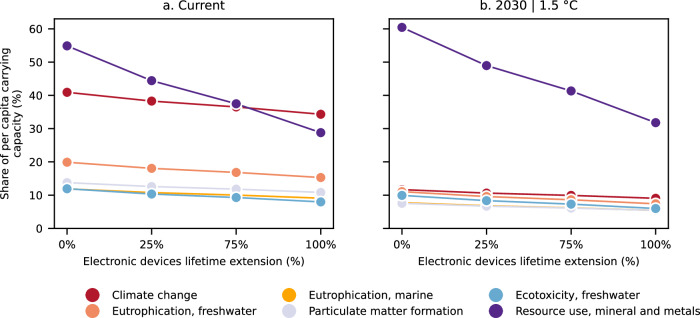
Internet access has reached 60% of the global population, with the average user spending over 40% of their waking life on the Internet, yet the environmental implications remain poorly understood. Here, we assess the environmental impacts of digital content consumption in relation to the Earth's carrying capacity, finding that currently the global average consumption of web surfing, social media, video and music streaming, and video conferencing could account for approximately 40% of the per capita carbon budget consistent with limiting global warming to 1.5 °C, as well as around 55% of the per capita carrying capacity for mineral and metal resources use and over 10% for five other impact categories. Decarbonising electricity would substantially mitigate the climate impacts linked to Internet consumption, while the use of mineral and metal resources would remain of concern. A synergistic combination of rapid decarbonisation and additional measures aimed at reducing the use of fresh raw materials in electronic devices (e.g., lifetime extension) is paramount to prevent the growing Internet demand from exacerbating the pressure on the finite Earth's carrying capacity.


Conflict of interest statement

The authors declare no competing interests.

Figures

Fig. 1
Fig. 1. Framework for assessing the life cycle environmental impacts of digital content consumption.
Digital content includes web surfing, social media, video streaming, music streaming, and video conferencing. Data centres and end-user devices process and store data, while the core and access networks and the customer premise equipment (e.g., modems and Wi-Fi routers) transfer the data between data centres and users. The background system supplies the equipment (i.e., end-user devices, modems, servers, etc.) and electricity necessary for operation. The icons used in the figure are designed by Freepik.
Fig. 2
Fig. 2. Carbon footprint and share of per capita carrying capacity required by digital content consumption.
Impacts for a user archetype representing the global average consumption patterns across all Internet users. Rows in the heatmap correspond to the electricity mix of various countries ranked according to the carbon footprint (the global average electricity mix is labelled in bold). Very high impacts (global average >40%) are found in climate change and mineral and metal resources use, making it very hard to not transgress the Earth’s carrying capacity considering the remaining goods and services consumed by individuals (i.e., the entire environmental footprint of each individual should not exceed 100%). For more detailed information on the impact assessment methods, their robustness, and the corresponding carrying capacities, see “Methods” section and Supplementary Table 8.
Fig. 3
Fig. 3. Contribution of Internet network components to the life cycle environmental impacts of digital content consumption under three electricity mixes used to power end-user devices.
a Norwegian electricity mix, b global average electricity mix, and c Indian electricity mix. These mixes were chosen to represent a very low (Norway), average (World), and very high (India) GHG emission intensity of electricity. Operation refers to impacts from the consumption of electricity in the use stage, while embodied refers to impacts from raw materials extraction, manufacturing, distribution, and end-of-life management. Overall, the impact embodied in the end-user devices generally dominates the total impacts. CPE: customer premise equipment.
Fig. 4
Fig. 4. Life cycle environmental impacts and share of per capita carrying capacity required by digital content consumption considering 2030 electricity generation scenarios compatible with limiting global warming to 3.5 °C, 2 °C, and 1.5 °C.
Impacts for a user archetype representing the global average consumption patterns across all Internet users. Only the most critical impact categories are displayed: a climate change, b freshwater eutrophication, c marine eutrophication, d particulate matter formation, e freshwater ecotoxicity, and f mineral and metal resources use (fossil resources use is omitted since it is strongly connected with the climate change category). For more detailed information on the impact assessment methods used and their robustness and the corresponding carrying capacities, see “Methods” section and Supplementary Table 8. CPE customer premise equipment.
Fig. 5
Fig. 5. Share of per capita carrying capacity required by digital content consumption over a year vs.  electronic devices lifetime extension.
Impacts for a user archetype representing the global average consumption patterns across all Internet users considering a the current electricity mix scenario and b a 2030 electricity generation scenario compatible with limiting global warming to 1.5 °C. Only the most critical impact categories are displayed (fossil resources use is omitted since it is strongly connected with the climate change category). For more detailed information on the impact assessment methods used and their robustness and the corresponding carrying capacities, see “Methods” section and Supplementary Table 8.

References

    1. Hootsuite. Digital 2022—Global Overview Report—The Essential Guide to the World’s Connected Behaviourhttps://datareportal.com/reports/digital-2022-global-overview-report (2022).
    1. Kamiya, G. Data Centres and Data Transmission Networkshttps://www.iea.org/reports/data-centres-and-data-transmission-networks (2022).
    1. Jones N. How to stop data centres from gobbling up the world’s electricity. Nature. 2018;561:163–166. doi: 10.1038/d41586-018-06610-y. - DOI - PubMed
    1. Andrae ASG. New perspectives on internet electricity use in 2030. Eng. Appl. Sci. Lett. 2020;3:19–31.
    1. Belkhir L, Elmeligi A. Assessing ICT global emissions footprint: trends to 2040 & recommendations. J. Clean. Prod. 2018;177:448–463. doi: 10.1016/j.jclepro.2017.12.239. - DOI