. 2024 May 2;15(1):3606.
doi: 10.1038/s41467-024-47758-8.

Disease related changes in ATAC-seq of iPSC-derived motor neuron lines from ALS patients and controls

Collaborators, Affiliations

Disease related changes in ATAC-seq of iPSC-derived motor neuron lines from ALS patients and controls

Stanislav Tsitkov et al. Nat Commun. .

Abstract

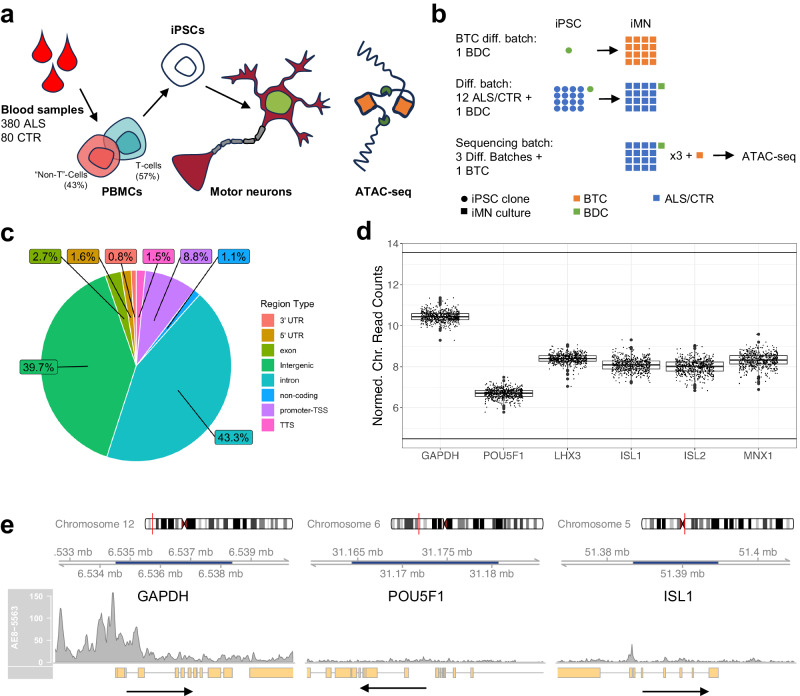
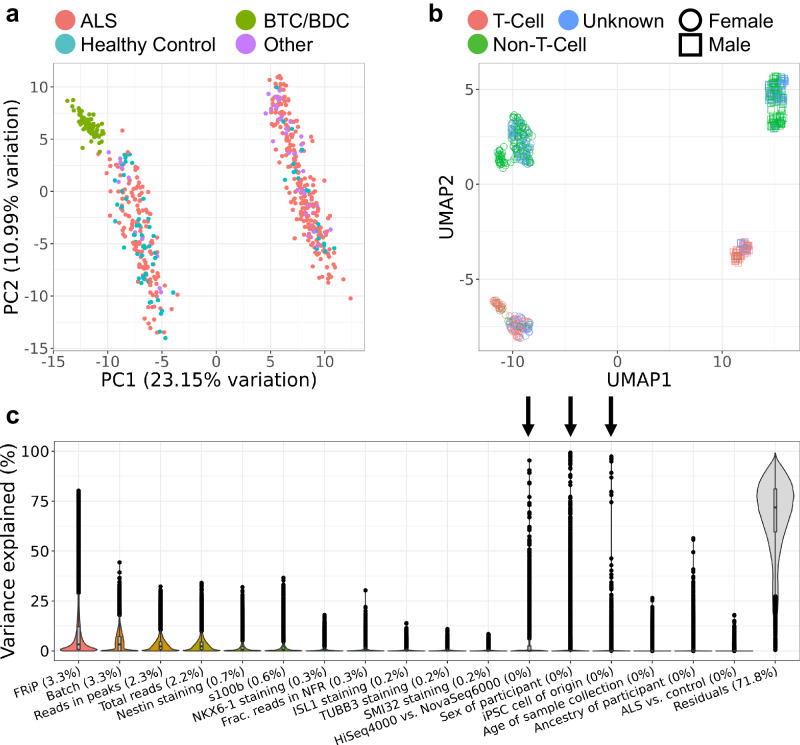
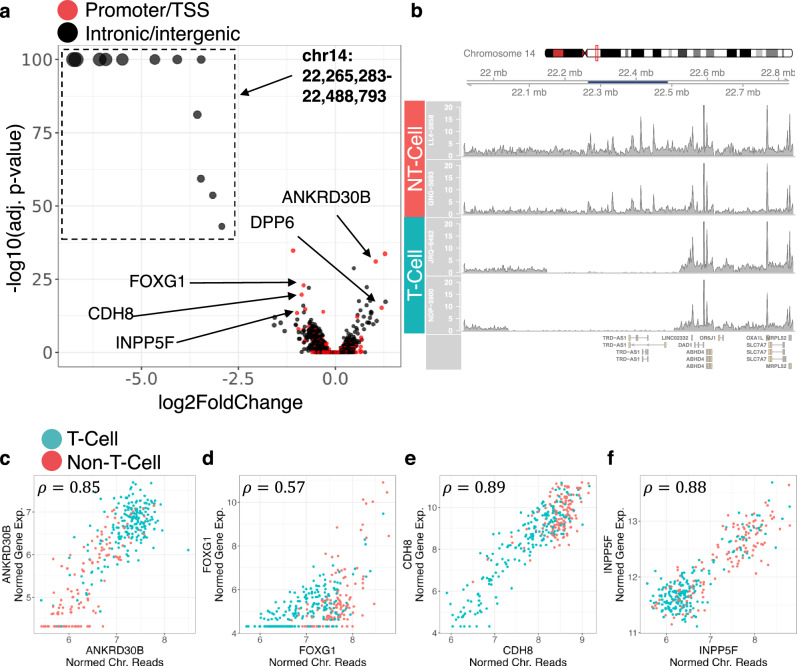
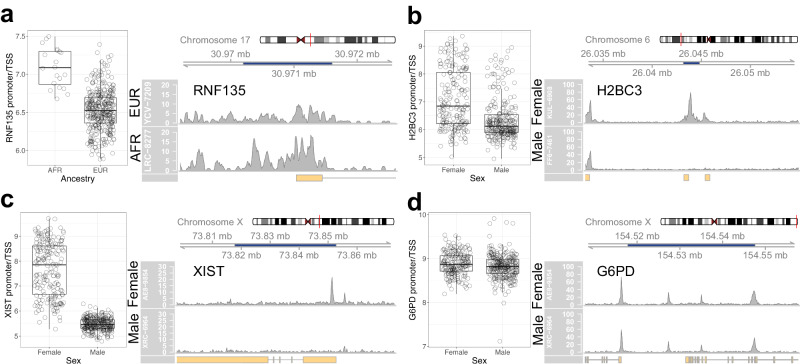
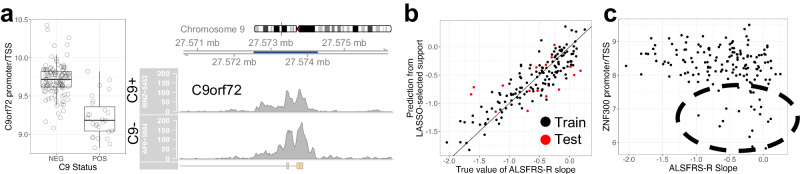
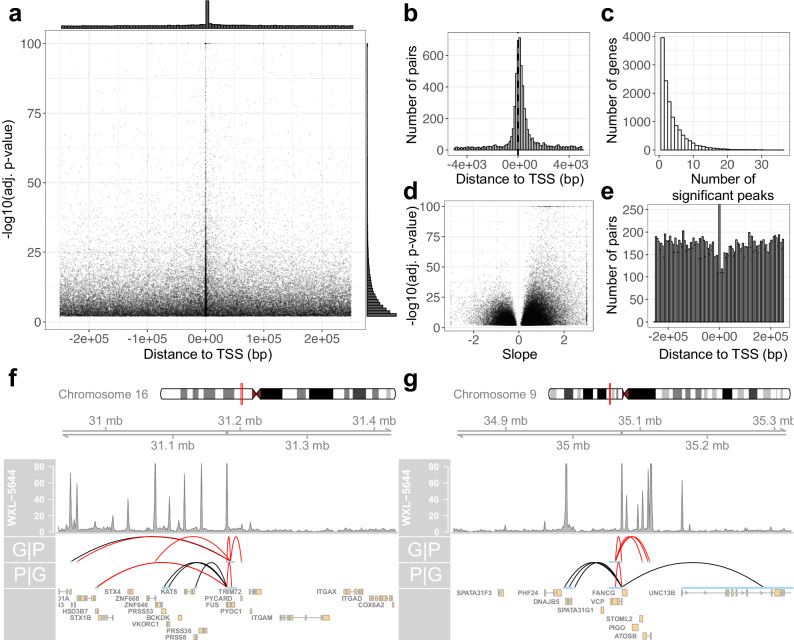
Amyotrophic Lateral Sclerosis (ALS), like many other neurodegenerative diseases, is highly heritable, but with only a small fraction of cases explained by monogenic disease alleles. To better understand sporadic ALS, we report epigenomic profiles, as measured by ATAC-seq, of motor neuron cultures derived from a diverse group of 380 ALS patients and 80 healthy controls. We find that chromatin accessibility is heavily influenced by sex, the iPSC cell type of origin, ancestry, and the inherent variance arising from sequencing. Once these covariates are corrected for, we are able to identify ALS-specific signals in the data. Additionally, we find that the ATAC-seq data is able to predict ALS disease progression rates with similar accuracy to methods based on biomarkers and clinical status. These results suggest that iPSC-derived motor neurons recapitulate important disease-relevant epigenomic changes.


Conflict of interest statement

The authors declare no competing interests.

Figures

Fig. 1
Fig. 1. Answer ALS ATAC-seq data.
a Overview of AALS data generation protocol. PBMCs from ALS patients and healthy controls are reprogrammed into iPSCs, which are in turn differentiated into motor neurons and sent for sequencing. b Overview of study design controls. Samples are divided into differentiation batches and sequencing batches. Each sequencing batch usually consists of three differentiation batches. A BDC is redifferentiated with each differentiation batch, and a BTC is resequenced with each sequencing batch. c Pie chart showing distribution of region annotations. d Normalized chromatin reads plotted for the promoter/TSS for the housekeeping gene, GAPDH, the pluripotency marker, POU5F1, and the spinal motor neuron-specific genes LHX3, ISL1, ISL2, and MNX1 (n = 533). Boxplot boxes indicate the 25th, 50th (median), and 75th quartiles; boxplot whiskers extend 1.5 interquartile ranges from the median. e Raw read coverage plots spanning the gene bodies of GAPDH, POU5F1, and ISL1. Dark blue shading of the genome axis scale indicates the gene body location. All plots are drawn on the same scale. Arrows point in the direction of transcription.
Fig. 2
Fig. 2. Drivers of variation in chromatin accessibility.
a Biplot of PC1 and PC2 from principal component analysis on the top 500 most variably-accessible regions including all samples. “Other” refers to samples from individuals with non-ALS motor neuron disease and asymptomatic ALS. b UMAP applied to 100 most variably-accessible regions separates samples into clusters by sex and PBMC type. c Explained variance in chromatin accessibility by selected covariates across all 100,363 chromatin regions. Data was generated by fitting a linear mixed effects model to normalized chromatin reads for each chromatin region (see Methods). Percentages indicate median contribution to variance. Arrows indicate covariates that were found to drive variation in the PCA of the 500 most variably-accessible regions. Boxplot boxes indicate the 25th, 50th (median), and 75th quartiles; boxplot whiskers extend 1.5 interquartile ranges from the median.
Fig. 3
Fig. 3. Differentiation-associated covariates.
a Volcano plot for PBMC-associated differential signal. The p-values are calculated using a two-sided Wald test as implemented in DESeq2 and adjusted using a B-H correction. b Coverage plot spanning T-cell receptor genomic region for two T-cell-derived samples and two non-T-cell-derived samples. Dark blue region in genome axis scale spans the regions in the box from a. cf Plots of chromatin accessibility against gene expression for selected genes from a. Samples colored according to PBMC type. Pearson correlations between plotted chromatin accessibility and gene expression are indicated in top left corner.
Fig. 4
Fig. 4. Clinical covariates.
a (Left) Normalized chromatin read counts and (right) example coverage plot for individuals of African (AFR) and European (EUR) ancestry for the promoter/TSS of RNF135 (adj. p-value = 3e-14, log2FC = −0.78, nAFR = 20, nEUR = 340). b (Left) Normalized chromatin read counts and (right) example coverage plot for H2BC3, a sex-associated autosomal DAR (adj. p-value = 3e-17, log2FC = −1.16, nFemale = 194, nMale = 262). c (Left) Normalized chromatin read counts and (right) example coverage plot for XIST, a sex-associated DAR that escapes X-inactivation (adj. p-value < 1e-278, log2FC = −4.00, nFemale = 194, nMale = 262). d (Left) Normalized read counts and (right) example coverage plot for G6PD, a housekeeping gene on chromosome X (adj. p-value = 0.02, log2FC = −0.05, nFemale = 194, nMale = 262). All boxplot boxes indicate the 25th, 50th (median), and 75th quartiles; boxplot whiskers extend 1.5 interquartile ranges from the median. All p-values are calculated using a two-sided Wald test as implemented in DESeq2 and adjusted using a B-H correction.
Fig. 5
Fig. 5. AALS ATAC-seq ALS signals.
a (Left) Normalized chromatin read counts (nPOS = 27, nNEG = 112) and (right) example coverage plot for the promoter/TSS of C9orf72; the coverage plot corresponds to an ALS case with a repeat expansion length of 274 (C9+) and an ALS case without the C9orf72 mutation (C9-). b Prediction vs true value of ALSFRS-R slope; samples used to train the classifier are black (ntrain = 140), and samples used to test the classifier are red (ntest = 16). Black line is a reference line of slope 1 and intercept 0. c Normalized chromatin read counts for the promoter of ZNF300, a chromatin region associated with ALSFRS-R slope from the classifier; a set of samples that appear to both have slower disease progressions and low accessibility are circled.
Fig. 6
Fig. 6. ATAC/RNA co-expression analyses.
a Bonferroni-adjusted p-value and distance between peak center and gene transcription start site for all significant peak-gene pairs, with marginal histograms along the top and right axes. Each p-value is calculated using a two-sided Student’s t test. b Same as top marginal histogram in (a) but zoomed in to +/− 5 kb. c Histogram for the number of peaks that each gene is significantly associated with. d Volcano plot of the slope and p-value of all significant peak-gene pairs. Each p-value is calculated using a two-sided Student’s t-test. e Histogram of distance between peak center and gene transcription start site for all significant peak-gene pairs with a negative slope. Coverage plots centered around the FUS gene (f) and VCP gene (g). Arcs in the G|P row link the FUS/VCP transcription start site to peaks that are significantly associated with FUS/VCP gene expression, respectively. Arcs in the P|G row indicate correlations of the FUS/VCP promoter peak accessibility and gene expression. Red – positive correlation; black – negative correlation.

Similar articles

Cited by

References

    1. van Es MA, et al. Amyotrophic lateral sclerosis. Lancet. 2017;390:2084–2098. doi: 10.1016/S0140-6736(17)31287-4. - DOI - PubMed
    1. Ryan M, Heverin M, McLaughlin RL, Hardiman O. Lifetime risk and heritability of amyotrophic lateral sclerosis. JAMA Neurol. 2019;76:1367. doi: 10.1001/jamaneurol.2019.2044. - DOI - PMC - PubMed
    1. Soufi A, et al. Pioneer transcription factors target partial DNA motifs on nucleosomes to initiate reprogramming. Cell. 2015;161:555–568. doi: 10.1016/j.cell.2015.03.017. - DOI - PMC - PubMed
    1. Zhang L, Liu Y, Lu Y, Wang G. Targeting epigenetics as a promising therapeutic strategy for treatment of neurodegenerative diseases. Biochem. Pharmacol. 2022;206:115295. doi: 10.1016/j.bcp.2022.115295. - DOI - PubMed
    1. Chestnut BA, et al. Epigenetic regulation of motor neuron cell death through DNA methylation. J. Neurosci. 2011;31:16619–16636. doi: 10.1523/JNEUROSCI.1639-11.2011. - DOI - PMC - PubMed

Publication types