. 2024 May 2;14(1):75.
doi: 10.1038/s41408-024-01041-7.

Patient-derived follicular lymphoma spheroids recapitulate lymph node signaling and immune profile uncovering galectin-9 as a novel immunotherapeutic target

Affiliations

Patient-derived follicular lymphoma spheroids recapitulate lymph node signaling and immune profile uncovering galectin-9 as a novel immunotherapeutic target

Cèlia Dobaño-López et al. Blood Cancer J. .

Abstract

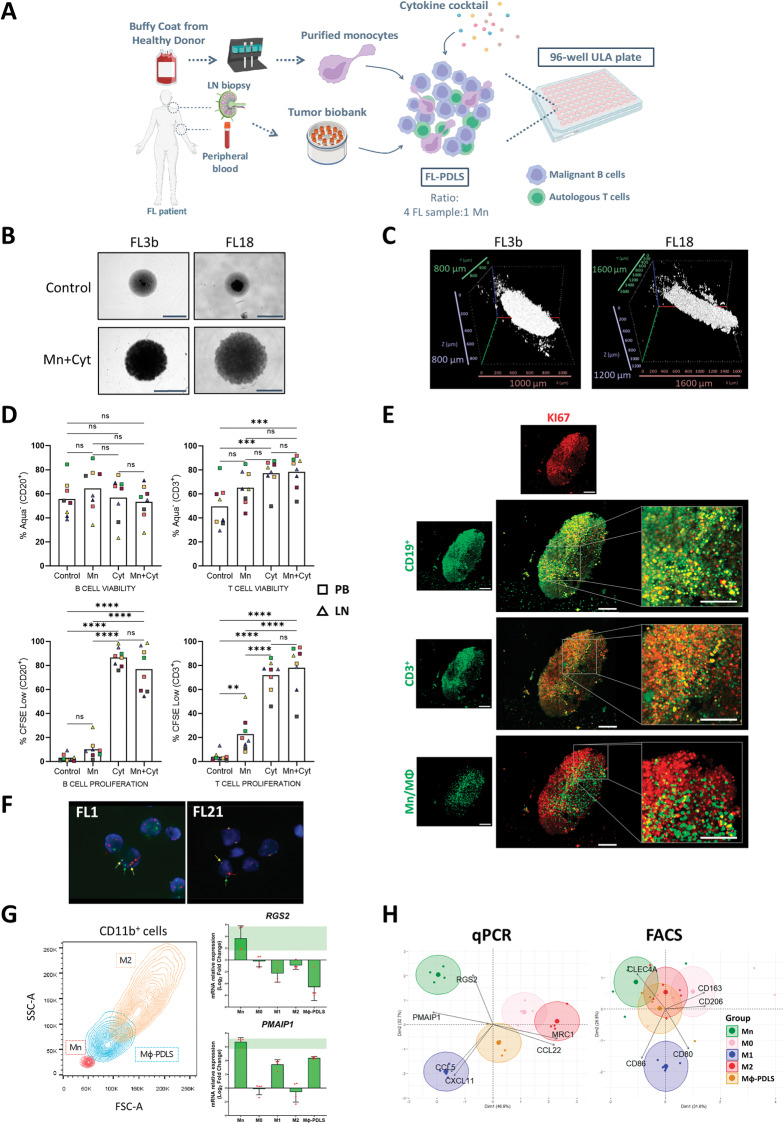
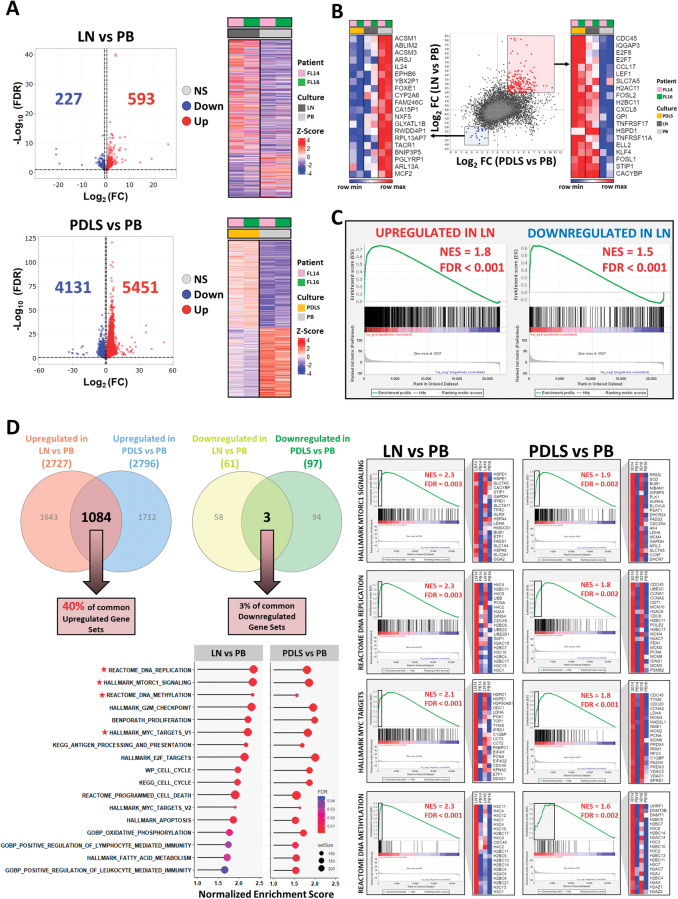
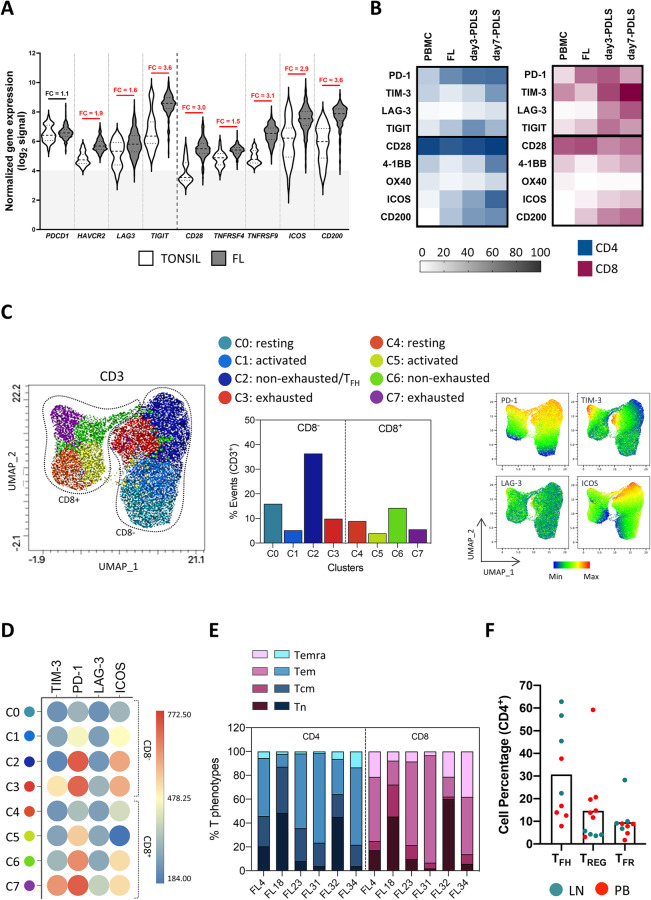
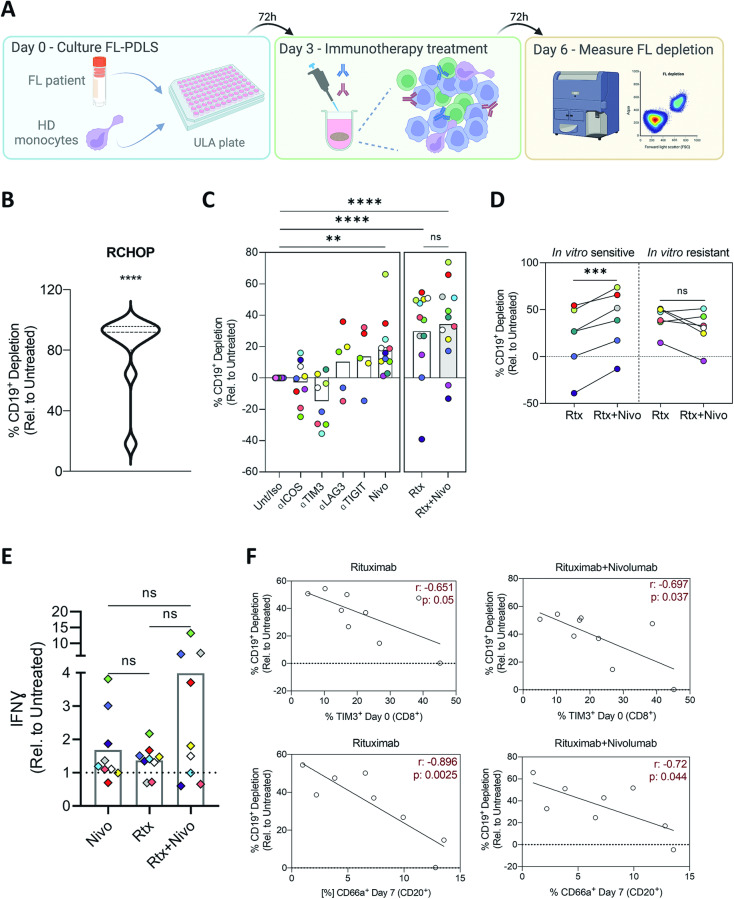
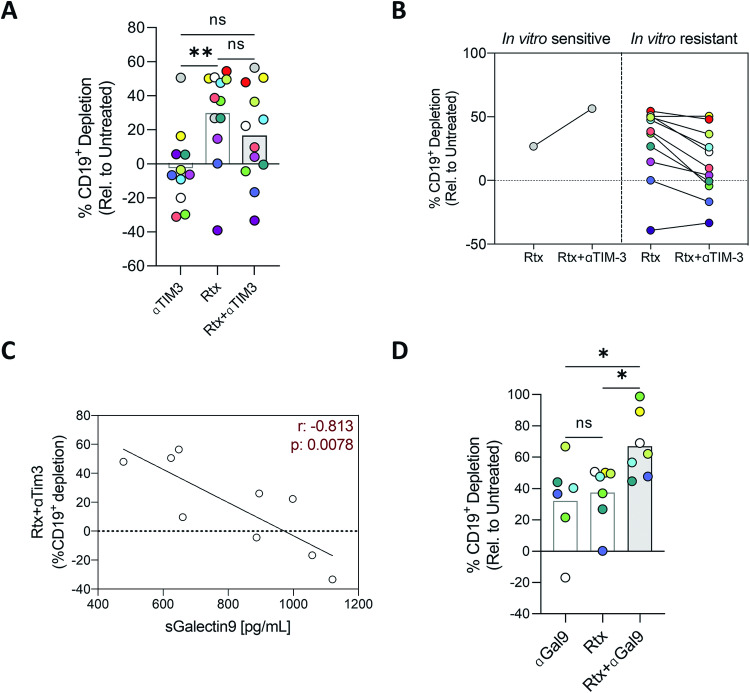
Follicular lymphoma (FL), the most common indolent non-Hodgkin lymphoma, constitutes a paradigm of immune tumor microenvironment (TME) contribution to disease onset, progression, and heterogenous clinical outcome. Here we present the first FL-Patient Derived Lymphoma Spheroid (FL-PDLS), including fundamental immune actors and features of TME in FL lymph nodes (LNs). FL-PDLS is organized in disc-shaped 3D structures composed of proliferating B and T cells, together with macrophages with an intermediate M1/M2 phenotype. FL-PDLS recapitulates the most relevant B-cell transcriptional pathways present in FL-LN (proliferation, epigenetic regulation, mTOR, adaptive immune system, among others). The T cell compartment in the FL-PDLS preserves CD4 subsets (follicular helper, regulatory, and follicular regulatory), also encompassing the spectrum of activation/exhaustion phenotypes in CD4 and CD8 populations. Moreover, this system is suitable for chemo and immunotherapy testing, recapitulating results obtained in the clinic. FL-PDLS allowed uncovering that soluble galectin-9 limits rituximab, rituximab, plus nivolumab/TIM-3 antitumoral activities. Blocking galectin-9 improves rituximab efficacy, highlighting galectin-9 as a novel immunotherapeutic target in FL. In conclusion, FL-PDLS maintains the crosstalk between malignant B cells and the immune LN-TME and constitutes a robust and multiplexed pre-clinical tool to perform drug screening in a patient-derived system, advancing toward personalized therapeutic approaches.


Conflict of interest statement

MN, RM, PB-L, and J-ML are employees of Imactiv3D. The rest of the authors declare no conflict of interest.

Figures

Fig. 1
Fig. 1. FL-PDLS is a novel patient-derived model including an immune microenvironment.
A Schematic representation of the workflow for FL-PDLS generation. Created with BioRender.com. B Brightfield images (Cytation 1) of two representative cases after 7 days of culture showing non-stimulated PDLS (Control) and the PDLS medium with allogeneic monocytes (Mn+Cyt). Magnification 4× and 1000 µm scale. C 3D structure obtained by SPIM microscopy of PDLS shown in (B), under complete condition (Mn+Cyt). D CD20+ and CD3+ population viability (upper panel) was determined by the percentage of Aqua- flow cytometry staining, and proliferation (lower panel) was measured by the percentage of CFSE low signal after 7 days of culture in the four experimental scenarios. Patient coding is included in Table 1. One-way ANOVA followed by the Holm–Sidak post hoc test was applied. E FL-PDLS immunofluorescence of CD19+, CD3+, or Mn/Mϕ cells (green), merged with Ki-67+ (red) to determine the proliferation of each population by signal colocalization (yellow) at day 7 of culture. Captured in confocal Leica TCS SPE microscope. Scale 200 µm. F BCL-2/IGH rearrangement by FISH using IGH/BCL2 dual fusion dual color in FL1 and break-apart probe in the case FL21. FL1: the signal constellation illustrates two yellow signals (yellow arrow) corresponding to the IGH/BCL2 fusion and one red (red arrow), and one green signal (green arrow) for the unrearranged BCL2 and IGH, respectively. Normal cells have two green signals and two red signals. FL21: the signal constellation shows a yellow signal (yellow arrow) for the unrearranged BCL2 and green and red signals for the rearranged BCL2 allele. Normal cells display two yellow signals. G Side scatter (SSC-A) vs forward scatter (FSC-A) plot of CD11b+ cells from Mn, from day 6 Mϕ-PDLS, and from M2 macrophages (left). Gene expression of Mn makers (RGS2 and PMAIP1) by RT-qPCR in CD11b+ cells sorted from day 7-FL-PDLS, compared to Mn, M0, M1, or M2 macrophages. Values are relative to M0 macrophages (mean, n = 4) (right). H PCA diagrams clustering Mɸ-PDLS with in vitro differentiated M0, M1, M2 and non-differentiated Mn, based on CXCL11, CCL5, MRC1, CCL22, RGS2 and PMAIP1 gene expression levels measured by RT-PCR (left), or based on flow cytometry expression of CD163, CD206, CLEC4A, CD80, and CD86 (right).
Fig. 2
Fig. 2. FL-PDLS transcriptome recapitulates the LN signaling.
A Volcano plots representing the differentially expressed genes (DEG) comparing LN with the original FL peripheral blood (PB) sample (upper panel), or FL-PDLS after 7 days of culture with PB sample (lower panel). DEG was obtained by a paired (n = 2) DESeq2 analysis (FDR < 0.1 and absolute log2 Fold change (FC) > 0.5). Heatmaps of DEG for the individual patients (n = 2). NS non-significant, Down Downregulated, Up upregulated. B Scatter plot of RNA-seq comparison of LN versus PB (y-axis) in log2(fold change), and PDLS versus PB (y-axis), for all protein-coding genes. Heatmaps of the top-20 genes commonly upregulated (right) and downregulated (left) genes are displayed (log2FC > 2 or log2FC < −2). C Enrichment plot of LN signatures comparing PDLS vs PB by GSEA. D Venn diagrams of all significant gene set from LN vs PB and PDLS vs PB comparatives by GSEA analysis (upper left panel). Bubble plots representing the most significant and representative GSEA pathways upregulated in LN or PDLS compared to PB (lower left panel). For a selection of significantly enriched gene sets (*), GSEA plots of LN or PDLS compared to PB and a heatmap of the leading genes are represented (lower right panel).
Fig. 3
Fig. 3. FL-PDLS immune profile.
A Differential gene expression analysis from microarray data obtained from public repositories (detailed in supplemental methods) showed up-regulation of several immune regulators in FL-LN (n = 427) compared to a normal tonsil (n = 30). Fold changes (FC) are indicated and red color means statistical significance (unpaired nonparametric t test, Mann–Whitney). B Heatmap representing the percentage of positive cells assessed by flow cytometry for the immune regulators on CD4 and CD8 T cells of day 3-and day 7 FL-PDLS (n = 3–11). Results were compared with PBMCs from healthy donors (n = 4). C Uniform Manifold Approximation and Projection (UMAP) plot for day 3-FL-PDLS autologous CD3+ cells based on the expression of activation and exhaustion markers assessed by flow cytometry and colored by cluster identity (left panel). Percentage distribution of those clusters (middle panel). UMAP plots show the distribution of PD-1, TIM-3, LAG-3, and ICOS expression (right panel). D Average expression levels of each protein represented on CD3+ clusters (n = 6). E Day 3-FL-PDLS autologous CD3+ phenotypes based on flow cytometry CCR7 and CD45RA expression. F Percentage of TFH (CXCR5+FoxP3), TREG (CXCR5FoxP3+), and TFR (CXCR5+FOXP3+) out of CD4+ population on day 3-FL-PDLS. Patients are identified by the origin of the FL sample.
Fig. 4
Fig. 4. FL-PDLS represents a suitable system for immunotherapy drug screening.
A Schematic representation of the workflow used to treat FL-PDLS with immunotherapeutic agents. HD healthy donors. Created with BioRender.com. B Percentage of B cell depletion induced by R-CHOP or C a sort of selected monoclonal antibodies (IgG1κ mAbs) against IC of interest, and nivolumab (Nivo) combined with rituximab (Rtx) relative to the untreated/Isotype condition (Unt/Iso). Depletion was assessed by Aqua+ cell counting. D Percentage of B cell depletion for rituximab (Rtx) and its combination with nivolumab (Rtx+Nivo) of in vitro responder (R) and non-responder (NR) patients. Patients were considered responders when reaching a Response Index* superior to the median value of 18%. Patient coding is included in Table 1. E IFNɣ levels (pg/mL) were measured in the day 6-PDLS supernatants relative to the untreated condition (right panel). Quantification was done using the CBA application. Each supernatant was recovered from 6 replicates per condition and patient. Patient coding is indicated. F Correlation plots by simple linear regression of B cell depletion in FL-PDLS treated with rituximab or rituximab + nivolumab and the expression of TIM-3 in CD8+ cells at basal levels (day 0) and CD66a in B cells at day 7 of culture. Paired t test–Wilcoxon matched-pairs signed rank test was applied in (B) and (D), and one-way ANOVA followed by Holm–Sidak post hoc test for (C) and (E). *Responseindex=BcelldepletionRtx+NivoBcelldepletion(Rtx)Bcelldepletion(Rtx)*100.
Fig. 5
Fig. 5. Galectin-9 blockade improves rituximab-induced depletion in FL-PDLS.
A B cell depletion induced by mAb anti-TIM-3 (αTIM-3), rituximab (Rtx), or the combination (Rtx + αTIM-3) in all patients and, B classified in in vitro responder (R) and non-responder (NR) patients to the combination. Patient coding is included in Table 1. C Correlation by simple linear regression between galectin-9 levels (pg/mL) analyzed by ELISA of FL PDLS supernatants at the endpoint (day 6) and the B cell depletion induced by rituximab + anti-TIM-3. D B cell depletion induced by mAb anti-galectin-9 (ɑGal9), rituximab (Rtx), or the combination. One-way ANOVA followed by Holm-Sidak post hoc test was applied for (A) and (D).

Similar articles

Cited by

References

    1. Swerdlow SH, Campo E, Pileri SA, Lee Harris N, Stein H, Siebert R, et al. The 2016 revision of the World Health Organization classification of lymphoid neoplasms. Blood. 2016;127:2375–90. - PMC - PubMed
    1. Link BK, Maurer MJ, Nowakowski GS, Ansell SM, MacOn WR, Syrbu SI, et al. Rates and outcomes of follicular lymphoma transformation in the immunochemotherapy era: a report from the University of Iowa/Mayo Clinic specialized program of research excellence molecular epidemiology resource. J Clin Oncol. 2013;31:3272–8. - PMC - PubMed
    1. Jacobsen E. Follicular lymphoma: 2023 update on diagnosis and management. Am J Hematol. 2022;97:1638–51. - PubMed
    1. Carbone A, Roulland S, Gloghini A, Younes A, von Keudell G, López-Guillermo A, et al. Follicular lymphoma. Nat Rev Dis Prim. 2019;5:83. - PubMed
    1. Araf S, Okosun J, Koniali L, Fitzgibbon J, Heward J. Epigenetic dysregulation in follicular lymphoma. Epigenomics. 2016;8:77–84. - PMC - PubMed

Publication types

LinkOut - more resources