. 2024 May 2;15(5):311.
doi: 10.1038/s41419-024-06668-9.

A novel inhibitor of the mitochondrial respiratory complex I with uncoupling properties exerts potent antitumor activity

Affiliations

A novel inhibitor of the mitochondrial respiratory complex I with uncoupling properties exerts potent antitumor activity

Alaa Al Assi et al. Cell Death Dis. .

Abstract

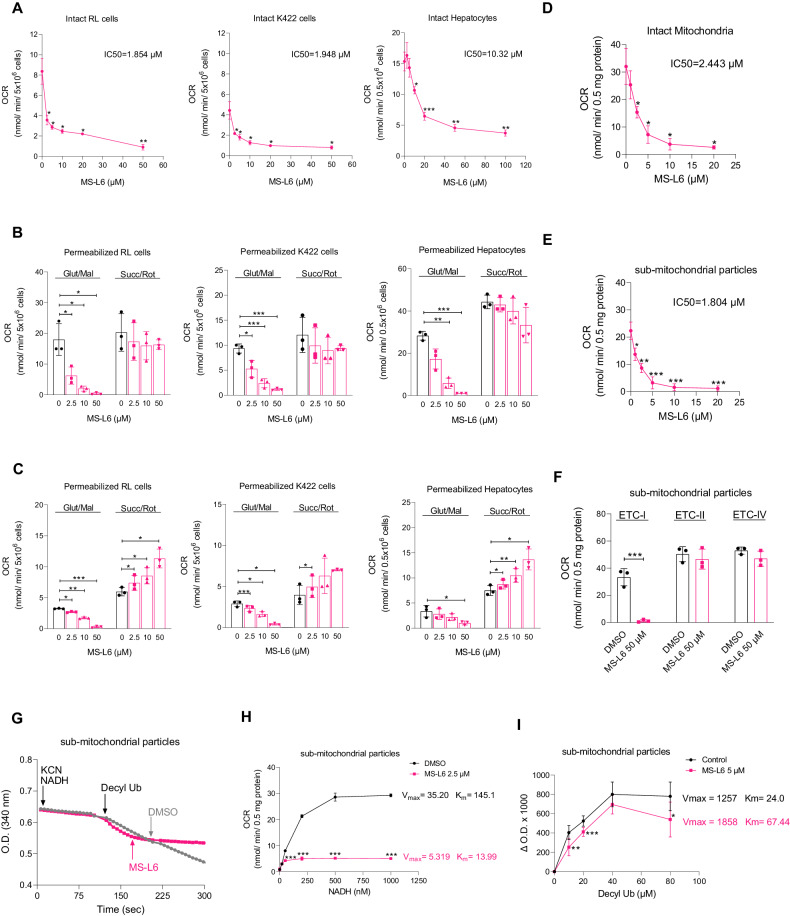
Cancer cells are highly dependent on bioenergetic processes to support their growth and survival. Disruption of metabolic pathways, particularly by targeting the mitochondrial electron transport chain complexes (ETC-I to V) has become an attractive therapeutic strategy. As a result, the search for clinically effective new respiratory chain inhibitors with minimized adverse effects is a major goal. Here, we characterize a new OXPHOS inhibitor compound called MS-L6, which behaves as an inhibitor of ETC-I, combining inhibition of NADH oxidation and uncoupling effect. MS-L6 is effective on both intact and sub-mitochondrial particles, indicating that its efficacy does not depend on its accumulation within the mitochondria. MS-L6 reduces ATP synthesis and induces a metabolic shift with increased glucose consumption and lactate production in cancer cell lines. MS-L6 either dose-dependently inhibits cell proliferation or induces cell death in a variety of cancer cell lines, including B-cell and T-cell lymphomas as well as pediatric sarcoma. Ectopic expression of Saccharomyces cerevisiae NADH dehydrogenase (NDI-1) partially restores the viability of B-lymphoma cells treated with MS-L6, demonstrating that the inhibition of NADH oxidation is functionally linked to its cytotoxic effect. Furthermore, MS-L6 administration induces robust inhibition of lymphoma tumor growth in two murine xenograft models without toxicity. Thus, our data present MS-L6 as an inhibitor of OXPHOS, with a dual mechanism of action on the respiratory chain and with potent antitumor properties in preclinical models, positioning it as the pioneering member of a promising drug class to be evaluated for cancer therapy. MS-L6 exerts dual mitochondrial effects: ETC-I inhibition and uncoupling of OXPHOS. In cancer cells, MS-L6 inhibited ETC-I at least 5 times more than in isolated rat hepatocytes. These mitochondrial effects lead to energy collapse in cancer cells, resulting in proliferation arrest and cell death. In contrast, hepatocytes which completely and rapidly inactivated this molecule, restored their energy status and survived exposure to MS-L6 without apparent toxicity.


Conflict of interest statement

The authors declare no competing interests.

Figures

None
MS-L6 exerts dual mitochondrial effects: ETC-I inhibition and uncoupling of OXPHOS. In cancer cells, MS-L6 inhibited ETC-I at least 5 times more than in isolated rat hepatocytes. These mitochondrial effects lead to energy collapse in cancer cells, resulting in proliferation arrest and cell death. In contrast, hepatocytes which completely and rapidly inactivated this molecule, restored their energy status and survived exposure to MS-L6 without apparent toxicity.
Fig. 1
Fig. 1. MS-L6 inhibits respiration of hepatocytes and cancer cells via ETC-I.
A Shows the OCR of intact hepatocytes, RL and K422 cells as function of MS-L6 concentration. The corresponding IC50 values of MS-L6 were calculated by fitting of dose-response curves in GraphPad Prism and are indicated above each curve. Data are presented as mean ± SD, n = 3. B, C Show the OCR of digitonin-permeabilized hepatocytes, RL and K422 cells treated with the indicated concentrations of MS-L6, driven by ETC-I (Glut/Mal :5 mM malate, 2.5 mM glutamate) or ETC-II (Succ/Rot:5 mM succinate, 1 µM rotenone) substrates in mitochondrial assay buffer, under ADP phosphorylation conditions (5 mM ADP) and resting state (1 µM oligomycin), respectively. Data are shown as means ± SD, n = 3. Panel (D) reports OCR of 0.5 mg/mL of intact rat liver mitochondria driven by ETC-I substrate (Glut/Mal) as function of MS-L6 concentration under phosphorylation conditions. Data are presented as mean ± SD, n = 3. E Shows OCR of 0.5 mg/mL of rat liver sub-mitochondrial particles driven by ETC-I substrate (1 mM NADH, in the presence of 5 mM inorganic phosphate) as function of MS-L6 concentration. Data are expressed as mean ± SD, n = 3. F Shows OCR of 0.5 mg/mL rat liver sub-mitochondrial particles driven by substrates for ETC-I (1 mM NADH), ETC-II (2 mM succinate) and ETC-IV (250 µM/100 µM TMPD/ascorbate), respectively, in the presence of DMSO (vehicle control) or 50 µM MS-L6. Data are expressed as mean ± SD, n = 3. G Shows ETC-I activity as measured by following NADH absorbance by spectrophotometry at 340 nM of rat liver sub-mitochondrial particles in the presence of DMSO (vehicle control) or 50 µM MS-L6. Sub-mitochondrial particles were first incubated with 100 µM NADH in the presence of 1 mM KCN, and then 100 µM decylubiquinone was added. Where indicated, DMSO (black lane) or 50 µM MS-L6 (pink lane) was added. The absorbance curves represent one typical experiment; similar results were obtained in two other experiments. H Shows the OCR of 0.5 mg/mL sub-mitochondrial particles incubated with DMSO (vehicle control) or 2.5 µM MS-L6, after titration with increasing concentrations of the ETC-I substrate, NADH. Maximum velocity (Vmax) and Michaelis constant (Km) of each lane are indicated. Data are presented as mean ± SD, n = 3. I Reports ETC-I activity measured by following NADH absorbance spectrophotometrically at 340 nM of rat liver sub-mitochondrial particles in the presence of DMSO (vehicle control) or 5 µM MS-L6. Sub-mitochondrial particles were incubated with 1 mM NADH in the presence of 1 mM KCN upon titration with increasing concentrations of decylubiquinone. Because higher concentration of decylubiquinone tended to inhibit NADH oxidation, especially in the presence of MS-L6(Fig. S2A left), we constructed Michaelis-Menten saturation curves showing the NADH oxidation of mitochondrial fragments incubated with either DMSO or MS-L6, upon titration with increasing concentrations of decylubiquinone by removing the higher concentration. Maximum velocity (Vmax) and Michaelis constant (Km) of each trace are shown. Data are expressed as means ± SD, n = 3. Statistical significance was determined as described in materials and methods.
Fig. 2
Fig. 2. MS-L6 decreases ΔΨm in rat liver mitochondria and cancer cells.
AC Report ΔΨm of 0.5 mg/mL of intact rat liver mitochondria energized with ETC-I substrate (Glut/Mal), with ETC-II substrate (Succ), or with ETC-I substrate (Glut/Mal) after cyclosporin A (CsA) pretreatment, respectively, after treatment with either 1 µM rotenone (blue curve) or 50 µM MS-L6 (pink curve). Finally, 0.875 µM FCCP was added to fully depolarize ΔΨm. D, E Show ΔΨm of 0.5 mg/ml of intact rat liver mitochondria energized with Glut/Mal, after treatment with 50 µM MS-L6 or 0.875 µM FCCP followed by addition of ATP, or with 50 µM MS-L6 followed by addition of ATP plus 2 µg/ml oligomycin, respectively. All curves illustrate one typical experiment and similar results were obtained in 2 other experiments. F Shows ΔΨm of intact RL and K422 cells, measured 1 h after treatment with DMSO (negative control), or different combinations of 50 µM MS-L6, 1 µM rotenone and 2 µg/mL oligomycin. Data are expressed as mean ± SD, n = 3. Statistical significance was determined as described in materials and methods.
Fig. 3
Fig. 3. MS-L6 modifies the energy status in cancer cells.
A Represents typical HPLC chromatograms showing the peaks of ATP, ADP and AMP of entire hepatocytes, RL and K422 cells cultured in the presence of DMSO (vehicle control) or 50 µM MS-L6 up to 3 h. B Represents calculated ATP/ADP ratios obtained after 3, 24, and 48 h of treatment. Data are presented as mean ± SD, n = 3. C Shows OCR of rat liver sub-mitochondrial particles driven by ETC-I substrate (1 mM NADH) in the presence of culture medium from hepatocytes, RL and K422 cells at different time points after treatment with 50 µM MS-L6 compared to culture medium from control cells (% of control). Data are presented as means ± SD, n = 3. D Reports glucose consumption and lactate production in hepatocytes, RL and K422 cells cultured in the presence of either DMSO (vehicle control) or 50 µM MS-L6 for 48 h. Metabolic fluxes are expressed as number of units (µmol) per unit of living cells per 24 h. The mean is shown, n = 3. Statistical significance was determined as described in materials and methods.
Fig. 4
Fig. 4. MS-L6 toxicity on tumour versus non tumour cells.
A Shows the number of live cells; automated flow cytometry analysis allows total and live cell count per well. Analysis was performed 48 h after treatment of RL, K422 and SUDHL4 cells with DMSO diluent (NT), 10 µM MS-L6, 10 µM IACS-0105-759 or 1 µM rotenone. To standardize the analyses between cell lines and experiments, the mean of the number of live cells in 8 replicate wells treated with diluent (NT) was calculated and then the percentage of live cells post-treatment relative to this mean was calculated. Each point represents the percentage obtained for one replicate well. Line represents the mean of values. The graph is representative of 3 independent experiments. B Shows the percentage of viable cells detected 48 h after treatment with 10 µM MS-L6 or IACS-010759 in a panel of malignant haematological cell lines. The percentage of viable cells treated with MS-L6/IACS-010759 compared to cells treated with diluent is shown, calculated as in (A). Data are presented as mean ± SD of 3 independent experiments with at least 4 technical replicates. Significance has been indicated for the most representative cell lines only, to make the graph easier to read. CE Represent analysis of MS-L6 effects on human PBMCs using flow cytometric immunophenotyping. C Shows the global number of live cells (CD45 + /annexin), i.e. including all populations, according to the treatment applied to the cells (diluent: DMSO, IACS-010759 10 µM and MS-L6 10-40 µM). D Shows the optimised t-SNE representation after integration of the 3 donor data sets with visualisation of all PBMC subpopulations. In this representation, each dot represents one cell, and each colour represents one subpopulation identified by labelling with the antibodies described in Table S1. Individual donor data sets are available on (Fig. S5). E Shows the live cell counts of the more visually affected populations in the panel (D), with each point on boxes and whiskers (Min to Max, all points) representing the value of a single technical replicate, for each of the 3 donor samples described in the figure S5. Statistical significance was determined as described in materials and methods.
Fig. 5
Fig. 5. ECT-1 targeting by MS-L6 causes tumor cell toxicity.
A Reports effect of MS-L6 on NADH oxidation activity (as shown in Fig. 1G) of yeast mitochondria. NADH absorbance was measured spectrophotometrically at 340 nM. NDI-1 was functionally isolated from the rest of the MRC by incubating yeast mitochondria with 100 µM NADH substrate, 1 mM KCN to block electron transfer by ECT-IV and 100 µM decylubiquinone as the final acceptor of electrons from ECT-I. Then, where indicated, DMSO (black trace) or 50 µM MS-L6 (pink trace) was added. These curves represent one typical experiment; similar results were obtained in two other experiments. B Reports the viability of K422 cells overexpressing (NDI1) or not (CT) the yeast NDI1 protein, after treatment with increasing doses of MS-L6, IACS-010759, FCCP or rotenone. Results are expressed as percentage of cells treated with vehicle (DMSO). Viable cells were detected using CellTiter-Fluor™ Cell Viability Assay. Each point represents the mean of 4 experimental replicates in one representative experiment, n = 3. Images of microscopic analysis of cells prior to biochemical assay are shown on the right. C Depicts the superoxide production of RL and K422 cells measured by flow cytometry using the MitoSOX probe. Data are presented as mean ± SD, n = 3. D Reports cell viability of K422 cells measured by trypan blue exclusion using the Lunaautomated cell counter (Logos Biosystem) exposed or not to 50 µM MS-L6 in the presence or absence of 4 mM N-acetylcysteine (NAC). Data are presented as mean ± SD, n = 3. Statistical significance was determined as described in materials and methods.
Fig. 6
Fig. 6. MS-L6 exerts antitumor activity in preclinical models.
A Shows the dosage of MS-L6 in the sera of mice during preliminary pilot toxicity experiments using LC/MS analysis, 1 h after IP injection of increasing doses of the molecule (left), and the short procedure used for the preclinical evaluation of the effect MS-L6 in CDX models (right). The serum concentration reaches ~1 µM 1 h post-treatment with 50 mg/kg injected. After xenograft of human lymphoma cell lines in SCID mice, animals with nascent tumours were treated with diluent (DMSO) or 50 mg/kg MS-L6 by IP injection, 5/7 days per week, until the maximal ethically accepted volume was reached. B Reports the evolution of tumour volume of mice bearing subcutaneous xenografts of RL (left) or SUDHL4 (right) cells, following treatment with MS-L6 (50 mg/kg) or diluent (untreated). Median is shown. Each point represents one mouse. Statistical significance was determined as described in materials and methods.

Similar articles

Cited by

References

    1. DeBerardinis RJ, Chandel NS. Fundamentals of cancer metabolism. Sci Adv. 2016;2:e1600200. doi: 10.1126/sciadv.1600200. - DOI - PMC - PubMed
    1. Vyas S, Zaganjor E, Haigis MC. Mitochondria and Cancer. Cell. 2016;166:555–66. doi: 10.1016/j.cell.2016.07.002. - DOI - PMC - PubMed
    1. Martinez-Reyes I, Chandel NS. Cancer metabolism: looking forward. Nat Rev Cancer. 2021;21:669–80. doi: 10.1038/s41568-021-00378-6. - DOI - PubMed
    1. Sica V, Bravo-San Pedro JM, Stoll G, Kroemer G. Oxidative phosphorylation as a potential therapeutic target for cancer therapy. Int J Cancer. 2020;146:10–7. doi: 10.1002/ijc.32616. - DOI - PubMed
    1. Kluckova K, D’Avola A, Riches JC. Advances in Understanding of Metabolism of B-Cell Lymphoma: Implications for Therapy. Cancers (Basel) 2022;14:5552. doi: 10.3390/cancers14225552. - DOI - PMC - PubMed

Publication types

MeSH terms