. 2024 May 2;15(1):3700.
doi: 10.1038/s41467-024-47886-1.

Multimodal analysis of cfDNA methylomes for early detecting esophageal squamous cell carcinoma and precancerous lesions

Affiliations

Multimodal analysis of cfDNA methylomes for early detecting esophageal squamous cell carcinoma and precancerous lesions

Jiaqi Liu et al. Nat Commun. .

Abstract

Detecting early-stage esophageal squamous cell carcinoma (ESCC) and precancerous lesions is critical for improving survival. Here, we conduct whole-genome bisulfite sequencing (WGBS) on 460 cfDNA samples from patients with non-metastatic ESCC or precancerous lesions and matched healthy controls. We develop an expanded multimodal analysis (EMMA) framework to simultaneously identify cfDNA methylation, copy number variants (CNVs), and fragmentation markers in cfDNA WGBS data. cfDNA methylation markers are the earliest and most sensitive, detectable in 70% of ESCCs and 50% of precancerous lesions, and associated with molecular subtypes and tumor microenvironments. CNVs and fragmentation features show high specificity but are linked to late-stage disease. EMMA significantly improves detection rates, increasing AUCs from 0.90 to 0.99, and detects 87% of ESCCs and 62% of precancerous lesions with >95% specificity in validation cohorts. Our findings demonstrate the potential of multimodal analysis of cfDNA methylome for early detection and monitoring of molecular characteristics in ESCC.


Conflict of interest statement

The authors declare no competing interests.

Figures
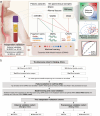
Fig. 1
Fig. 1. Study design and patient enrollment.
a An approach called ‘expanded multimodal analysis’ (EMMA) has been developed using machine learning to enhance the detection of ctDNA from cfDNA in plasma samples. This is achieved by comprehensively analyzing cancer-derived differentially methylated regions (DMRs), copy number variants (CNVs), and fragmentation features in the cfDNA whole-genome bisulfite sequencing (cfWGBS) data. The cancer-derived DMRs and CNVs were initially identified from paired WGBS and whole-genome sequencing (WGS) data of primary tumors and matched adjacent non-neoplastic tissues of 155 patients with esophageal squamous cell carcinoma (ESCC). Subsequently, the ESCC-derived DMRs and CNVs were examined in cfWGBS data and further utilized with the proportion of short cfDNA fragment sizes to train the diagnostic models in the discovery cohort. The performance of each diagnostic model was independently assessed in an external ESCC cohort and a precancerous cohort. To unveil the biological significance of these optimal DMRs, we correlated them with multi-omics-based molecular subtypes and transcriptomic profiles in the paired ESCC tissue samples. b The discovery cohort encompassed 150 patients with ESCC or high-grade intraepithelial neoplasia and 150 matched health controls to construct the diagnostic model using different cfDNA features. The performance of each diagnostic model was evaluated independently in an external ESCC cohort and a precancerous cohort. ESCC esophageal squamous cell carcinoma, IEN intraepithelial neoplasia, WGS whole-genome sequencing, WGBS whole-genome bisulfite sequencing, cfWGBS cfDNA WGBS, RNAseq RNA sequencing, HC healthy control, CNV copy number variant, DMR differentially methylated region, IM immune modulation, CCA cell cycle pathway activation, IS immune suppression, NRFA NRF2 oncogenic activation.
Fig. 2
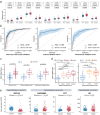
Fig. 2. Cell-free DNA methylation markers and their detection performance for esophageal squamous cell carcinoma.
a Among the differentially methylated regions (DMRs) identified in esophageal squamous cell carcinoma (ESCC) tissues, 650 DMRs were recalled through an adjusted p value < 0.05 (two-sided Wilcoxon test), favoring DMRs with ESCC average values (n = 150) more significant than healthy controls (n = 150) in the discovery cohort, as determined by the malignant ratio. The figure shows malignant ratios with the p value of the top ten DMRs as examples. Data are presented as median values with maximums and minimums. b The diagnostic performances of the ESCC-cfMeth score were evaluated in the discovery cohort (tenfold cross-validation, the curve of each color indicating one cross-validation), the external validation cohort, and the precancerous validation cohort. The black curves represent the receiver operating characteristic (ROC) curves and the blue areas indicate the 95% confidence intervals (CI). c The final prediction model (ESCC-cfMeth score) was constructed using the cfDNA malignant ratios of the optimal 50 markers. The ESCC-cfMeth scores were significantly higher in patients with ESCC and intraepithelial neoplasia (IEN) than the HCs in the discovery cohort and the validation cohorts (two-sided Mann–Whitney U-test, p < 0.01). Data are presented as median values with maximums and minimums. d Compared to the HCs, the ESCC-cfMeth scores were robustly elevated among ESCCs of different stages (left; n = 30, 9, 6, and 15, respectively) and IENs (right; n = 50, 12, and 38, respectively). Data are presented as median values with maximums and minimums. e Differential expression of functional genes was found within the 50 optimal DMRs in comparison of gene expression between ESCC tissues and paired adjacent non-neoplastic tissues (n = 155) using a two-sided Wilcoxon test or t test (p < 2.2 × 10–16 for ZNF132, p = 1.1 × 10–8, 2.7 × 10–14, and 0.078 for LINC00680, FLT1, and ID1, respectively). Data are presented as median values with maximums and minimums. ESCC esophageal squamous cell carcinoma, IEN intraepithelial neoplasia, LGIEN low-grade IEN, HGIEN high-grade IEN, HC healthy control, DMR differentially methylated region, AUC area under curve, CI confidence interval. Source data are provided as a Source Data file.
Fig. 3
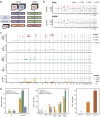
Fig. 3. Recalling and analyzing the copy number variant events in cell-free DNA whole-genome bisulfite sequencing data.
a A whole-genome bisulfite sequencing (WGBS)-based approach for recalling recurrent copy number variants (CNVs) in WGBS data from tissues and cfDNA. b Take Patient 002 in the ECGEA cohort as an example, the amplifications in chr. 3 and chr.5 and deletions in chr. 3, 4, 9, 10, 11, 13, 16,18, and 21 were identified in whole-genome sequencing data and recalled in paired WGBS data. c Compared to the CNV events in 150 healthy controls (HCs), 153 regions had significantly higher CNV event rates in 150 patients with esophageal squamous cell carcinoma (ESCC). The amplifications (red) and deletions (blue) were shown with the corresponding adjusted p value (false discovery rate, FDR) of the difference in ESCCs vs. HCs (two-sided t test; ns, gray; FDR <  0.05, yellow; FDR <  0.01, orange; FDR <  0.001, dark red). d The CNV-positive rates were significantly higher in patients with ESCC and intraepithelial neoplasia (IEN) than the HCs in the discovery cohort and the validation cohorts and positively correlated with the stages and grades. ESCC esophageal squamous cell carcinoma, IEN intraepithelial neoplasia, LGIEN low-grade IEN, HGIEN high-grade IEN, HC healthy control, WGS whole-genome sequencing, WGBS whole-genome bisulfite sequencing, GMM Gaussian Mixture Model, HMM Hidden Markov Model, CNV copy number variant, AMPL amplification, DELE deletion, ns no significance, G grade. Source data are provided as a Source Data file.
Fig. 4
Fig. 4. Analyzing the cell-free DNA fragment size in whole-genome bisulfite sequencing data.
a The fragment sizes of cfDNA were surveyed in the discovery cohort. Both the peaks in cfDNA were 166 bp in esophageal squamous cell carcinoma (ESCC) patients and healthy controls. However, more short fragments (90–150 bp) were found in the ESCC groups. b The ratio of short fragments in cfDNA was calculated as the fragment size ratio (FSR) in whole-genome bisulfite sequencing data. c. The human genome was divided into 5 Mb bins, resulting in a total of 1082 (541 bins × 2) FSR features. d In the discovery cohort, no significant difference in the average FSR was observed across all bins between ESCC patients and HCs. However, we identified 83 bins where the FSRs were significantly elevated in ESCC patients than HCs in the discovery cohort. The average FSRs in the 83 selected bins were significantly higher in the ESCC patients in the discovery cohort and the external validation cohort, but not the intraepithelial neoplasia patients in the precancerous validation cohort (two-sided Mann–Whitney U-test, p < 0.05). Data are presented as median values with maximums and minimums. ESCC esophageal squamous cell carcinoma, IEN intraepithelial neoplasia, LGIEN low-grade IEN, HGIEN high-grade IEN, HC healthy control, WGS whole-genome sequencing, WGBS whole-genome bisulfite sequencing, MAPQ mapping quality, MDS multidimensional scaling. Source data are provided as a Source Data file.
Fig. 5
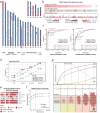
Fig. 5. Complementarities of the three cell-free DNA features and the performance of the combined models.
a The distributions of cfDNA methylation markers, copy number variants, and fragmentation features in the human genome. b Complementarities between these three features were found in the esophageal squamous cell carcinoma (ESCC) patients in the discovery cohort. Each bar indicates the status of each feature in a ESCC patient. c The diagnostic performances of the ESCC-cfMeth score, DMR plus CNV model, and EMMA model were evaluated in the external validation cohort and the precancerous validation cohort. d The detection rate of the ESCC-cfMeth score, the DMR plus CNV model, and the EMMA model for intraepithelial neoplasia (IEN), stages I, II, and III ESCC. e In the external validation cohort, improved performances of the combined models resulted from the complementarities in three features. f The potential survival benefit of the EMMA model and the ESCC-cfMeth model were estimated according to different test intervals, ranging from 5 years to continuous testing (idealized). g The Schematic diagram of the detection rates for different cfDNA features and combined models and 5-year survival in different stages. ESCC esophageal squamous cell carcinoma, IEN intraepithelial neoplasia, FSR fragment size ratio, CNV copy number variant, DMR differentially methylated region, EMMA expanded multimodal analysis, Meth methylation, hypo hypomethylation, hyper hypermethylation, AUC area under curve, CI confidence interval. Source data are provided as a Source Data file.
Fig. 6
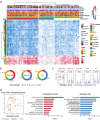
Fig. 6. The biological significance of the DNA methylation markers in esophageal squamous cell carcinoma cell-free DNA.
a We divided the 155 patients with esophageal squamous cell carcinoma (ESCC) in the ECGEA cohort into three groups according to the average methylation level of 50 optimal DNA methylation markers in the ESCC-cfMeth score. b. The proportions of molecular subtypes of ESCC in the methylation-dominate (n = 69), methylation-moderate (n = 54), and methylation-poor groups (n = 32). c The cell components in the tumor microenvironment were compared between the methylation-dominate group (n = 69) and the methylation-moderate/poor groups (n = 86) by a two-sided t test (p = 6.6 × 10-3, 0.04, 0.01, 0.04, and 0.04 for epithelial cells, CD4 + T cells, CD8 + T cells, B cells, and dendritic cells, respectively). Data are presented as median values with maximums and minimums. d The pathways were enriched in the methylation-dominate group and the methylation-poor group. CNV copy number variant, COCA cluster of cluster assignments, CIMP CpG island methylator phenotype, Meth-cluster methylation cluster, DMR differentially methylated region, hypo hypomethylation, hyper hypermethylation, CCA cell cycle pathway activation, IM immune modulation, IS immune suppression, NRFA NRF2 oncogenic activation, DC dendritic cell. Source data are provided as a Source Data file.

Similar articles

Cited by

References

    1. Sung H, et al. Global cancer statistics 2020: GLOBOCAN estimates of incidence and mortality worldwide for 36 cancers in 185 countries. CA Cancer J. Clin. 2021;71:209–249. doi: 10.3322/caac.21660. - DOI - PubMed
    1. Arnold M, Soerjomataram I, Ferlay J, Forman D. Global incidence of oesophageal cancer by histological subtype in 2012. Gut. 2015;64:381–387. doi: 10.1136/gutjnl-2014-308124. - DOI - PubMed
    1. An L, et al. The survival of esophageal cancer by subtype in China with comparison to the United States. Int. J. Cancer. 2023;152:151–161. doi: 10.1002/ijc.34232. - DOI - PubMed
    1. Abnet CC, Arnold M, Wei WQ. Epidemiology of esophageal squamous cell carcinoma. Gastroenterology. 2018;154:360–373. doi: 10.1053/j.gastro.2017.08.023. - DOI - PMC - PubMed
    1. Oda I, et al. Long-term outcome of endoscopic resection for intramucosal esophageal squamous cell cancer: a secondary analysis of the Japan Esophageal Cohort study. Endoscopy. 2020;52:967–975. doi: 10.1055/a-1185-9329. - DOI - PubMed

Publication types

MeSH terms