. 2024 May 2;15(1):3726.
doi: 10.1038/s41467-024-48065-y.

High-resolution impact-based early warning system for riverine flooding

Affiliations

High-resolution impact-based early warning system for riverine flooding

Husain Najafi et al. Nat Commun. .

Abstract

Despite considerable advances in flood forecasting during recent decades, state-of-the-art, operational flood early warning systems (FEWS) need to be equipped with near-real-time inundation and impact forecasts and their associated uncertainties. High-resolution, impact-based flood forecasts provide insightful information for better-informed decisions and tailored emergency actions. Valuable information can now be provided to local authorities for risk-based decision-making by utilising high-resolution lead-time maps and potential impacts to buildings and infrastructures. Here, we demonstrate a comprehensive floodplain inundation hindcast of the 2021 European Summer Flood illustrating these possibilities for better disaster preparedness, offering a 17-hour lead time for informed and advisable actions.


Conflict of interest statement

The authors declare no competing interests.

Figures

Fig. 1
Fig. 1. A holistic end-to-end impact-based flood forecasting modelling chain.
The state-of-the-art flood early warning system is extended with components of quasi-real-time hydrodynamic and impact forecasting. Observational initial conditions are obtained based on data from ground, radar, satellite, and reanalysis. The Technology Readiness Level (TRL) serves as a scale for evaluating the developmental stage and maturity of a technology. At TRL 1, the technology is in the initial scientific research phase, while TRL 9 signifies that the system has been successfully demonstrated in a real-world operational environment. Data sources: OSM rivers, roads and buildings: OpenStreetMap contributors 2021, distributed under the Open Data Commons Open Database License (ODbL) v1.0. National German boundary: GADM. Meteorological stations (Deutscher Wetterdienst).
Fig. 2
Fig. 2. Ensemble predictions of precipitation and water levels from the ICON_D2_EPS-mHM chain.
Ensemble predictions initialised every 3-h before the reconstructed flood peak at Altenahr gauge. The probabilities of exceeding the 50-year (HQ50) and 100-year (HQ100) flood thresholds are displayed for 16 forecast initialisations (See Supplementary Fig. S1 for more details). The range of 48-h areal precipitation forecasts for the Ahr basin is shown as whisker plots for each initialisation from ICON_D2_EPS. The whisker plots of precipitation forecast for each initialisation represent the minima, maxima, the bounds of the box (25 and 75 percentiles) and the centre (median) based on 20 ensemble members. The uncertainty of quantitative precipitation estimation for the event is shown for the target period of 07/14 07:00 to 07/14 21:00 CET.
Fig. 3
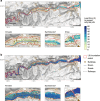
Fig. 3. The maximum flood lead-time warning based on the ICON_D2_EPS-mHM-RIM2D FEWS chain.
A maximum lead-time raster-based flood warning map is a geospatial representation that highlights the maximum available time for flood preparedness and response. The lead time is calculated downstream Altenahr gauge based on water levels (WL) exceeding HQ100. a The lead-time map derived from 16 ensemble median water levels (i.e., median over 20 members for each NWP initialisation). b The same but obtained with 16 maximum water levels. These lead-time maps are obtained when three consecutive initialisations exceed the HQ100 for a given 10 m grid cell. Please refer to the “Forecast persistency” section in the “Methods” section for additional details. The red extent delineates the inundation area mapped by the LfU of Rhineland-Palatinate. Supplementary data sources: OSM river, roads and buildings: OpenStreetMap contributors 2021 distributed under the Open Data Commons Open Database License (ODbL) v1.0. Hillshade: DTM v0.3 (CC BY).
Fig. 4
Fig. 4. Uncertainty representation of the forecasted inundated area downstream of the Altenahr gauge.
Uncertainty is quantified based on 16 initialisations issued 47 h to 2 h prior to the 2021 European Summer Flood. The uncertainty of the atmospheric forecast based on 20 ensemble members (n = 20) is propagated through the modelling chain to the hydrological and inundation prediction. The whisker plots of inundation prediction for each initialisation represent the minima, maxima, the bounds of the box (25 and 75 percentiles) and the centre (median) based on this ensemble. HQextreme represents the hazard map for the most extreme flood derived with a multiplication factor of a 100-year flood (HQ100).

References

    1. United Nations Office for Disaster Risk Reduction and Centre for Research on the Epidemiology of Disasters. Economic Losses, Poverty & Disasters (1998–2017). Tech. Rep., UNISDR & CRED https://www.cred.be/unisdr-and-cred-report-economic-losses-poverty-disas... (2018).
    1. Intergovernmental Panel on Climate Change. Factsheet: People and Oceans. Tech. Rep., IPCC https://www.ipcc.ch/report/ar6/wg1/downloads/factsheets/IPCC_AR6_WGI_Reg... (2021).
    1. Rentschler J, Salhab M, Jafino BA. Flood exposure and poverty in 188 countries. Nat. Commun. 2022;13:3527. doi: 10.1038/s41467-022-30727-4. - DOI - PMC - PubMed
    1. Merz B, et al. Causes, impacts and patterns of disastrous river floods. Nat. Rev. Earth Environ. 2021;2:592–609. doi: 10.1038/s43017-021-00195-3. - DOI
    1. Lahsen M, Ribot J. Politics of attributing extreme events and disasters to climate change. Wiley Interdiscip. Rev. Clim. Chang. 2022;13:e750. doi: 10.1002/wcc.750. - DOI