. 2024 May 2;10(1):95.
doi: 10.1038/s41531-024-00712-3.

Progression subtypes in Parkinson's disease identified by a data-driven multi cohort analysis

Affiliations

Progression subtypes in Parkinson's disease identified by a data-driven multi cohort analysis

Tom Hähnel et al. NPJ Parkinsons Dis. .

Abstract

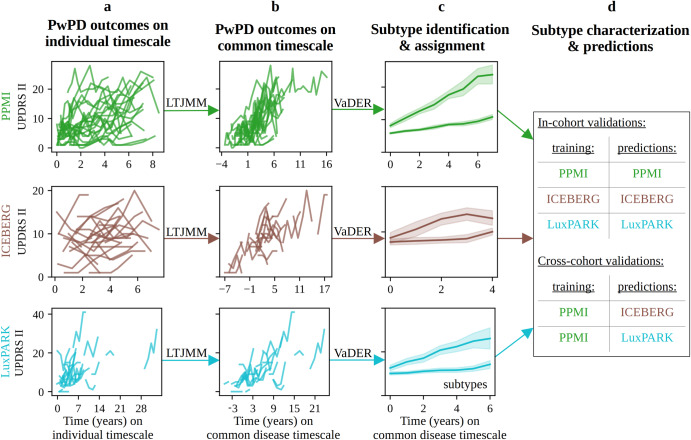
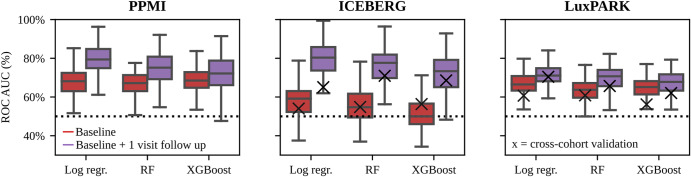
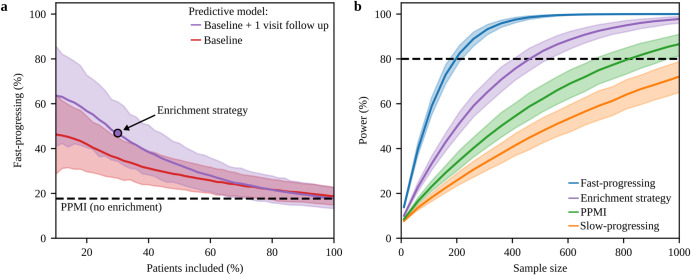
The progression of Parkinson's disease (PD) is heterogeneous across patients, affecting counseling and inflating the number of patients needed to test potential neuroprotective treatments. Moreover, disease subtypes might require different therapies. This work uses a data-driven approach to investigate how observed heterogeneity in PD can be explained by the existence of distinct PD progression subtypes. To derive stable PD progression subtypes in an unbiased manner, we analyzed multimodal longitudinal data from three large PD cohorts and performed extensive cross-cohort validation. A latent time joint mixed-effects model (LTJMM) was used to align patients on a common disease timescale. Progression subtypes were identified by variational deep embedding with recurrence (VaDER). In each cohort, we identified a fast-progressing and a slow-progressing subtype, reflected by different patterns of motor and non-motor symptoms progression, survival rates, treatment response, features extracted from DaTSCAN imaging and digital gait assessments, education, and Alzheimer's disease pathology. Progression subtypes could be predicted with ROC-AUC up to 0.79 for individual patients when a one-year observation period was used for model training. Simulations demonstrated that enriching clinical trials with fast-progressing patients based on these predictions can reduce the required cohort size by 43%. Our results show that heterogeneity in PD can be explained by two distinct subtypes of PD progression that are stable across cohorts. These subtypes align with the brain-first vs. body-first concept, which potentially provides a biological explanation for subtype differences. Our predictive models will enable clinical trials with significantly lower sample sizes by enriching fast-progressing patients.


Conflict of interest statement

The authors declare no competing interests.

Figures

Fig. 1
Fig. 1. Model training and validation procedure for subtype identification and predictions.
Individual PwPD outcomes (a) were aligned on a common timescale (b) using a latent time joint mixed-effects model (LTJMM). The UPDRS II values of 25 randomly sampled PwPD are shown for visualization. Subsequently, two distinct progression subtypes were identified (c) using a variational deep embedding with recurrence (VaDER). Subtypes were further characterized and models were trained to predict subtype associations from baseline (d). VaDER and predictive models were trained and evaluated on each cohort separately and results were compared across cohorts (in-cohort validation). Additionally, PPMI-trained models were applied to ICEBERG and LuxPARK and results were compared with results of the in-cohort approach (cross-cohort validation). UPDRS Unified Parkinson’s Disease Rating Scale.
Fig. 2
Fig. 2. Disease progression and baseline characteristics of subtypes.
a Progression of motor scores (UPDRS II/III/IV, PIGD) and non-motor scores (UPDRS I, MoCA, SCOPA) for the slow-progressing subtype (orange) and fast-progressing subtype (blue) for PPMI, ICEBERG, and LuxPARK. Mean and 95% confidence intervals for each subtype are shown. ICEBERG data is shown up to four years as only a few ICEBERG PwPD had longer follow up. b Standardized mean differences (SMD) of progression speed between both subtypes for different symptom domains (orange: cognition, green: motor, yellow: psychiatric, gray: other). Negative SMD values indicate that the fast-progressing subtype shows a faster progression. c Average regression coefficients showing associations of symptom domains at baseline with subtypes. Negative values indicate that more severe symptoms at baseline are associated with the faster subtype. 95% confidence intervals are shown and were corrected for multiple testing. MoCA Montreal Cognitive Assessment, PIGD Postural Instability and Gait Dysfunction score, SCOPA Scales for Outcomes in Parkinson’s Disease-Autonomic Dysfunction, RBD REM behavior sleep disorder, UPDRS Unified Parkinson’s Disease Rating Scale.
Fig. 3
Fig. 3. Mortality, treatment response and biomarker differences between subtypes.
a Kaplan-Meier estimator for survival probability on the common disease timescale for fast-progressing (blue) and slow-progressing (orange) PwPD in LuxPARK. Censored observations are indicated by small vertical ticks. The corresponding p-value for the subtype covariate from the cox proportional hazard model is reported. 95% confidence intervals are shown. b Mean UPDRS III improvement of PwPD in PPMI after dopaminergic drug intake compared to OFF state. c Progression of DaTSCAN uptake loss for fast-progressing and slow-progressing progressing PwPD. d DaTSCAN asymmetry index at baseline for slow-progressing and fast-progressing PwPD. e Correlation of gait speed with disease duration on the common timescale for fast-progressing (blue) and slow-progressing (orange) PwPD. Only the most significant digital gait parameter is shown here while correlations of all gait parameters are presented in the supplement. The corresponding p-value from the ANCOVA analysis is shown and was corrected for multiple testing of all digital gait parameters. 95% confidence intervals are shown. The boxplots are displayed with a median line, box borders representing the interquartile range (IQR), whiskers extending to 1.5 times the IQR, and outliers depicted as diamonds beyond the whiskers. Abbreviations: UPDRS: Unified Parkinson’s Disease Rating Scale.
Fig. 4
Fig. 4. Evaluation of subtype predictions using different machine learning models.
Subtypes of individual PwPD were predicted from baseline data (red) or baseline data with one follow-up visit (purple) using three different predictive models (Logistic Regression, Random Forest, XGBoost). Models were trained using repeated nested cross-fold validation. ROC-AUC of the subtype predictions is shown for PPMI, ICEBERG, and LuxPARK. Additionally, cross-cohort validation was performed using the PPMI-trained model for ICEBERG and LuxPARK predictions (black cross for ICEBERG and LuxPARK figures). The boxplots are displayed with a median line, box borders representing the interquartile range (IQR), whiskers extending to 1.5 times the IQR, and outliers depicted as diamonds beyond the whiskers. Log Regr Logistic Regression, RF Random Forrest, ROC-AUC receiver operating characteristics-area under the curve, XGBoost eXtreme Gradient Boosting.
Fig. 5
Fig. 5. Subtype enrichment for sample size reduction in clinical trials.
a Probabilities for PwPD in PPMI of belonging to the fast-progressing subtype predicted from baseline (red) and baseline with one follow-up visit (purple) were calculated using the logistic regression model. The figure depicts the percentage of fast-progressing PwPD and the number of PwPD which would be still eligible for study inclusion depending on the threshold applied to the predicted probabilities. The black dashed line indicates the percentage of fast-progressing PwPD observed in the complete PPMI cohort. When using the predictions from baseline + 1 visit follow-up data, 47% enrichment can be achieved with still 30% of PwPD being eligible for study inclusion (purple circle). b Estimated power and sample sizes required for a clinical trial depending on the percentage of fast-progressing PwPD, assuming the same treatment effect on disease progression for both subtypes: a theoretical cohort of only fast-progressing PwPD (blue), enrichment strategy presented in A (purple), default PPMI cohort without enrichment (green), the theoretical cohort of only slow-progressing PwPD (orange). A treatment effect of 30% on the progression rate of UPDRS I-III, one-year observation period and significance level α = 0.1 were assumed. The dashed black line indicates 80% power. 95% confidence intervals are shown for both sub-figures.

References

    1. Feigin VL, et al. Global, regional, and national burden of neurological disorders during 1990–2015: a systematic analysis for the Global Burden of Disease Study 2015. Lancet Neurol. 2017;16:877–897. doi: 10.1016/S1474-4422(17)30299-5. - DOI - PMC - PubMed
    1. Kieburtz K, et al. Effect of Creatine monohydrate on clinical progression in patients with Parkinson Disease: A randomized clinical trial. JAMA. 2015;313:584. doi: 10.1001/jama.2015.120. - DOI - PMC - PubMed
    1. Lang AE, et al. Trial of Cinpanemab in early Parkinson’s disease. N. Engl. J. Med. 2022;387:408–420. doi: 10.1056/NEJMoa2203395. - DOI - PubMed
    1. Pagano G, et al. Trial of Prasinezumab in early-stage Parkinson’s disease. N. Engl. J. Med. 2022;387:421–432. doi: 10.1056/NEJMoa2202867. - DOI - PubMed
    1. The Parkinson Study Group SURE-PD3 Investigators et al. Effect of urate-elevating Inosine on early Parkinson disease progression: The SURE-PD3 randomized clinical trial. JAMA. 2021;326:926. doi: 10.1001/jama.2021.10207. - DOI - PMC - PubMed