. 2024 May 2;15(1):3715.
doi: 10.1038/s41467-024-48172-w.

Globally occurring pelagiphage infections create ribosome-deprived cells

Affiliations

Globally occurring pelagiphage infections create ribosome-deprived cells

Jan D Brüwer et al. Nat Commun. .

Abstract

Phages play an essential role in controlling bacterial populations. Those infecting Pelagibacterales (SAR11), the dominant bacteria in surface oceans, have been studied in silico and by cultivation attempts. However, little is known about the quantity of phage-infected cells in the environment. Using fluorescence in situ hybridization techniques, we here show pelagiphage-infected SAR11 cells across multiple global ecosystems and present evidence for tight community control of pelagiphages on the SAR11 hosts in a case study. Up to 19% of SAR11 cells were phage-infected during a phytoplankton bloom, coinciding with a ~90% reduction in SAR11 cell abundance within 5 days. Frequently, a fraction of the infected SAR11 cells were devoid of detectable ribosomes, which appear to be a yet undescribed possible stage during pelagiphage infection. We dubbed such cells zombies and propose, among other possible explanations, a mechanism in which ribosomal RNA is used as a resource for the synthesis of new phage genomes. On a global scale, we detected phage-infected SAR11 and zombie cells in the Atlantic, Pacific, and Southern Oceans. Our findings illuminate the important impact of pelagiphages on SAR11 populations and unveil the presence of ribosome-deprived zombie cells as part of the infection cycle.


Conflict of interest statement

The authors declare no competing interests.

Figures

Fig. 1
Fig. 1. Infection cycle of HTCC1062 infected with HTVC027P and HTVC031P and example epifluorescence microscopy images.
Bargraphs show triplicate samples during the infection cycle. “p.i.” stands for post infection. The negative control was uninfected. Abundance of 100% corresponds to total cell counts of DAPI-stained cells. Example microscopy images on the right display DAPI (DNA; cyan), FISH for 16S rRNA (yellow), and phage genes via direct-geneFISH (magenta). Outlines were drawn manually. Images were recorded using SR-SIM on a ZEISS LSM780 equipped with ELYRA PS.1 and analyzed using the ZEN software. Scale bar: 0.5 µm.
Fig. 2
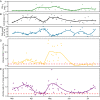
Fig. 2. SAR11 and phage population dynamics during 2020 phytoplankton spring blooms at Helgoland Roads.
A Chlorophyll a concentration, as a proxy for phytoplankton bloom development, B SAR11 cell division rate, and C SAR11 cell count data has previously been presented in ref. . D Proportion of phage-infected SAR11 cells (yellow; relative to SAR11 cell counts) as raw values per day. Loess smoothing is displayed as line plots. E Zombie cells (purple; relative to total DAPI-stained cell counts) are plotted as raw values per day. Loess smoothing is displayed as line plots. The average negative control over all samples is shown as a red-dashed line.
Fig. 3
Fig. 3. Bioinformatic abundance estimates of SAR11 during phytoplankton spring bloom.
A metagenome assembled genomes (MAG) and B 16S rRNA gene sequences classified as Pelagibacterales. All data originated from PacBio Sequel II metagenomes from the 0.2 to 3 µm fraction. RPKM is Reads per Kilobase per Million Mapped reads. N = 1 biological sample per data point.
Fig. 4
Fig. 4. Global distribution of SAR11, phage-infected SAR11, and zombie cells.
Map with sampling locations during different cruises and long-term ecological research station Helgoland Roads. Relative abundance of SAR11 (left y-axis), phage-infected SAR11(right y-axis), and zombie cells (right y-axis) from the Atlantic, Southern Ocean, and Pacific with respective cruises in brackets. Raw data is displayed as individual points and areas represent loess smoothing for the Atlantic and Pacific. Subset (boxes) of data from Southern Ocean without smoothing is displayed. Complete data of the Southern Ocean is available in Fig. S4. N = 1 sampled station per shown datapoint.

References

    1. Giovannoni SJ. SAR11 bacteria: the most abundant plankton in the oceans. Annu. Rev. Mar. Sci. 2017;9:231–255. doi: 10.1146/annurev-marine-010814-015934. - DOI - PubMed
    1. Suttle CA. Marine viruses—major players in the global ecosystem. Nat. Rev. Microbiol. 2007;5:801–812. doi: 10.1038/nrmicro1750. - DOI - PubMed
    1. Martinez-Hernandez F, et al. Single-cell genomics uncover Pelagibacter as the putative host of the extremely abundant uncultured 37-F6 viral population in the ocean. ISME J. 2019;13:232–236. doi: 10.1038/s41396-018-0278-7. - DOI - PMC - PubMed
    1. Zhao Y, et al. Pelagiphages in the Podoviridae family integrate into host genomes. Environ. Microbiol. 2019;21:1989–2001. doi: 10.1111/1462-2920.14487. - DOI - PubMed
    1. Zhao Y, et al. Abundant SAR11 viruses in the ocean. Nature. 2013;494:357–360. doi: 10.1038/nature11921. - DOI - PubMed

Publication types