. 2024 Aug;31(8):1013-1028.
doi: 10.1038/s41418-024-01302-9. Epub 2024 May 2.

H3K27me3 timely dictates uterine epithelial transcriptome remodeling and thus transformation essential for normal embryo implantation

Affiliations

H3K27me3 timely dictates uterine epithelial transcriptome remodeling and thus transformation essential for normal embryo implantation

Na Deng et al. Cell Death Differ. 2024 Aug.

Abstract

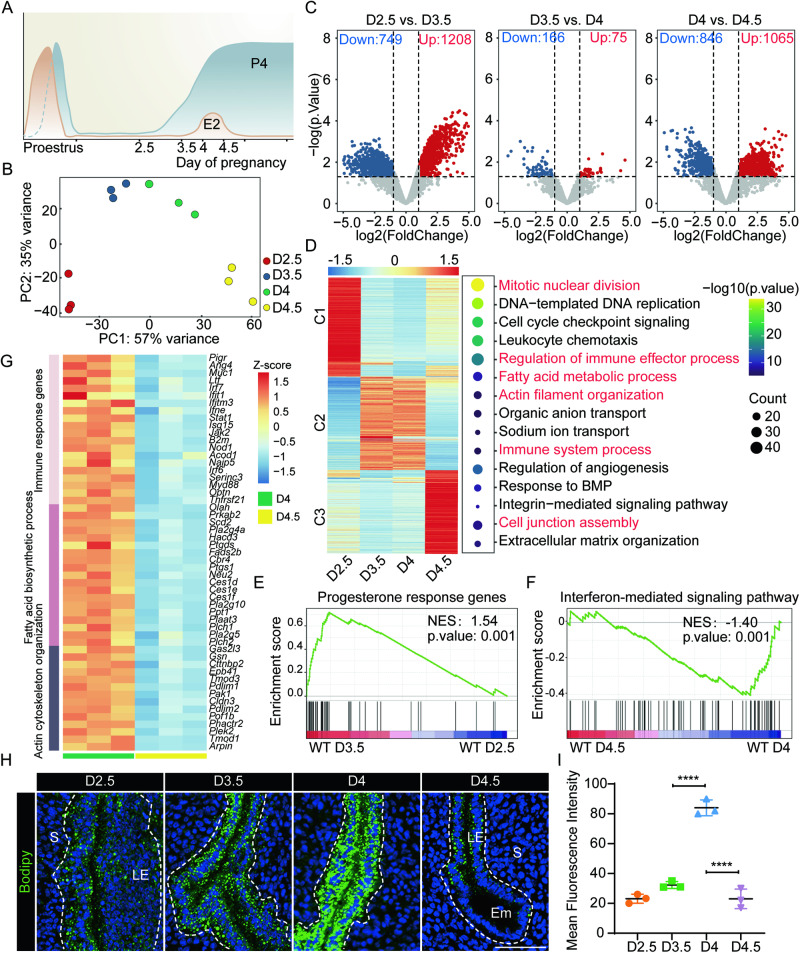
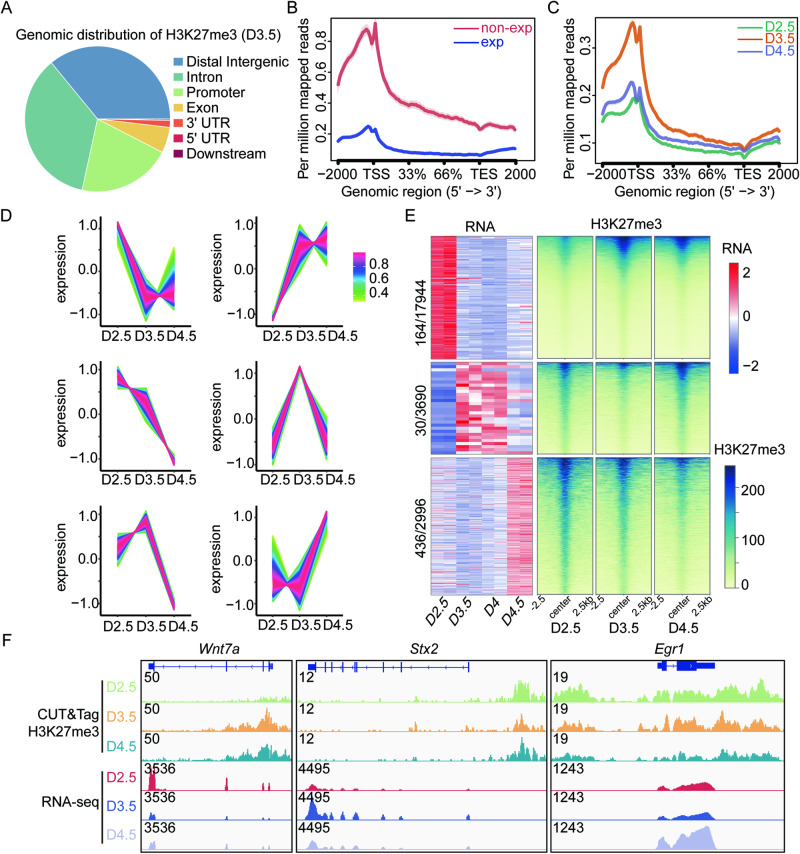
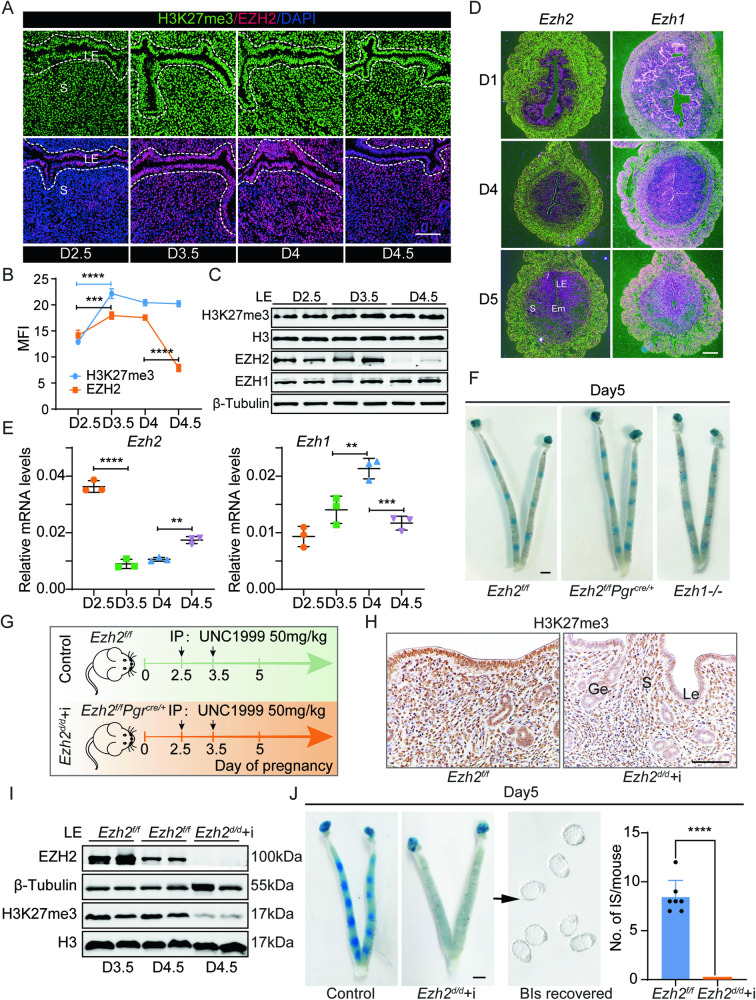
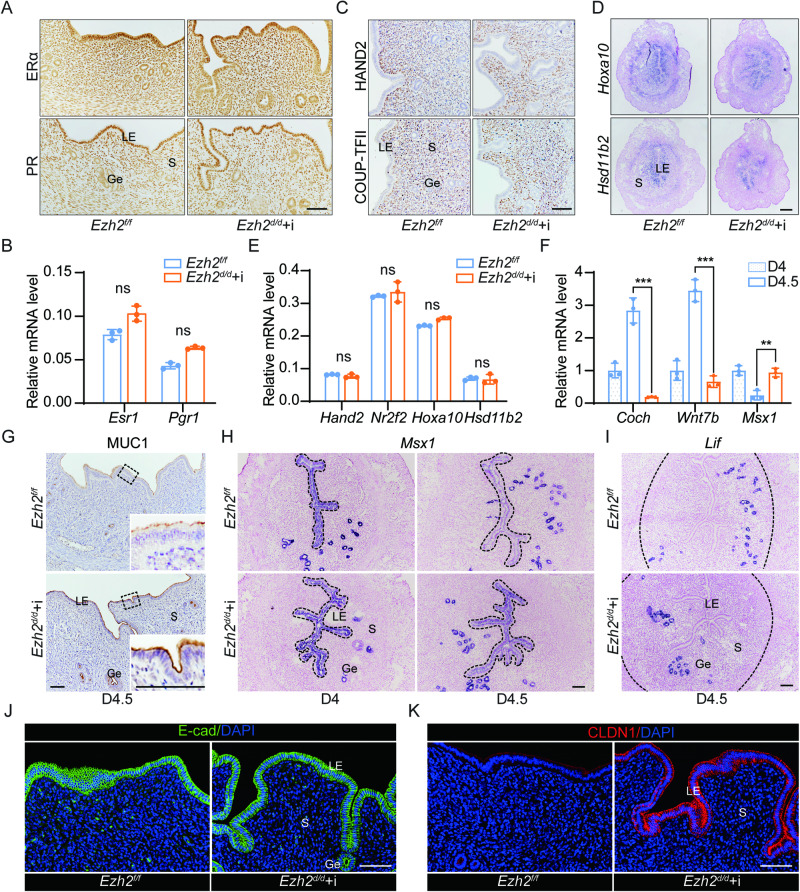
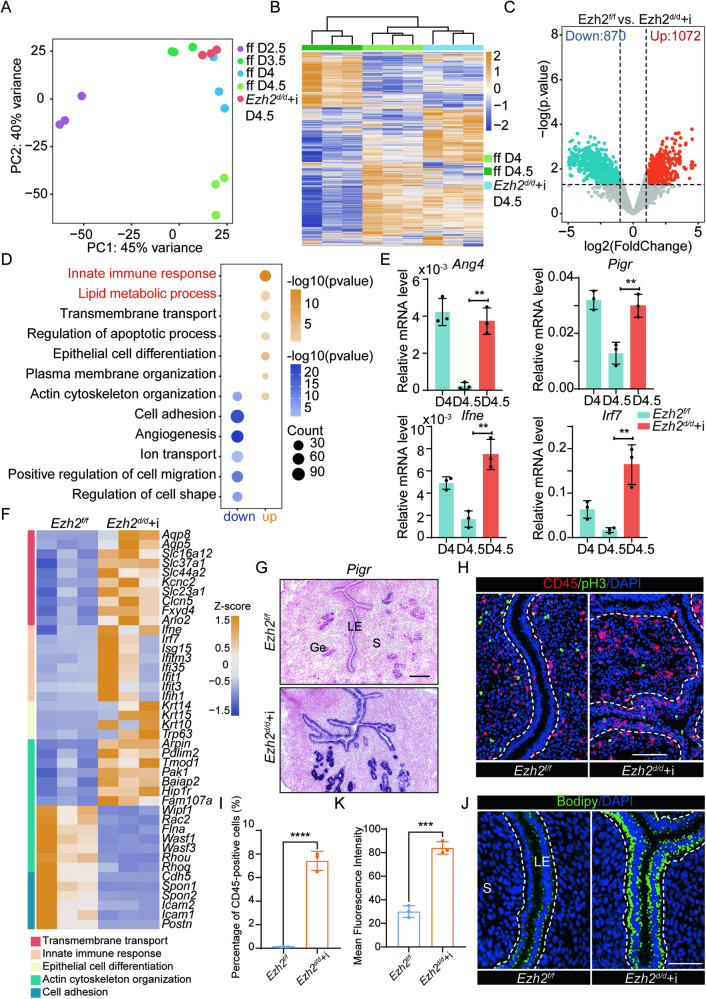
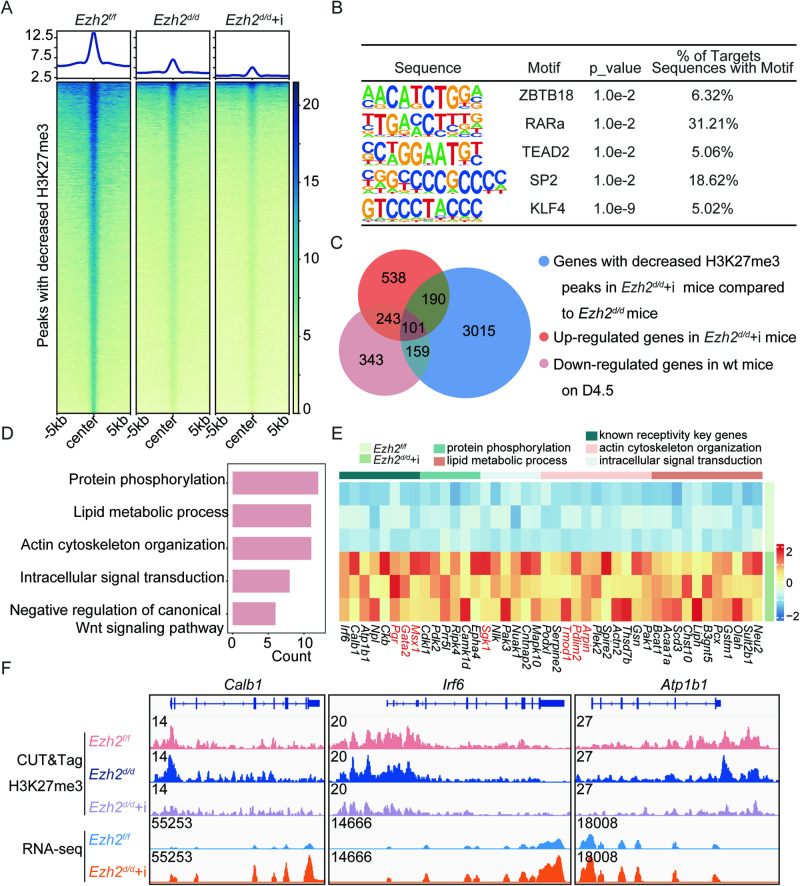
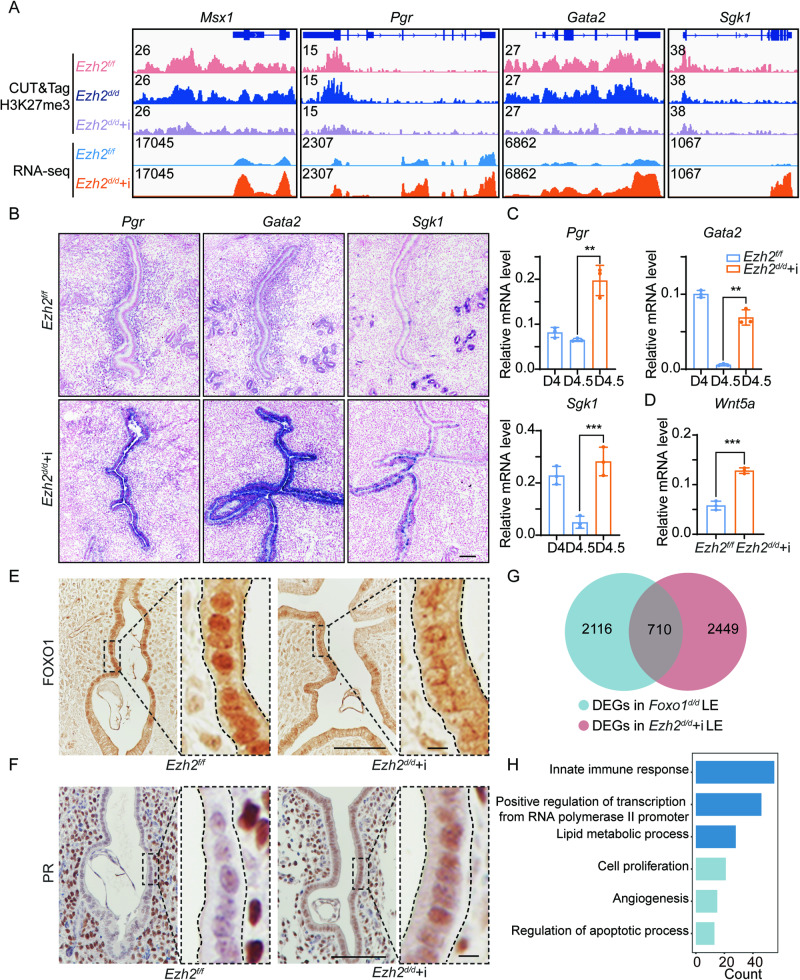
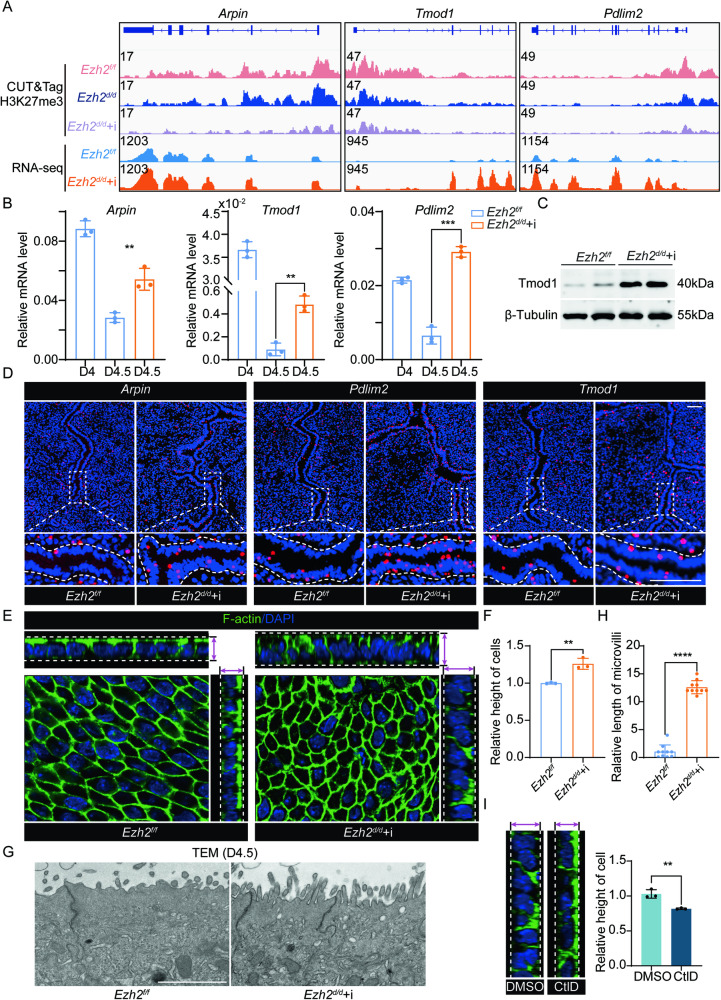
Uterine luminal epithelia (LE), the first layer contacting with the blastocyst, acquire receptivity for normal embryo implantation. Besides the well-accepted transcriptional regulation dominated by ovarian estrogen and progesterone for receptivity establishment, the involvement of epigenetic mechanisms remains elusive. This study systematically profiles the transcriptome and genome-wide H3K27me3 distribution in the LE throughout the preimplantation. Combining genetic and pharmacological approaches targeting the PRC2 core enzyme Ezh1/2, we demonstrate that the defective remodeling of H3K27me3 in the preimplantation stage disrupts the differentiation of LE, and derails uterine receptivity, resulting in implantation failure. Specifically, crucial epithelial genes, Pgr, Gata2, and Sgk1, are transcriptionally silenced through de novo deposition of H3K27me3 for LE transformation, and their sustained expression in the absence of H3K27me3 synergistically confines the nuclear translocation of FOXO1. Further functional studies identify several actin-associated genes, including Arpin, Tmod1, and Pdlim2, as novel direct targets of H3K27me3. Their aberrantly elevated expression impedes the morphological remodeling of LE, a hindrance alleviated by treatment with cytochalasin D which depolymerizes F-actin. Collectively, this study uncovers a previously unappreciated epigenetic regulatory mechanism for the transcriptional silencing of key LE genes via H3K27me3, essential for LE differentiation and thus embryo implantation.


Conflict of interest statement

The authors declare no competing interests.

Figures

Fig. 1
Fig. 1. The dynamic transcriptomic landscape of luminal epithelia in preimplantation uteri.
A Schematic diagram illustrating mouse preimplantation ovarian hormone fluctuations. E2: estrogen, P4: progesterone. B PCA plot illustrating variations among wildtype LE samples on D2.5, 3.5, 4, and 4.5. PC principal component. C Volcano plots showing the DEGs in wildtype LE samples between adjacent samples, analyzed using the exact negative binomial test in the edgeR package of R. D K-means clustering and GO enrichment analysis of DEGs in wildtype LE throughout the preimplantation period. E GSEA analysis indicating the enrichment of progesterone response genes in wildtype LE on D3.5 compared to D2.5. The progesterone response gene set was defined in reference to publicly available data. NES normalized enrichment score. F GSEA analysis illustrating the enrichment of interferon-mediated signaling pathway-related genes in wildtype LE on D4.5 compared to D4. G Heatmap of DEGs associated with specific physiological functions in wildtype LE on D4 and D4.5. H BODIPY fluorescent staining of lipid droplets in uteri on D2.5, 3.5, 4, and 4.5. LE, luminal epithelium. S stroma, Ge gland epithelium, Em Embryo. Scale bar: 50 μm. I Quantitative analysis of BODIPY staining fluorescence intensity. Mean Fluorescence Intensity was measured by imageJ software. Data represent the mean ± SD (n = 3). ****P < 0.0001, one-way ANOVA followed by Tukey’s multiple comparisons test was performed.
Fig. 2
Fig. 2. H3K27me3 dynamics for transcriptional silencing of luminal epithelial genes.
A Genomic distribution of H3K27me3 peaks in wildtype LE on D3.5. B Profile plot of H3K27me3 CUT&Tag signals at genomic loci in wildtype LE on D3.5. TSS transcriptional start site, TES transcriptional end site, exp expressed gene, non-exp non-expressed genes. C Profile plot of H3K27me3 CUT&Tag signals at genomic loci in the LE on D2.5, 3.5, and 4.5. D Clustering analysis of H3K27me3 peaks in the LE from D2.5 to D4.5. E Heatmap depicting the transcriptional and H3K27me3 CUT&Tag signals of 630 out of 1679 DEGs. F Genome browser view of normalized H3K27me3 CUT&Tag signals and RNA-seq signals for representative genes in wildtype LE on D2.5, 3.5, and 4.5.
Fig. 3
Fig. 3. Uterine-specific ablation of H3K27me3 resulted in embryo implantation failure.
A Immunofluorescence analysis of H3K27me3 and EZH2 in wildtype LE on D2.5, 3.5, 4, and 4.5, respectively. Scale bar: 100 μm. Data represent the mean ± SD (n = 3). ****P < 0.0001, ***P = 0.001, one-way ANOVA followed by Tukey’s multiple comparisons test was performed. B Quantitative analysis of fluorescence intensity in panel A. MFI: Mean Fluorescence Intensity was measured by imageJ software. Data represent the mean ± SD (n = 3). C Western blot analysis of H3K27me3, EZH2, and EZH1 in wildtype LE on D2.5, 3.5, and 4.5. H3 and β-Tubulin served as loading controls for nuclear and cytoplasmic proteins, respectively. D In situ hybridization of Ezh2 and Ezh1 in uteri on D1, 4, and 5. Scale bar: 100 μm. E qRT-PCR analysis of Ezh2 and Ezh1 in wildtype LE on D2.5, 3.5, 4, and 4.5. The values were normalized to Gapdh. Data represent the mean ± SD (n = 3). ****P < 0.0001, **P = 0.0023 (Ezh2), **P = 0.0059 (Ezh1), ***P = 0.001 (Ezh1), one-way ANOVA followed by Tukey’s multiple comparisons test was performed. F Implantation sites of Ezh2f/f, Ezh2f/f Pgrcre/+, and Ezh1-/- mice on D5 were visualized by intravenous injection of blue dye. Scale bar: 2 mm. G Schematic diagram illustrating the strategy for the mouse model. In the experimental group (Ezh2d/d + i), after mating, Ezh2f/fPgrcre/+ mice received intraperitoneal injections of UNC1999 (50 mg/kg) on the evenings of D2 and D3. Simultaneously, Ezh2f/f mice were administrated in the same manner to serve as a control. H Immunohistochemistry staining of H3K27me3 in Ezh2f/f and Ezh2d/d + i uteri on D4.5. Scale bar: 100 μm. I Western blot analysis of EZH2 and H3K27me3 in Ezh2f/f and Ezh2d/d + i LE on D3.5 and 4.5. H3 and β-Tubulin served as loading controls. J The implantation status of Ezh2f/f and Ezh2d/d + i mice on D5 (left image) and the un-implanted embryos were recovered from Ezh2d/d + i uteri (middle image). Scale bar: 2 mm. The histogram (right image) displaying the average number of implantation sites in control (n = 7 animals) and Ezh2d/d + i (n = 8 animals) mice on D5. Data represent the mean ± SD. ****P < 0.0001, unpaired Student’s t test was performed.
Fig. 4
Fig. 4. The deficiency of H3K27me3 led to aberrant expressions of uterine receptivity-related genes.
A Immunohistochemistry staining of ERα and PR in Ezh2f/f and Ezh2d/d + i uteri on D4. Scale bar: 100 μm. B qRT-PCR analysis of Esr1 and Pgr mRNA levels in Ezh2f/f and Ezh2d/d + i uteri on D4. The values were normalized to Gapdh. Data represent the mean ± SD (n = 3). ns not significant. C Immunohistochemistry staining of HAND2 and COUP-TFII in Ezh2f/f and Ezh2d/d + i uteri on D4. Scale bar: 100 μm. D In situ hybridization of Hoxa10 and Hsd11b2 in Ezh2f/f and Ezh2d/d + i uteri on D4. Scale bar: 100 μm. E qRT-PCR analysis of Hand2, Nr2f2, Hoxa10 and Hsd11b2 mRNA levels in Ezh2f/f and Ezh2d/d + i uteri on D4. The values were normalized to Gapdh. Data represent the mean ± SD (n = 3). ns not significant. F qRT-PCR analysis of Coch, Wnt7b and Msx1 mRNA levels in Ezh2f/f and Ezh2d/d + i uteri on D4 and 4.5. The values were normalized to Gapdh. Data represent the mean ± SD (n = 3). ***P = 0.0003 (Coch), ***P = 0.0003 (Wnt7b), **P = 0.0035 (Msx1). G Immunohistochemistry staining of MUC1 in Ezh2f/f and Ezh2d/d + i uteri on D4.5. Scale bar: 100 μm. H, I In situ hybridization of Msx1 H and Lif I in Ezh2f/f and Ezh2d/d + i uteri on D4 and 4.5. Scale bar: 100 μm. J, K Immunofluorescence analysis of E-cad (J) and CLDN1 (K) in Ezh2f/f and Ezh2d/d + i uteri on D4.5. Scale bar: 100 μm. Statistical significance was tested using unpaired Student’s t test (B, E, F).
Fig. 5
Fig. 5. Luminal epithelial differentiation paused from D4 to D4.5 in the absence of H3K27me3.
A PCA plot of wildtype LE samples on D2.5, 3.5, 4, and 4.5 as well as Ezh2d/d + i LE on D4.5. PC, principal component. B Heatmap of transcriptome data in wildtype LE on D4 and 4.5, along with Ezh2d/d + i LE on D4.5. C Volcano plot depicting the DEGs between Ezh2f/f and Ezh2d/d + i LE on D4.5. D GO enrichment analysis for DEGs between Ezh2f/f and Ezh2d/d + i LE on D4.5 using DAVID by Kappa Statistics (P < 0.05). E qRT-PCR analysis of Ang4, Pigr, Ifne and Irf7 mRNA levels in Ezh2f/f LE on D4 and 4.5 as well as Ezh2d/d + i LE on D4.5. The values were normalized to Gapdh. **P = 0.0012 (Ang4), **P = 0.0066 (Pigr), **P = 0.0029 (Ifne), **P = 0.0048 (Irf7). F Heatmap of DEGs associated with specific physiological functions in LE between Ezh2f/f and Ezh2d/d + i LE on D4.5. G In situ hybridization of Pigr in Ezh2f/f and Ezh2d/d + i uteri on D4.5. Scale bar: 100 μm. H Co-immunofluorescence analysis of CD45 and phospho-histone H3 (p-H3) in Ezh2f/f and Ezh2d/d + i uteri on D4.5. Scale bar: 50 μm. I Quantitative analysis of percentage of CD45 positive cell in luminal epithelial layer (indicated by white dotted line) in panel H. ****P < 0.0001. J BODIPY fluorescent staining in Ezh2f/f and Ezh2d/d + i uteri on D4.5. The luminal epithelial tissue was delineated by the white dashed lines (H, J). Scale bar: 50 μm. K Quantitative analysis of BODIPY staining fluorescence intensity in panel J. Mean Fluorescence Intensity was measured by imageJ software. ***P = 0.0002. Data represent the mean ± SD (n = 3). Statistical significance was tested using unpaired Student’s t test (E, I, K).
Fig. 6
Fig. 6. A set of luminal epithelial candidate genes was modulated by H3K27me3.
A Heatmap illustrated 4,116 decreased H3K27me3 peaks meeting dual criteria: reduced peaks in the Ezh2d/d + i group compared to the Ezh2f/f group and decreased peaks in the Ezh2d/d + i group compared to the Ezh2d/d group. B HOMER motif analysis of 4116 decreased H3K27me3 peaks in the Ezh2d/d + i LE. C Venn diagram displaying the intersection of genes exhibiting reduced H3K27me3 modification (n = 3465) and transcriptional upregulation (n = 1072) in Ezh2d/d + i LE, as well as genes down-regulation in wildtype LE from D4 to D4.5 (n = 846). D GO enrichment analysis of 101 H3K27me3 target genes using DAVID with Kappa Statistics (P < 0.05). E Heatmap depicting representative H3K27me3 target genes. F Genome browser view of normalized H3K27me3 CUT&Tag signals and RNA-seq tracks for representative genes, Calb1, Irf6, and Atp1b1.
Fig. 7
Fig. 7. H3K27me3 mediated timely transcriptional repression of Pgr, Gata2, and Sgk1, ensuring the nuclear entry of FOXO1.
A Genome browser view of normalized H3K27me3 CUT&Tag signals and RNA-seq tracks for Msx1, Pgr, Gata2, and Sgk1. B In situ hybridization assays of Pgr, Gata2, and Sgk1 in Ezh2f/f and Ezh2d/d + i uteri on D4.5. Scale bar: 100 μm. C, D qRT-PCR analysis of Pgr, Gata2, Sgk1 and Wnt5a mRNA levels in Ezh2f/f LE on D4 and 4.5 as well as Ezh2d/d + i LE on D4.5. The values were normalized to Gapdh. Data represent the mean ± SD (n = 3). **P = 0.0025 (Pgr), **P = 0.0024 (Gata2), ***P = 0.0005 (Sgk1), ***P = 0.0003 (Wnt5a), unpaired Student’s t test was performed. E, F Immunohistochemistry staining of FOXO1 and PR in Ezh2f/f and Ezh2d/d + i uteri on D4.5. Scale bar: 100 μm. The black dashed box indicates the magnified view (right image). Scale bar: 10 μm. The uterine luminal epithelial tissue was outlined by the black dashed curves. G Venn diagram illustrating the intersection of genes in Foxo1 ablation LE and H3K27me3-deficient LE. H GO enrichment analysis for the 710 overlapped genes between Foxo1 ablation and H3K27me3-deficient LE.
Fig. 8
Fig. 8. H3K27me3 repressed F-actin regulators to coordinate morphological remodeling in the LE.
A Genome browser view of normalized H3K27me3 CUT&Tag signals and RNA-seq tracks for Arpin, Tmod1, and Pdlim2. B qRT-PCR analysis of Arpin, Tmod1, and Pdlim2 mRNA levels in Ezh2f/f LE on D4 and 4.5 as well as Ezh2d/d + i LE on D4.5. The values were normalized to Gapdh. Data represent the mean ± SD (n = 3). **P = 0.0053 (Arpin), **P = 0.0016 (Tmod1), ***P = 0.0001 (Pdlim2). C Western blot analysis of TMOD1 in Ezh2f/f and Ezh2d/d + i LE on D4.5. β-Tubulin served as a loading control. D Sm-FISH of Arpin, Tmod1, and Pdlim2 in Ezh2f/f and Ezh2d/d + i LE on D4.5. Scale bars: 100 μm. The images below depicted magnified views of the area enclosed by the white dashed box (down image). E Whole-mount immunofluorescence analysis of phalloidin-labeled F-actin in ex vivo explants of Ezh2f/f and Ezh2d/d + i LE on D4.5. Quantitative analysis of relative height of LE in panel E (F) and relative length of LE microvilli in panel G (H). Data represent the mean ± SD. **P = 0.004 (n = 3), ****P < 0.0001 (n = 10). G Transmission electron microscopy (TEM) analysis of LE apical microvilli in D4.5 Ezh2f/f and Ezh2d/d + i uteri. Scale bar: 2 μm. I Z-stack views of immunofluorescence staining images of phalloidin-labeled F-actin in ex vivo explants of Ezh2d/d + i LE on D4.5 following treatment with Cytochalasin D (CtlD, 1 μM, 15 min) or DMSO. The histogram displaying the relative height of LE in the DMSO and cytochalasin D groups (right image). Data represent the mean ± SD (n = 3). **P = 0.004. Statistical significance was tested using unpaired Student’s t test (B, F, H, I).

Similar articles

Cited by

References

    1. Wang H, Dey SK. Roadmap to embryo implantation: clues from mouse models. Nat Rev Genet. 2006;7:185–99. 10.1038/nrg1808 - DOI - PubMed
    1. Cha J, Sun X, Dey SK. Mechanisms of implantation: strategies for successful pregnancy. Nat Med. 2012;18:1754–67. 10.1038/nm.3012 - DOI - PMC - PubMed
    1. Lejeune B, Van Hoeck J, Leroy F. Transmitter role of the luminal uterine epithelium in the induction of decidualization in rats. J Reprod Fertil. 1981;61:235–40. 10.1530/jrf.0.0610235 - DOI - PubMed
    1. Denker HW. Implantation - a Cell Biological Paradox. J Exp Zool. 1993;266:541–58. 10.1002/jez.1402660606 - DOI - PubMed
    1. Xiao S, Diao H, Zhao F, Li R, He N, Ye X. Differential gene expression profiling of mouse uterine luminal epithelium during periimplantation. Reprod Sci. 2014;21:351–62. 10.1177/1933719113497287 - DOI - PMC - PubMed

MeSH terms

LinkOut - more resources