. 2024 Jun;25(6):1110-1122.
doi: 10.1038/s41590-024-01826-9. Epub 2024 May 2.

Coordinated chemokine expression defines macrophage subsets across tissues

Affiliations

Coordinated chemokine expression defines macrophage subsets across tissues

Xin Li et al. Nat Immunol. 2024 Jun.

Abstract

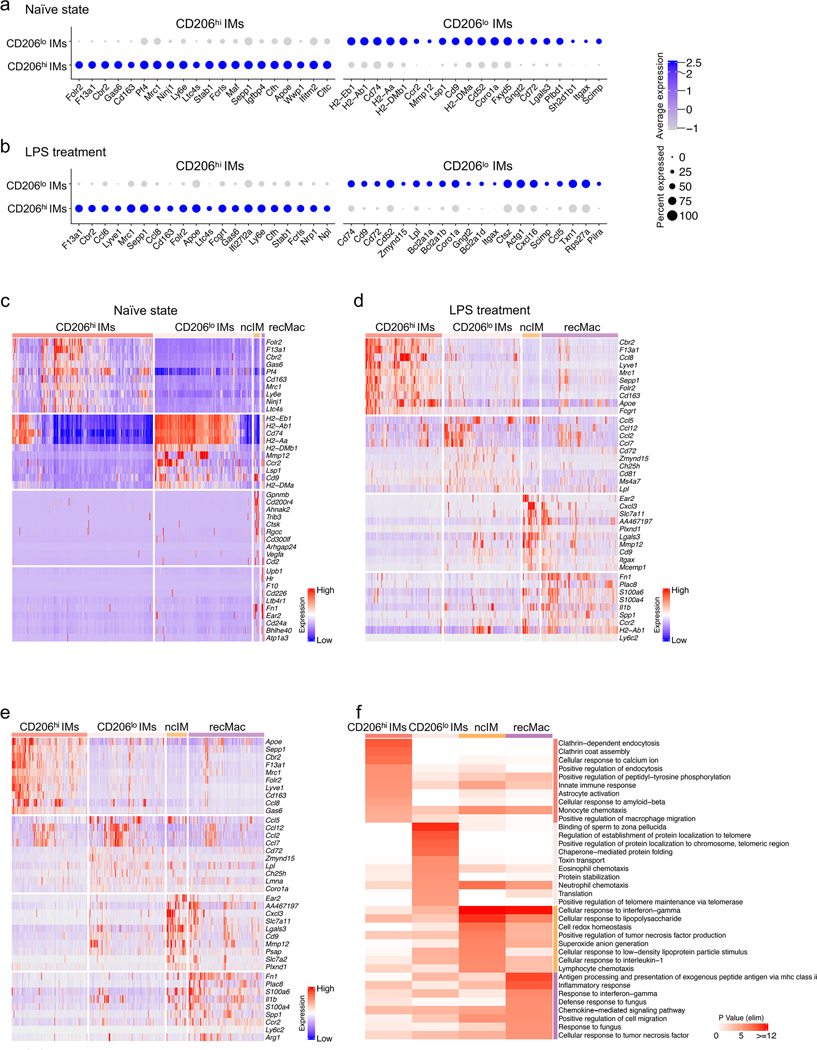
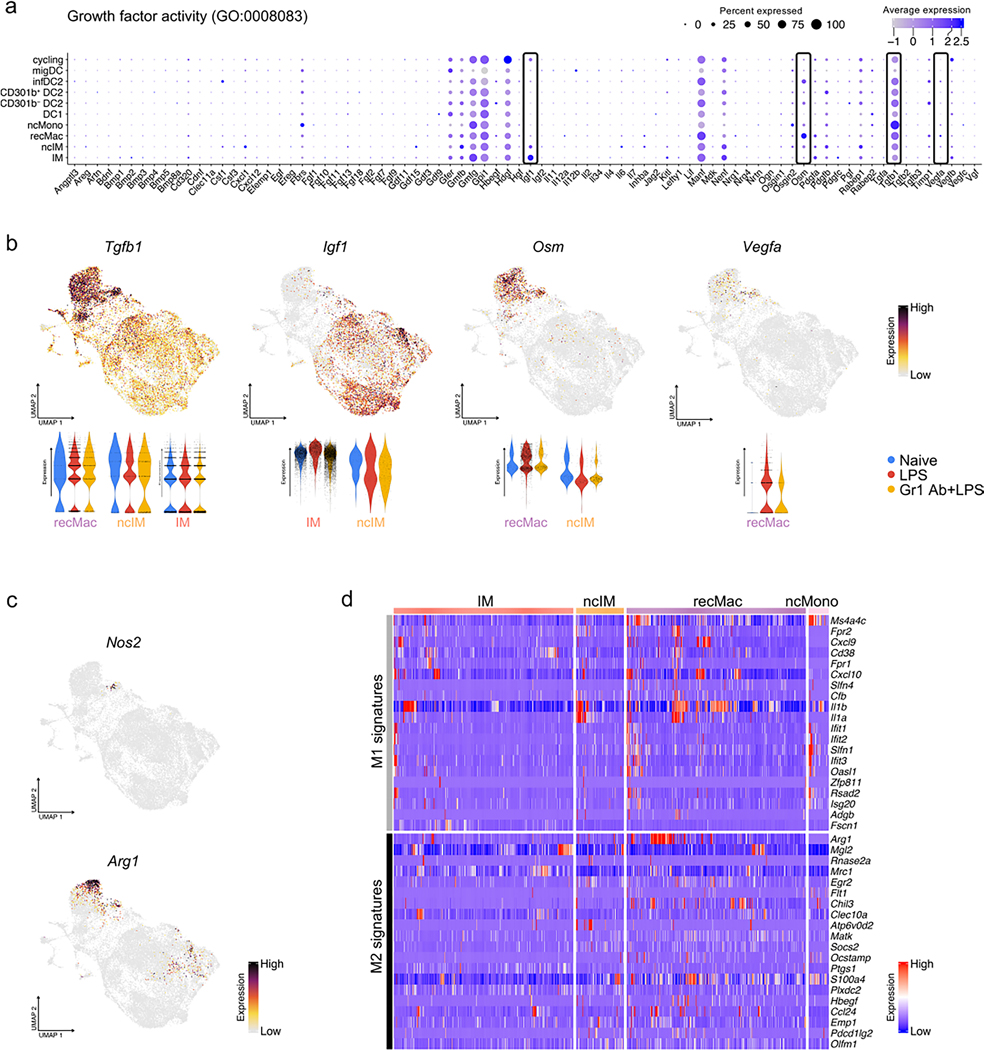
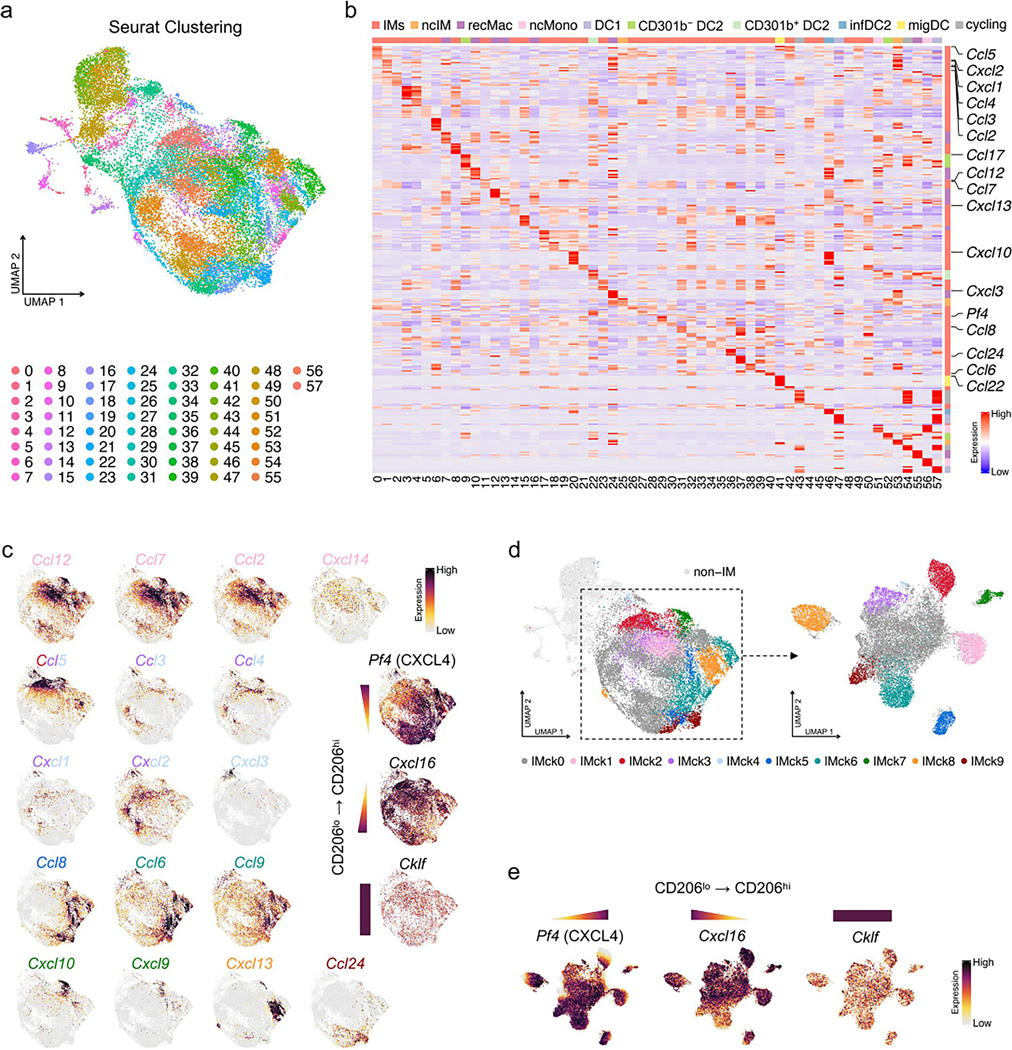
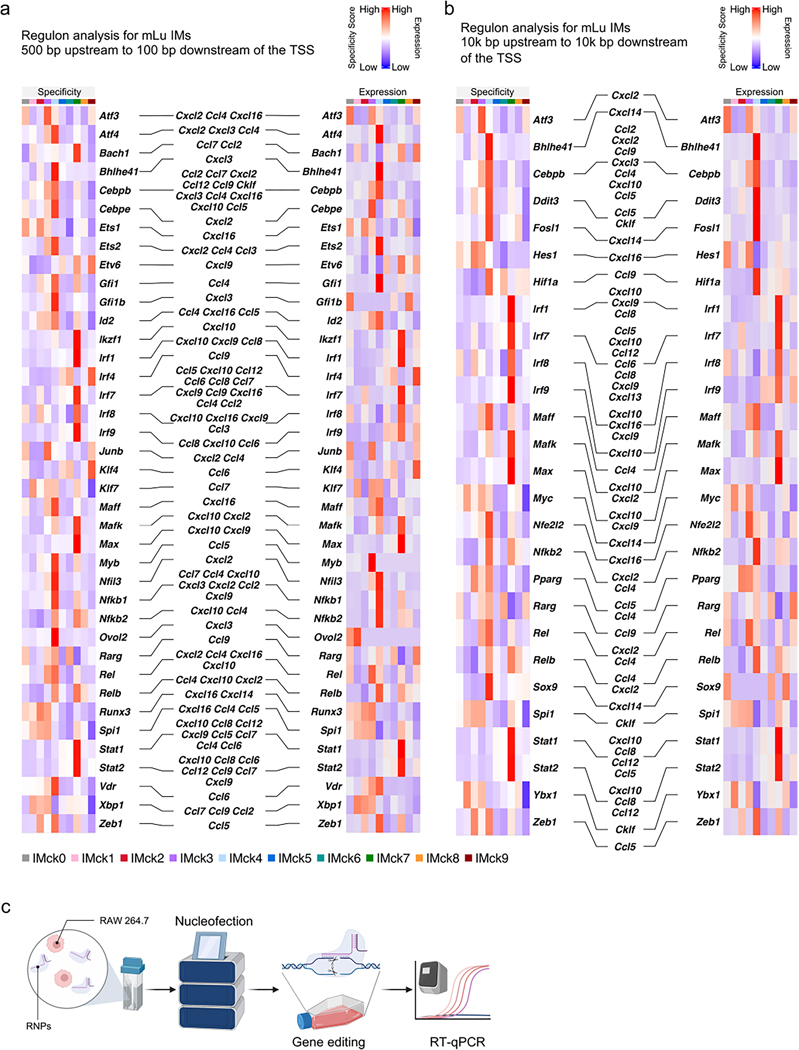
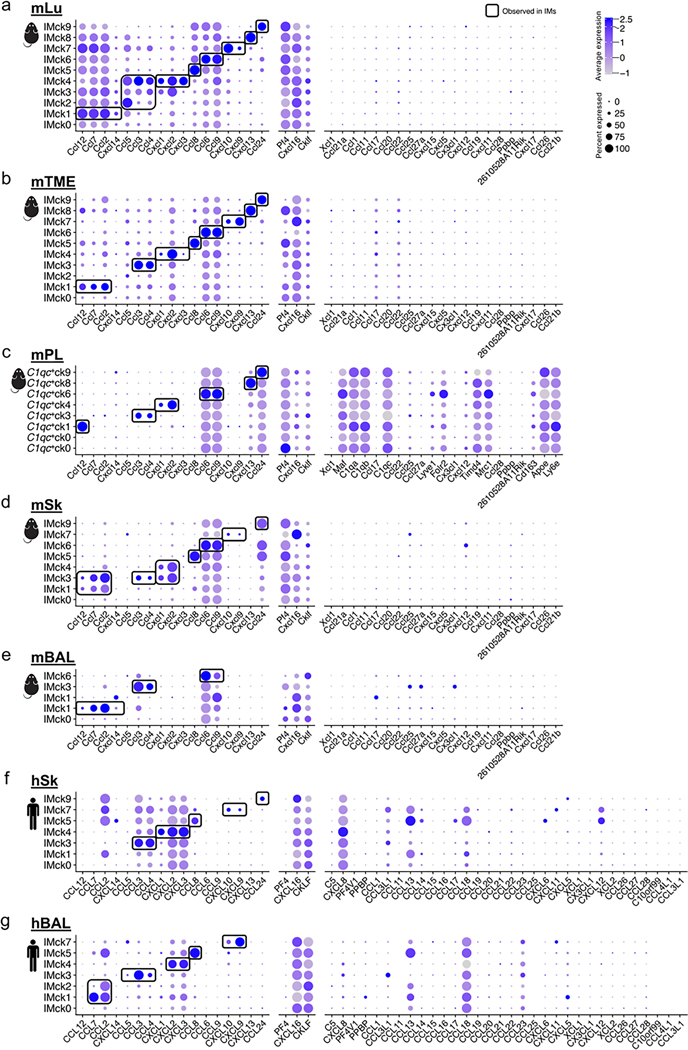
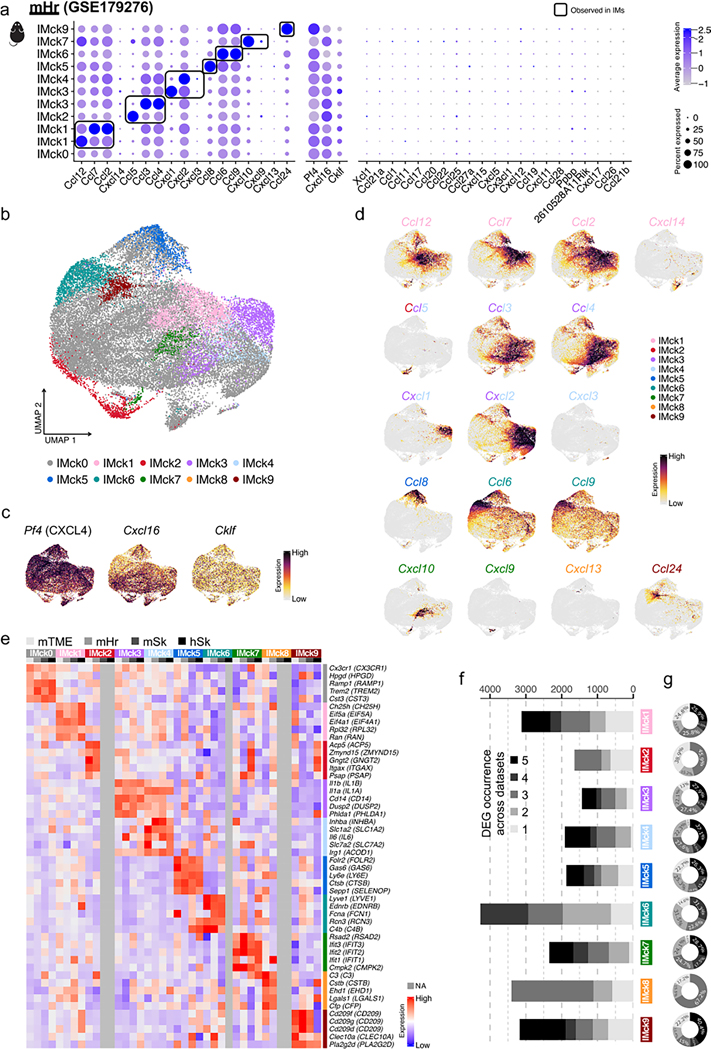
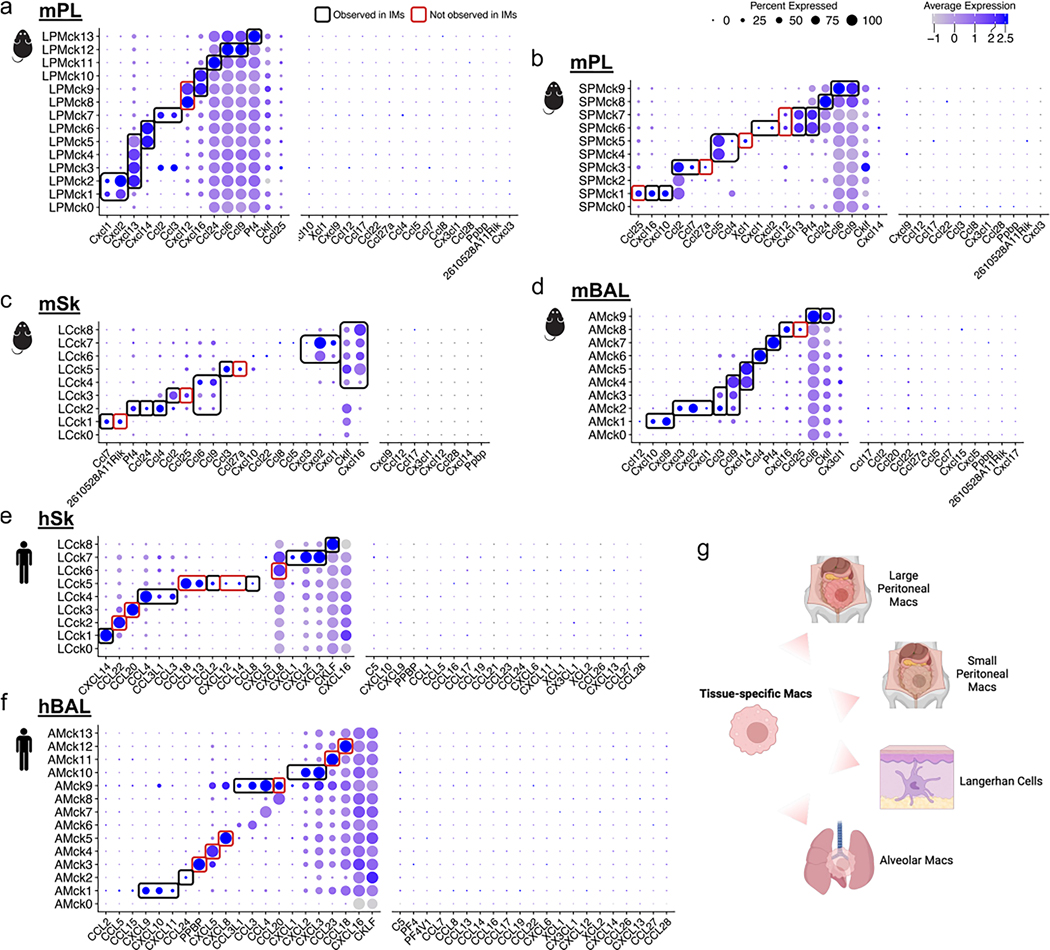
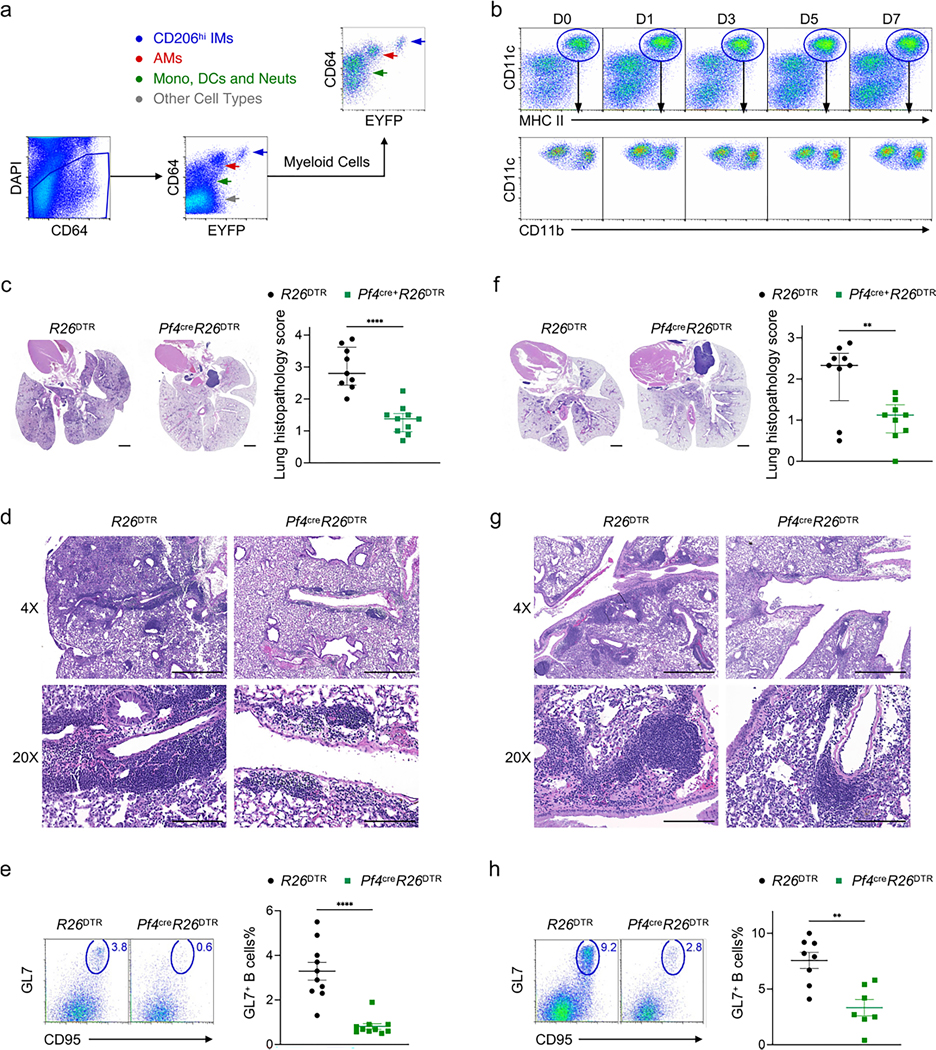
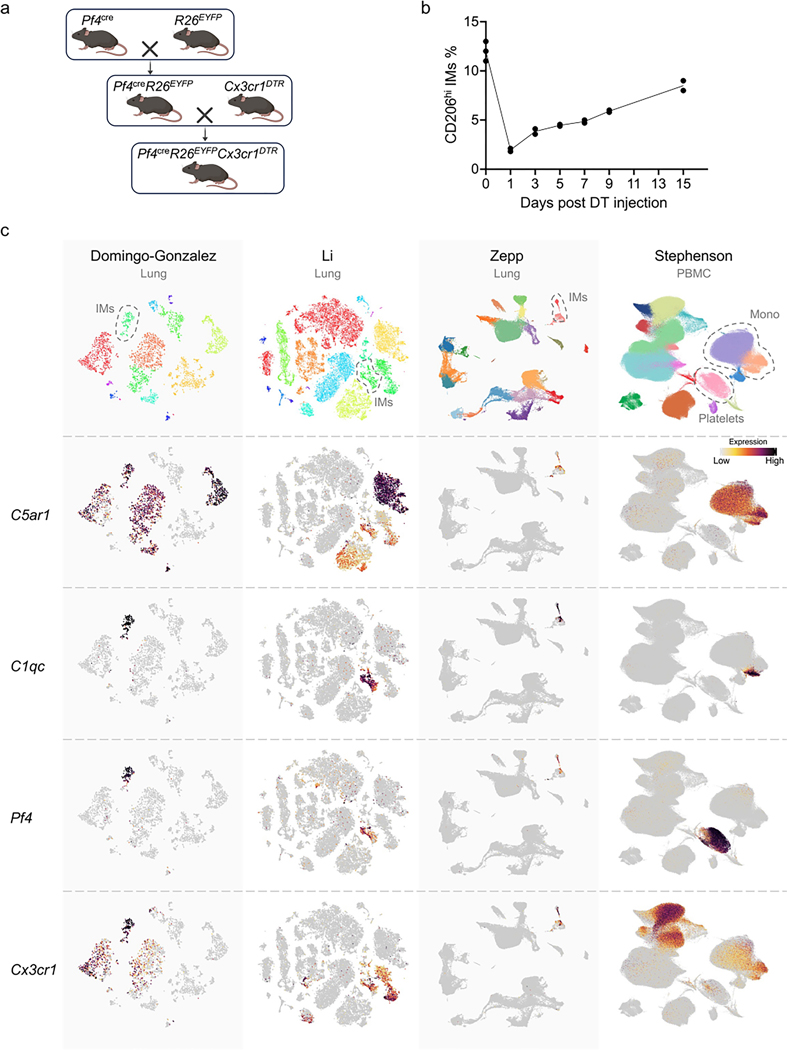
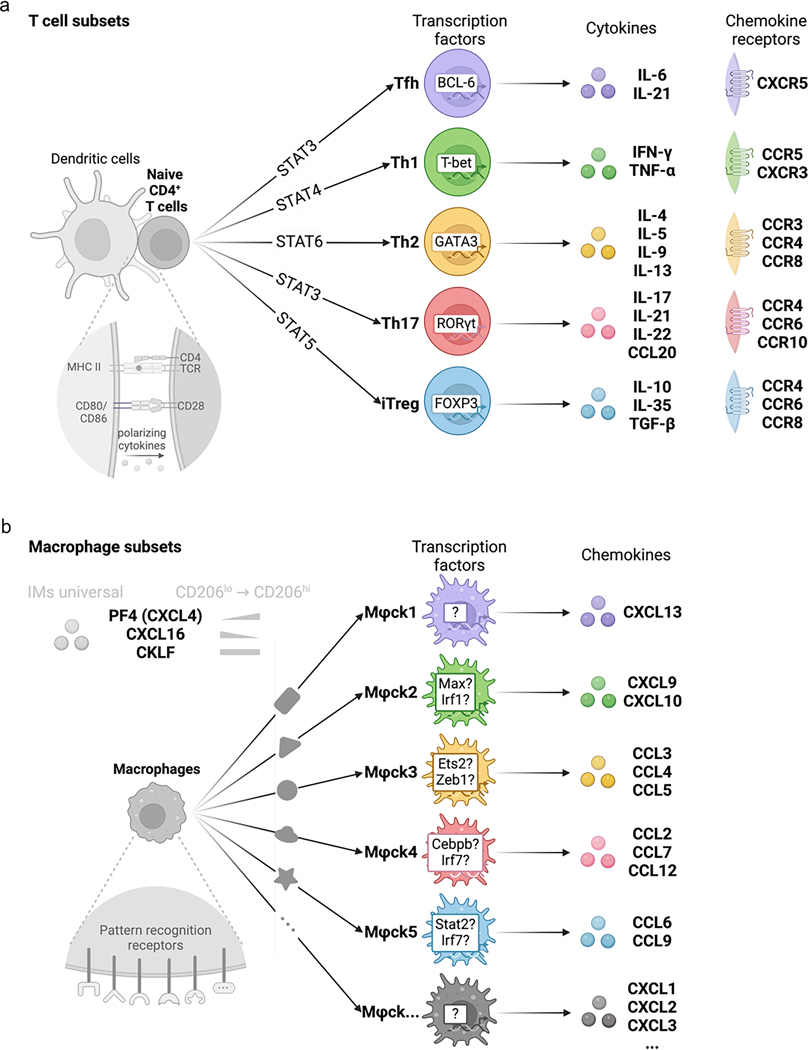
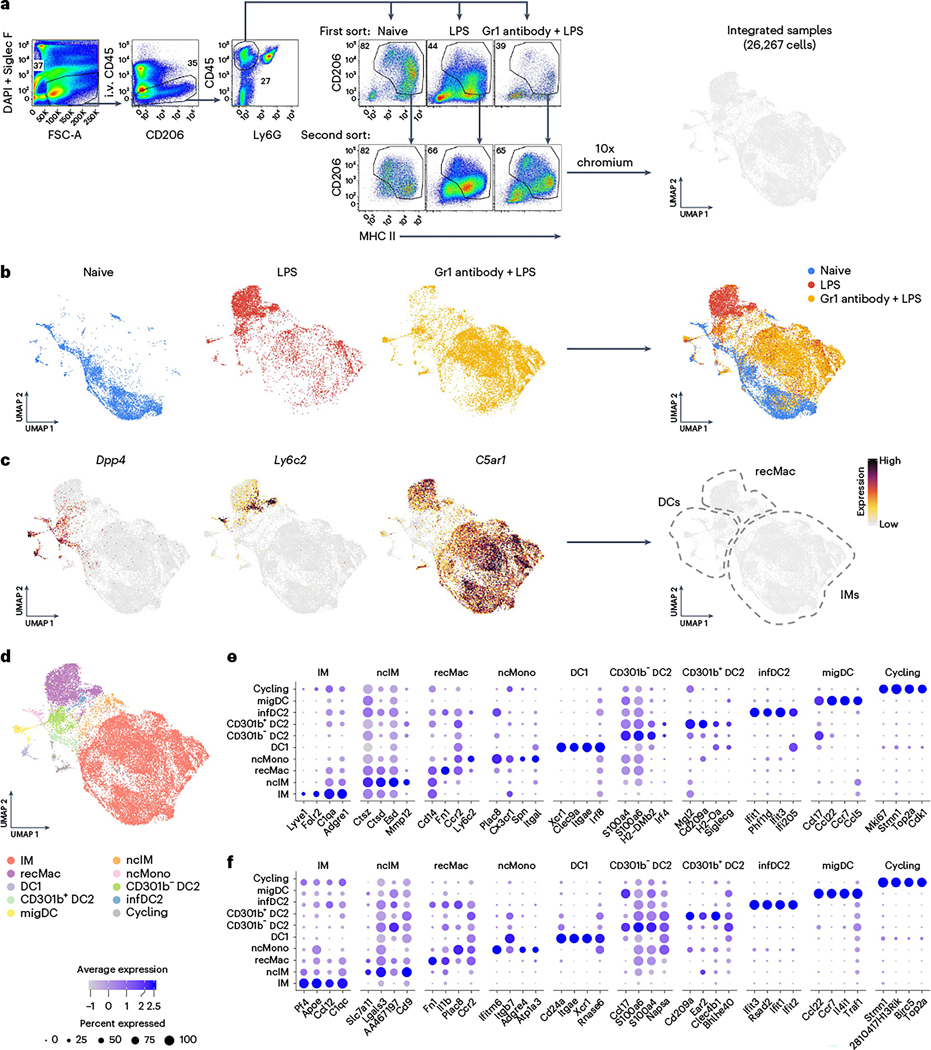
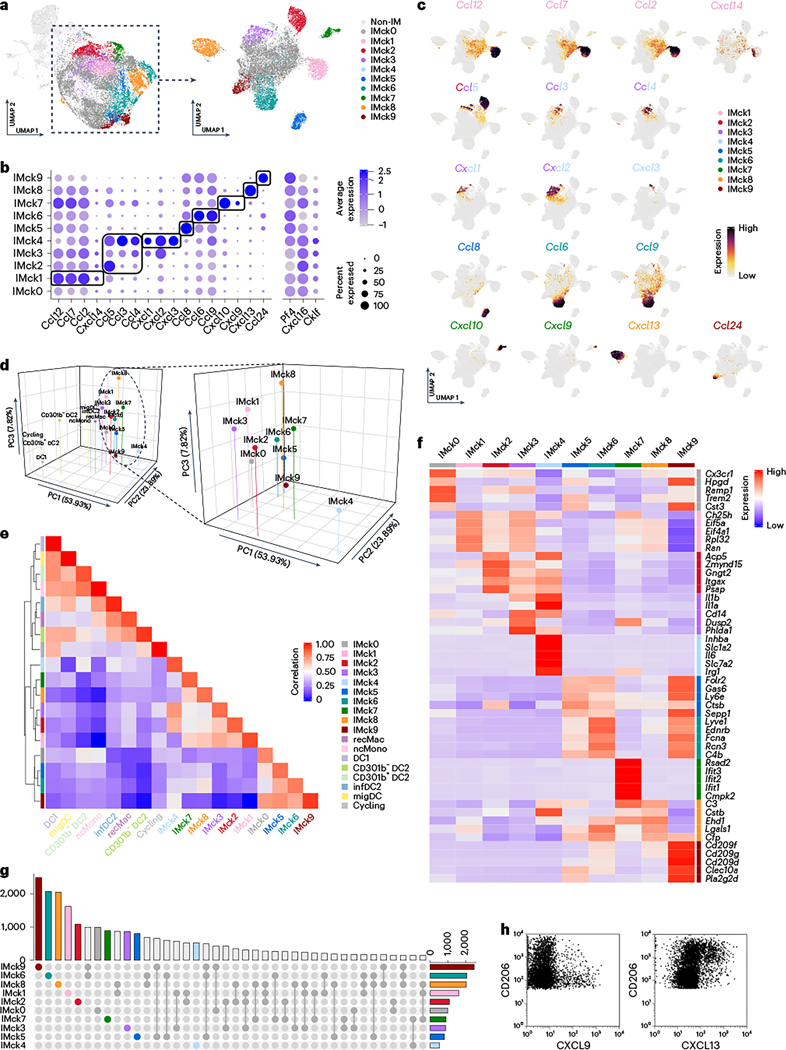
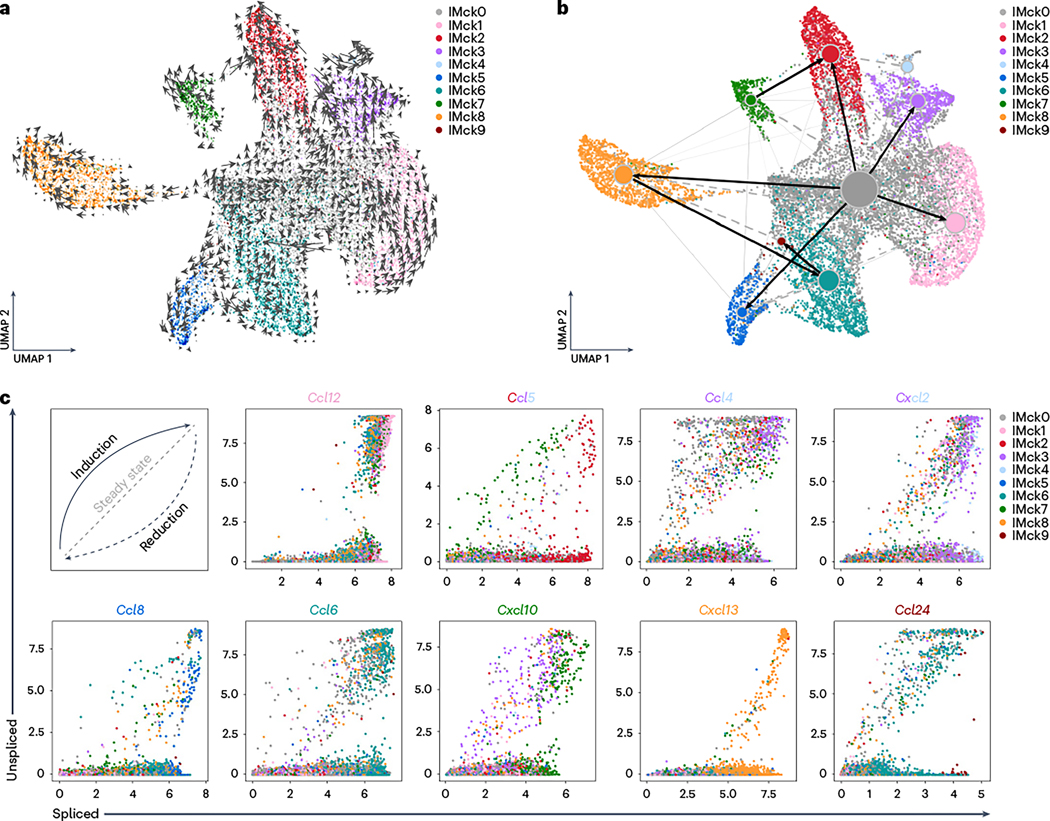
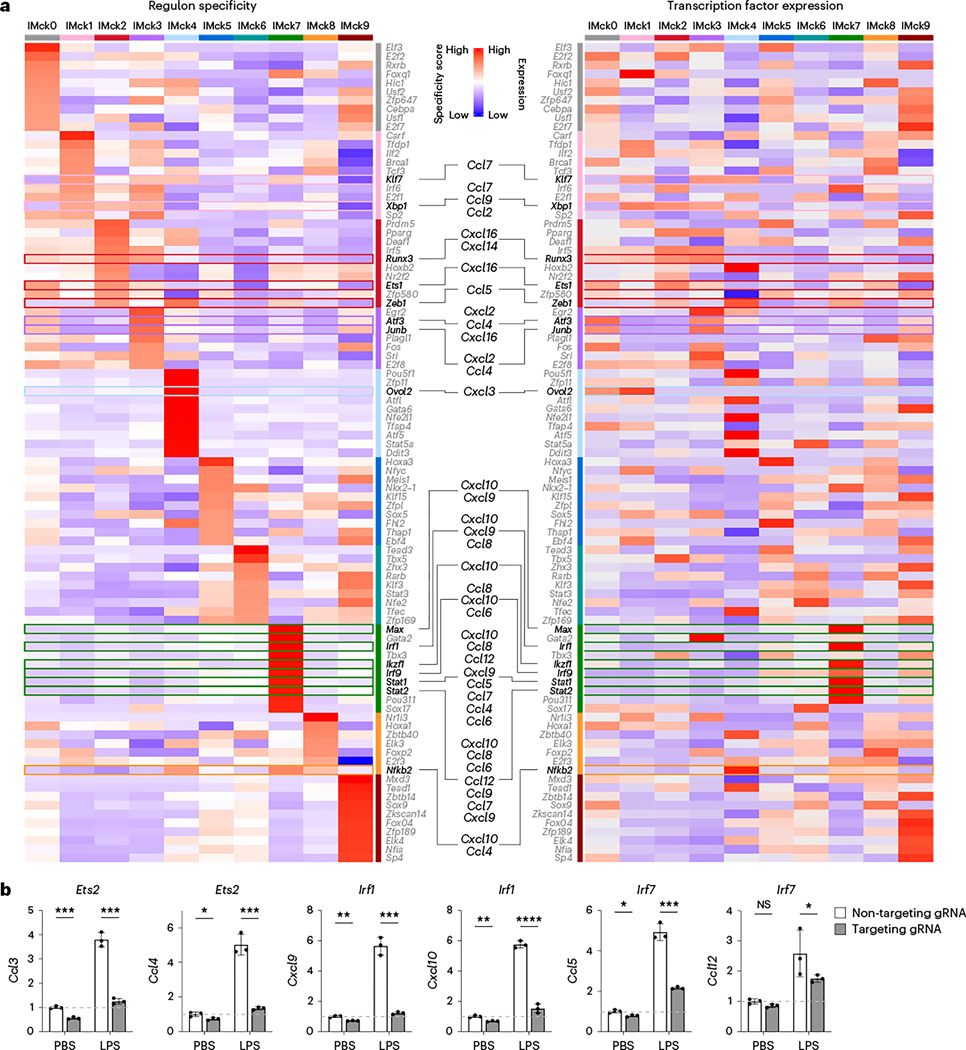
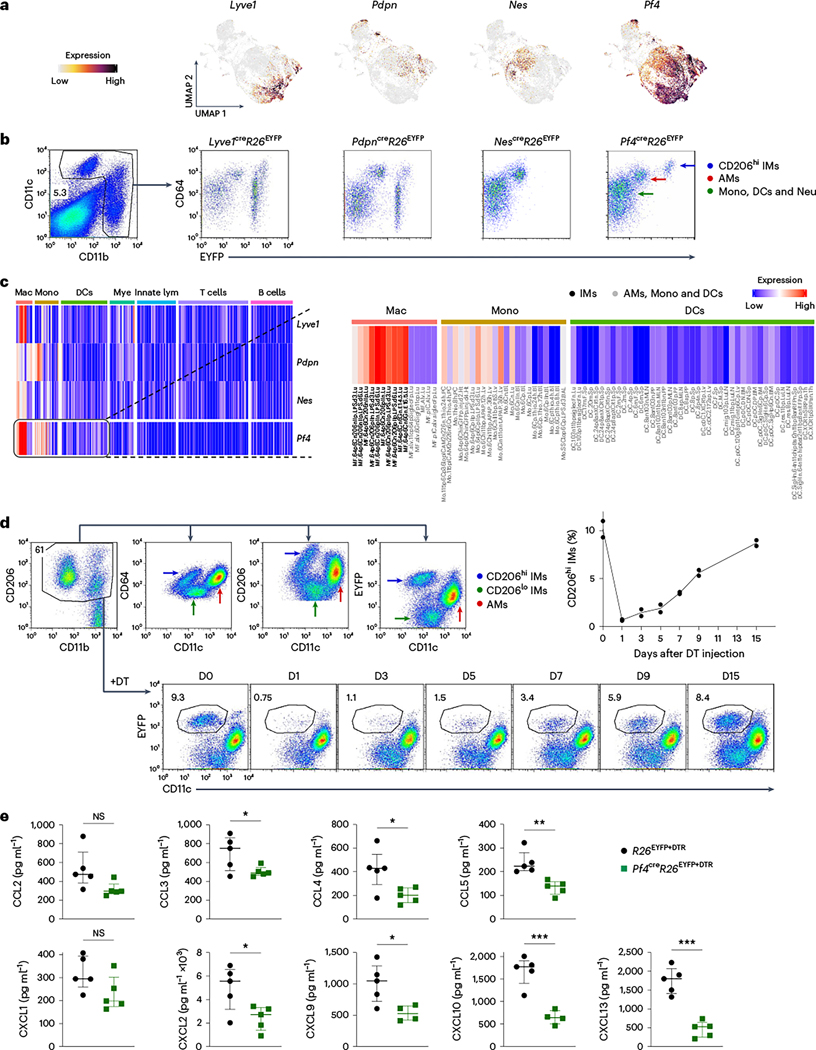
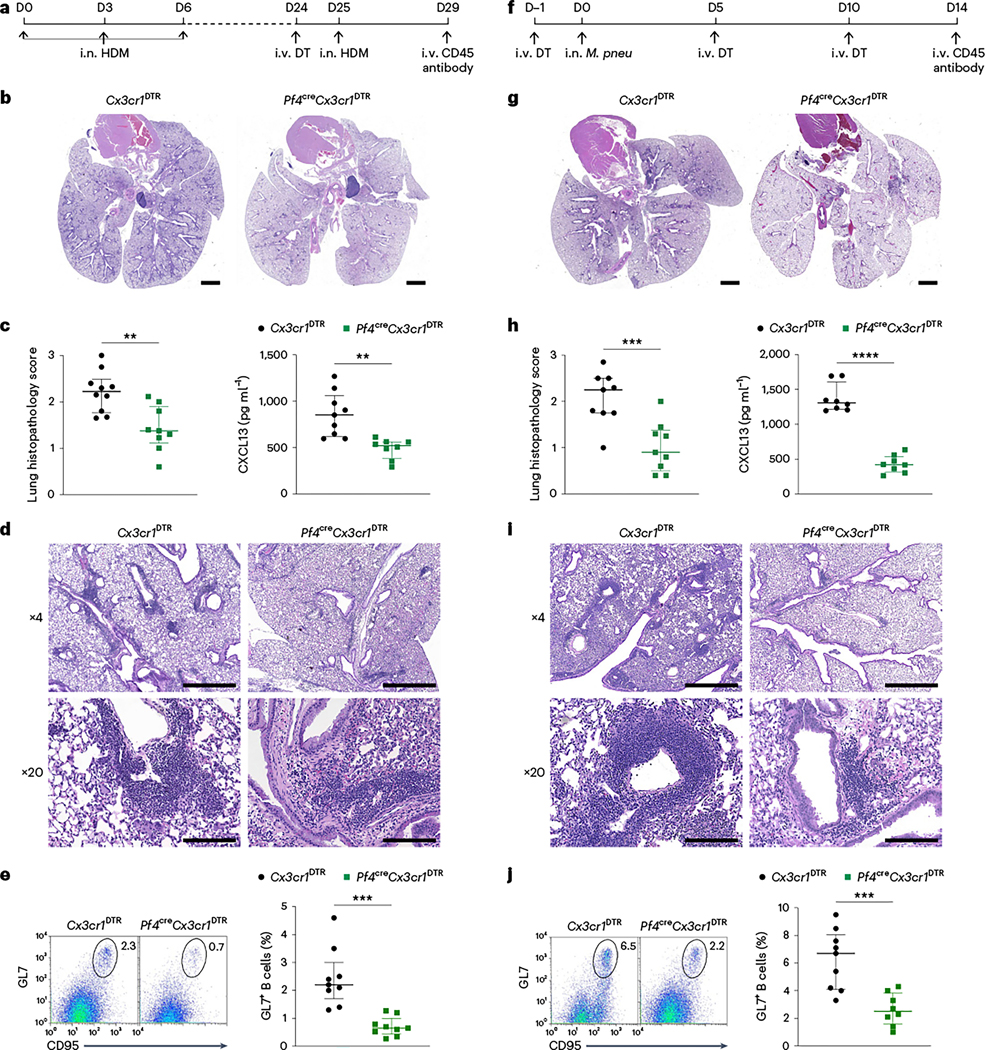
Lung-resident macrophages, which include alveolar macrophages and interstitial macrophages (IMs), exhibit a high degree of diversity, generally attributed to different activation states, and often complicated by the influx of monocytes into the pool of tissue-resident macrophages. To gain a deeper insight into the functional diversity of IMs, here we perform comprehensive transcriptional profiling of resident IMs and reveal ten distinct chemokine-expressing IM subsets at steady state and during inflammation. Similar IM subsets that exhibited coordinated chemokine signatures and differentially expressed genes were observed across various tissues and species, indicating conserved specialized functional roles. Other macrophage types shared specific IM chemokine profiles, while also presenting their own unique chemokine signatures. Depletion of CD206hi IMs in Pf4creR26EYFP+DTR and Pf4creR26EYFPCx3cr1DTR mice led to diminished inflammatory cell recruitment, reduced tertiary lymphoid structure formation and fewer germinal center B cells in models of allergen- and infection-driven inflammation. These observations highlight the specialized roles of IMs, defined by their coordinated chemokine production, in regulating immune cell influx and organizing tertiary lymphoid tissue architecture.


Figures

Extended Data Fig. 1 |
Extended Data Fig. 1 |. Distinct transcriptional profiles and gene ontology enrichment observed in IM subsets.
(a) Dot plot depicts the expression of top 20 DEGs in CD206hi IMs and CD206lo IMs under naïve state. (b) Dot plot depicts the expression of top 20 DEGs in CD206hi IMs and CD206lo IMs under LPS treatment. (c) Heat map shows the expression of top 10 DEGs in CD206hi IMs and CD206lo IMs, ncIM and recMac under naïve state. (d) Heat map shows the expression of top 10 DEGs in CD206hi IMs and CD206lo IMs, ncIM and recMac under LPS treatment. (e) Heat map shows the expression of top 10 overall DEGs in CD206hi IMs and CD206lo IMs, ncIM and recMac. (f) Heat map shows the top 20 biological process-related gene ontology (GO) terms for CD206hi IMs and CD206lo IMs, ncIM and recMac. Statistical analysis was conducted using Fisher’s exact test.
Extended Data Fig. 2 |
Extended Data Fig. 2 |. Absence of unique growth factor or substantial M1/M2 gene signature expression in IM populations.
(a) Dot plot depicts the expression of growth factor genes (GO: 0008083) in each major cell type. (b) Feature plots depict the expression of selected growth factor genes, complemented by violin plots illustrating the expression of those genes in individual experimental groups. (c) Feature plots depict the expression of Nos2 and Arg1, the markers for M1/M2 macrophages. (d) Heat map shows the expression of M1/M2 signature genes (PMID: 31178859) in CD206hi IMs and CD206lo IMs, ncIM and recMac79.
Extended Data Fig. 3 |
Extended Data Fig. 3 |. Unbiased clustering analysis with higher resolution shows chemokine gene enrichment in IM subtypes.
(a) UMAP plot illustrates the 58 clusters generated through an unbiased high-resolution clustering analysis, including 38 IM clusters. (b) Heat map shows the expression of top 10 DEGs in each IM cluster; chemokine genes are distinctly emphasized. (c) UMAP plots illustrates IM chemokine expression. (d) UMAP plots illustrates ten IM subsets (IMck0 through IMck9) delineated by their respective chemokine expression profiles, within the original and re-clustered UMAP plot. (e) Feature plots further detail the expression of pan chemokine genes among IM subsets.
Extended Data Fig. 4 |
Extended Data Fig. 4 |. Identification of regulons governing differential chemokine expression among IM subsets.
(a) With the motif enriched 500 bp upstream to 100 bp downstream of the targeted gene TSS, left panel: heat map shows the specificity of top 10 regulons enriched in each IM subset, as identified by SCENIC analysis, with the ones that putatively regulate the indicated chemokine genes are accentuated; right panel Heat map shows the expression of the transcription factors from the top 10 enriched in each IM subset, with the ones that putatively regulate the indicated chemokine genes are accentuated. (b) With the motif enriched 10k bp around the targeted gene TSS, right panel: heat map shows the specificity of top 10 regulons enriched in each IM subset, as identified by SCENIC analysis, with the ones that putatively regulate the indicated chemokine genes are accentuated; right panel Heat map shows the expression of the transcription factors from the top 10 enriched in each IM subset, with the ones that putatively regulate the indicated chemokine genes are accentuated. (c) Workflow illustrates the verification of putative transcription factors through CRISPR-mediated knockout in the RAW 264.7 mouse macrophage cell line. Following nucleofection of ribonucleoprotein with various gRNAs, the cells were treated with either PBS or LPS for 24 hours. RT-qPCR assessed chemokine gene expression.
Extended Data Fig. 5 |
Extended Data Fig. 5 |. IMck subsets are conserved across mouse and human tissues.
a-g, Dot plots depict the expression of complete chemokine gene set (GO: 0008009) in IM datasets across diverse tissues and species: (a) Mouse lung (mLu); (b) Mouse tumor microenvironment (mTME); (c) Mouse peritoneal lavage (mPL); (d) Mouse skin (mSk); (e) Mouse bronchioalveolar lavage (mBAL); (f) Human skin (hSk); (g) Human bronchioalveolar lavage (hBAL). Highlighted regions accentuate the chemokine-expression patterns of IMs observed in mLu.
Extended Data Fig. 6 |
Extended Data Fig. 6 |. Chemokine-expressing IM subsets are conserved in mouse heart (GSE179276).
(a-d) mouse heart (mHr) IMs (a) Dot plot depicts the expression of complete chemokine gene set (GO: 0008009) across the identified IM subsets (IMck0 through IMck9). (b) UMAP plots illustrates ten IM subsets delineated by their respective chemokine expression profiles. (c) Feature plots further detail the expression of pan chemokine genes among IM subsets. (d) Feature plots further detail the expression of remaining individual chemokine genes among IM subsets. (e) Heat map shows the expression of the top 5 DEGs, excluding chemokine genes, originally identified in the mLu dataset across corresponding IM subsets in additional datasets from different tissues and species (mTME, mHr, mSk, hSk). Expression data are normalized within each dataset and merged for the combined visualization. IM subsets not represented in certain datasets are indicated in gray. (f) Bar graph illustrates the distribution of IMck DEGs across five distinct datasets (mLu, mTME, mHr, mSk, hSk). The y-axis categorizes the IM subsets, while the x-axis quantifies the number of DEGs. The DEGs are color-coded based on their occurrence across the datasets, with five shades of gray indicating the level of overlap. The darkest shade represents genes shared in all five datasets, indicating the highest conservation, while the lightest shade represents genes unique to a single dataset, indicating no overlap. (g) Donut charts illustrates the distribution of IMck DEGs five distinct datasets (mLu, mTME, mHr, mSk, hSk) in the format of percentage values, complementing the bar graph.
Extended Data Fig. 7 |
Extended Data Fig. 7 |. Tissue-specific macrophages also comprise chemokine-expressing subsets.
a-f, Dot plots depict the expression of complete chemokine gene set (GO: 0008009) in tissue-specific macrophage datasets across diverse tissues and species: (a) Large peritoneal macrophages (LPMs) in mPL; (b) Small peritoneal macrophages (SPMs) in mPL; (c) Langerhans cells (LCs) in mSk; (d) Alveolar macrophages (AMs) in mBAL; (e) Langerhans cells (LCs) in hSk; (f) Alveolar macrophages (AMs) in hBAL. Regions highlighted in black accentuate the chemokine-expression patterns observed in IMs and regions highlighted in red accentuate the unique chemokine-expression patterns observed in tissue-specific macrophages. (g) Schematic representation of the different tissue-specific macrophages investigated for chemokine expression in this figure.
Extended Data Fig. 8 |
Extended Data Fig. 8 |. IMs contribute to iBALT formation in Pf4creR26DTR mice.
(a) Flow plots illustrates the verification of Pf4 specificity through Cre recombinase-induced EYFP activation in Pf4crecreR26EYFP mice. Live cells were gated based on DAPI cells, and it was observed that EYFP expression was exclusive to interstitial macrophages without non-specific targeting effects. (b) Flow plots illustrates the verification of the integrity of dendritic cells (DCs) and other myeloid cells in Pf4creR26EYFP+DTR mice following a single DT administration. DCs were further subdivided into DC1 and DC2 subsets based on the expression of CD11b and CD11c. Cells were gated on DAPICD88 myeloid cells. c-e, CD206hi IMs contribute to iBALT formation and B cells maturation in the type 2 inflammation model in Pf4creR26DTR mice. (c) Representative H&E-stained sections of lungs in R26DTR mice and Pf4creR26DTR mice treated with HDM (left, scale bars = 1000 μm). Lung histopathology scores in R26DTR mice and Pf4creR26DTR mice treated with HDM. Two independent experiments with n = 9–10 per group. (d) H&E-stained sections of lungs in R26DTR mice and Pf4creR26DTR mice treated with HDM (4X camera lens magnification, scale bars = 1000 μm or 20X camera lens magnification, scale bars = 200 μm). Two independent experiments with n = 4–5 per group. (e) Flow plots of lung GL7+CD95+ B cells, and the percentage of GL7+ B cells in lung extravascular CD45+ cell population, from R26DTR mice and Pf4creR26DTR mice treated with HDM. Two independent experiments with n = 10 per group. f-h, CD206hi IMs contribute to iBALT formation and B cells maturation in the bacterial infection model in Pf4creR26DTR mice. (f) Representative H&Estained sections of lungs in R26DTR mice and Pf4creR26DTR mice treated with M. pneu (left, scale bars = 1000 μm). Lung histopathology scores in R26DTR mice and Pf4creR26DTR mice treated with M. pneu. Two independent experiments with n = 9 per group. (g) H&E-stained sections of lungs in R26DTR mice and Pf4creR26DTR mice treated with M. pneu (4X camera lens magnification, scale bars = 1000 μm or 20X camera lens magnification, scale bars = 200 μm). Two independent experiments with n = 4 per group. (h) Flow plots of lung GL7+CD95+ B cells, and the percentage of GL7+ B cells in lung extravascular CD45+ cell population, from R26DTR mice and Pf4creR26DTR mice treated with M. pneu. Two independent experiments with n = 8 per group. Data are shown as median with interquartile range. P values were calculated using two-sided Student’s t-test. *P < 0.05, **P < 0.01, ***P < 0.001, and ****P < 0.0001. Exact P values are listed in Source Data.
Extended Data Fig. 9 |
Extended Data Fig. 9 |. Enhanced specificity in targeting CD206hi IMs using the Pf4cre mouse model in combination with Cx3cr1DTR mice.
(a) Breeding scheme to produce Pf4creR26EYFPCx3cr1DTR offspring. (b) A time course analysis presents the depletion kinetics of CD206hi IMs in Pf4creR26EYFPCx3cr1DTR mice following a single DT administration. Three independent experiments. (c) Bioinformatical verification of the specificity in Pf4creCx3cr1DTR mice by analyzing public datasets: GSE147668 (Domingo-Gonzalez - Lung), CRA004586 (Li - Lung), GSE149563 (Zapp - Lung), and E.MTAB.10026 (Stephenson - PBMC), highlighting the specific expression of both Pf4 and Cx3cr1 by IMs. Visualizations with complete cell types labels are available on different dataset repositories (listed in Data Availability section) and original publications.
Extended Data Fig. 10 |
Extended Data Fig. 10 |. Analogous to cytokine-producing helper T cells, macrophages’ specific chemokine expression may also be under tight regulation.
(a) The illustration summarizes the established T cell subsets, emphasizing the distinct differentiation trajectories, cytokines, and chemokine receptor expression profiles for each subset. (b) The illustration summarizes the proposed universal classification of macrophage subsets, emphasizing the distinct differentiation trajectories and associated chemokine expression profiles for each subset.
Fig. 1 |
Fig. 1 |. Tissue-resident IMs are distinct from recMacs.
a, Gating strategy for sorting of intravenous (i.v.) CD45Siglec FLy6GCD206+MHCII+ macrophages, including tissue-resident IMs and recMacs. Mice were injected i.v. with CD45 antibody 5 min before killing to exclude intravascular leukocytes. Cells were enriched with CD11b beads and sorted before scRNA-seq. UMAP illustrates 26,267 cells. b, UMAP distribution of macrophages sorted as in a from lungs of mice at steady state (naive), 24 h post-treatment with LPS (LPS) and 24 h post-treatment with Gr1 antibody + LPS. c, Feature plots showing Dpp4+ (CD26) dendritic cells (DCs), Ly6c2+C5ar1+ (CD88) recMacs and Ly6c2 IMs in UMAP. df, Cell type identification of IMs (C1qc+), non-classic IMs (ncIMs and Ctsz+), recMacs (Fn1+), non-classic monocytes (ncMonos and Plac8+), DC1 (Xcr1+), CD301b DC2 (Cd209a+S100a4+S), CD301b+ DC2 (Cd209a+Mgl2+), inflammatory DC2 (infDC2 and Ifit3+), migratory DCs (migDCs and Ccr7+) and cycling cells (cycling and Mki67+) (d), based on the gene expression profiles of a selection of curated genes (e) and the top DEGs (f). DAPI, 4,6-diamidino-2-phenylindole.
Fig. 2 |
Fig. 2 |. IMs are classified into two distinct subsets.
a, Feature plots showing the expression of Mrc1 (CD206), Cd163, Folr2, Lyve1, Timd4, Cx3cr1, Itgax (CD11c), H2-Aa (MHC II) and Ccr2 marker genes for CD206hiCD163hi IMs (CD206hi IMs) and CD206loCD163lo IMs (CD206lo IMs). b, Feature plot showing the expression of C1qc in CD206hi IMs and CD206lo IMs. c, Expression of C1q protein in total IMs (CD64+CD11bhi). Cells were gated on CD45+ myeloid cells. d, Heat map showing the expression of the top 20 DEGs in CD206hi IMs and CD206lo IMs. e, Heat map showing the enrichment of the top 20 biological process-related GO terms in CD206hi IMs and CD206lo IMs. Statistical analysis was conducted using Fisher’s exact test.
Fig. 3 |
Fig. 3 |. Chemokine expression reveals IM heterogeneity.
a, UMAP plot of IMck0–IMck9 subsets based on their respective chemokine expression profiles, within the original UMAP plot and re-clustered. b, Dot plot of chemokine gene expressions across the IMck0–IMck9 subsets. c, Feature plots detailing the expression of Ccl12, Ccl7, Ccl2, Cxcl14, Ccl5, Ccl3, Ccl4, Cxcl1, Cxcl2, Cxcl3, Ccl8, Ccl6, Ccl9, Cxcl10, Cxcl9, Cxcl13 and Ccl24 among IMck0–IMck9 subsets. d, 3D PCA plot of IMck0–IMck9 and other major cell types (recMacs, ncMonos, DC1, CD301b DC2, CD301b+ DC2, infDC2, migDCs and cycling) showing close clustering of IMck subsets (left) and the distinct distribution and intrinsic heterogeneity among IMck subsets (right). e, Heat map showing the correlation among IMck0–IMck9 subsets and other major cell types (recMacs, ncMonos, DC1, CD301b DC2, CD301b+ DC2, infDC2, migDCs and cycling). f, Heat map showing the expression of the top five DEGs, excluding the chemokines genes, in IMck0–IMck9 subset. g, UpSet plot showing the intersections of DEGs among IMck0–IMck9 subsets to illustrate the distinctiveness of each subset and the minimal overlap among them. h, Flow plots of the differential expression of CXCL9 and CXCL13 proteins in Siglec FLy6CCD64+CD11b+CD206hi IMs (CD206hi IMs) and Siglec FLy6CCD64+CD11b+CD206lo IMs (CD206lo IMs). Three independent experiments were conducted. Cells were gated on all lung IMs.
Fig. 4 |
Fig. 4 |. The majority of IMck subsets arise from IMck0.
a, UMAP plot of mRNA velocity from the mLu scRNA-seq dataset using IMs of mice 24 h post-treatment with LPS. The vector field portrays the trajectory of IM differentiation following LPS stimulation. Speed is defined as the length of the velocity vector. b, PAGA connectivity analysis of LPS-stimulated IMs as in a, underlining the hierarchical connections. Stronger connections are accentuated with thicker dark lines and directional indicators are labeled. c, Phase portraits of chemokine genes across IMck0–IMck9, showing the distinct phases inherent to each subset. A diagonal dashed gray line indicates inferred steady state, a solid black arrow indicates the induction stage and a dashed black arrow indicates the repression stage.
Fig. 5 |
Fig. 5 |. Regulons govern gene expression of IMck subsets.
a, Heat map showing the specificity of the top ten regulons enriched in each IMck subset, as identified by SCENIC analysis, with regulons that putatively regulate the indicated chemokine genes accentuated (left) and a heat map showing the transcription factors expression in the top ten enriched regulons in each IMck subset, with the transcription factors that putatively regulate the indicated chemokine genes accentuated (right). b, Relative expression of Ccl3, Ccl4, Cxcl9, Cxcl10, Ccl5 and Ccl12 in RAW 264.7 cells following gRNA-targeted knockout of the transcription factors Ets2, Irf1 and Irf7. Data were normalized to the housekeeping gene Actb and non-targeting gRNA (noncoding) nucleofected RAW 264.7 cells treated with PBS. Two independent experiments were conducted, with a technical replicate size of n = 3 biologically independent samples for each group. Data are shown as mean ± s.d. P values were calculated using two-sided Student’s t-test. *P < 0.05; **P < 0.01; ***P < 0.001; ****P < 0.0001; NS, not significant. Exact P values are listed in Source Data.
Fig. 6 |
Fig. 6 |. CD206hi IMs are depleted in Pf4creR26EYFP+DTR mice.
a, Feature plots depicting the expression of Lyve1, Pdpn, Nes and Pf4 in naive and LPS-stimulated IMs. b, Flow plots showing the expression of EYFP in CD11c+ or CD11b+ cells in Lyve1creR26EYFP, PdpncreR26EYFP, NescreR26EYFP and Pf4creR26EYFP mice. Cells were gated on DAPI live cells. c, Heat maps showing the expression of Pf4 in hematopoietic cells based on ImmGen datasets. d, Gating strategy showing the expression of EYFP in CD206hi IMs within lung tissue-resident macrophages (including CD11c+CD11blo AMs, CD11b+CD206hi IMs and CD11b+CD206lo IMs) and the time course of CD206hi IMs depletion kinetics in Pf4creR26EYFP+DTR mice following a single i.v. injection of DT. Cells were gated on DAPILy6CCD64+ lung macrophages. Three independent experiments were conducted. e, Luminex multiplex assay of CCL2, CCL3, CCL4, CCL5, CXCL1, CXCL2, CXCL9 and CXCL10 and an ELISA of CXCL13 in homogenized mouse lung tissues from R26EYFP+DTR mice and Pf4creR26EYFP+DTR mice 24 h post-treatment with DT and LPS. Two independent experiments were conducted with n = 5 biologically independent samples for each group. Data are shown as median with interquartile range. P values were calculated using a two-sided Student’s t-test. *P < 0.05; **P < 0.01; ***P < 0.001; ****P < 0.0001; NS, not significant. Exact P values are listed in Source Data. Mono, monocytes; Neu, neutrophils; Mye, myeloid cells; Mac, macrophages; lym, lymphocytes.
Fig. 7 |
Fig. 7 |. IMs contribute to iBALT formation.
a, Timeline showing the intranasal (i.n.) sensitization of Cx3cr1DTR mice and Pf4creCx3cr1DTR mice with 10 μg D. pteronyssinus (HDM) every 3 days for 7 days followed by i.v. injection of DT on day 24 (D24) and i.n. challenge with 25 μg HDM on day 25. Lungs were analyzed on day 29. b, Representative hematoxylin and eosin (H&E)-stained sections of lungs in Cx3cr1DTR mice and Pf4creCx3cr1DTR mice treated with HDM as in a (scale bars, 1,000 μm). Two independent experiments with n = 4 per group. c, Lung histopathology scores in Cx3cr1DTR mice and Pf4creCx3cr1DTR mice treated with HDM as in a (two independent experiments, n = 9–10 per group) and the CXCL13 protein concentration in lung tissues homogenates analyzed by ELISA from mice receiving the same treatment (two independent experiments, n = 9 per group). d, H&E-stained sections of lungs in Cx3cr1DTR mice and Pf4creCx3cr1DTR mice treated with HDM as in a (×4 camera lens magnification, scale bars, 1,000 μm or ×20 camera lens magnification, scale bars, 200 μm). Two independent experiments were conducted with n = 4 per group. e, Flow plots of lung GL7+CD95+ B cells and the percentage of GL7+ B cells in lung extravascular CD45+ cell population from Cx3cr1DTR mice and Pf4creCx3cr1DTR mice treated with HDM as in a. Two independent experiments were conducted with n = 9 per group. f, Timeline showing the i.v. injection of DT on day −1 followed by i.n. instillation of 5 × 10⁸ colony-changing units (CCU) of M. pneumoniae (M. pneu) on day 0 in Cx3cr1DTR mice and Pf4creCx3cr1DTR mice, followed by two more i.v. injections of DT on day 5 and day 10 and analysis of the lungs on day 14. g, Representative H&E-stained sections of lungs in Cx3cr1DTR mice and Pf4creCx3cr1DTR mice treated with M. pneumoniae as in f (scale bars,1,000 μm). Two independent experiments were conducted with n = 4 per group. h, Lung histopathology scores in Cx3cr1DTR mice and Pf4creCx3cr1DTR mice treated with M. pneumoniae as in f (two independent experiments, n = 9 per group) and CXCL13 protein concentration in lung tissues homogenates analyzed by ELISA from mice receiving the same treatment (two independent experiments with n = 8 biologically independent samples for each group). i, H&Estained sections of lungs in Cx3cr1DTR mice and Pf4creCx3cr1DTR mice treated with M. pneumoniae as in f. Two independent experiments were conducted with n = 4 per group (×4 camera lens magnification, scale bars, 1,000 μm or ×20 camera lens magnification, scale bars, 200 μm). j, Flow plots of lung GL7+CD95+ B cells and the percentage of GL7+ B cells in the lung extravascular CD45+ cell population from Cx3cr1DTR mice and Pf4creCx3cr1DTR mice treated with M. pneumoniae as in f. Two independent experiments were conducted with n = 8–9 per group.

Similar articles

Cited by

References

    1. Guilliams M. et al. Spatial proteogenomics reveals distinct and evolutionarily conserved hepatic macrophage niches. Cell 185, 379–396 (2022). - PMC - PubMed
    1. Aegerter H, Lambrecht BN & Jakubzick CV Biology of lung macrophages in health and disease. Immunity 55, 1564–1580 (2022). - PMC - PubMed
    1. Bain CC & MacDonald AS The impact of the lung environment on macrophage development, activation and function: diversity in the face of adversity. Mucosal Immunol. 15, 223–234 (2022). - PMC - PubMed
    1. Li X, Rawat K. & Jakubzick CV Targeting resident macrophages in cancer. Nat. Immunol. 22, 1078–1079 (2021). - PMC - PubMed
    1. Janssen WJ et al. Fas determines differential fates of resident and recruited macrophages during resolution of acute lung injury. Am. J. Respir. Crit. Care Med. 10.1164/rccm.201011-1891oc (2011). - DOI - PMC - PubMed