. 2024 May 2;14(1):10044.
doi: 10.1038/s41598-024-60895-w.

Graft cell expansion from hiPSC-RPE strip after transplantation in primate eyes with or without RPE damage

Affiliations

Graft cell expansion from hiPSC-RPE strip after transplantation in primate eyes with or without RPE damage

Keisuke Kajita et al. Sci Rep. .

Abstract

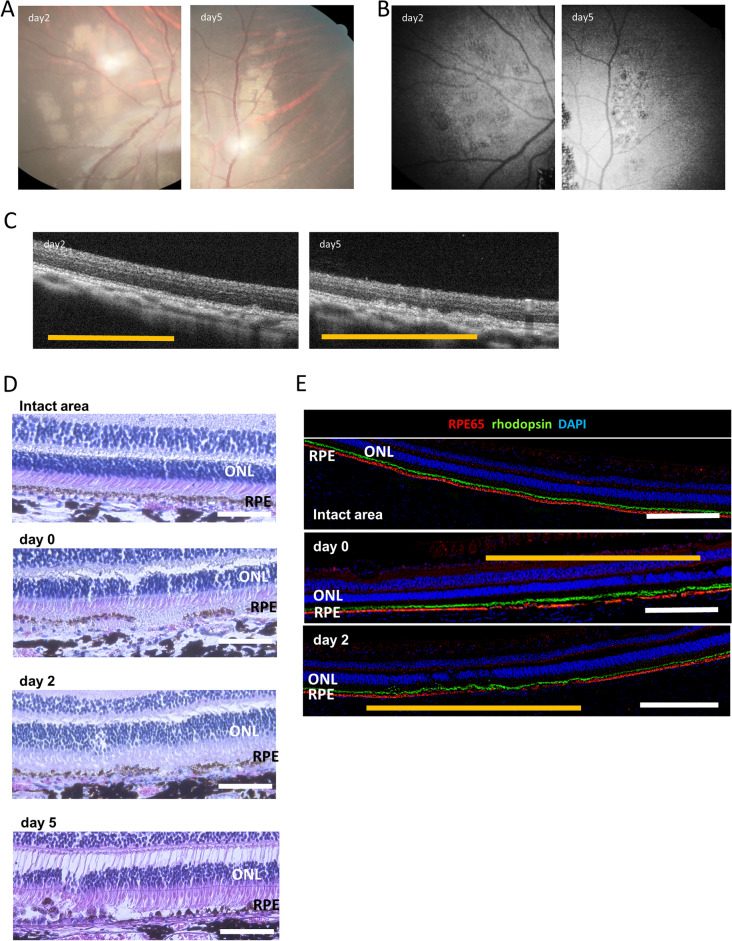
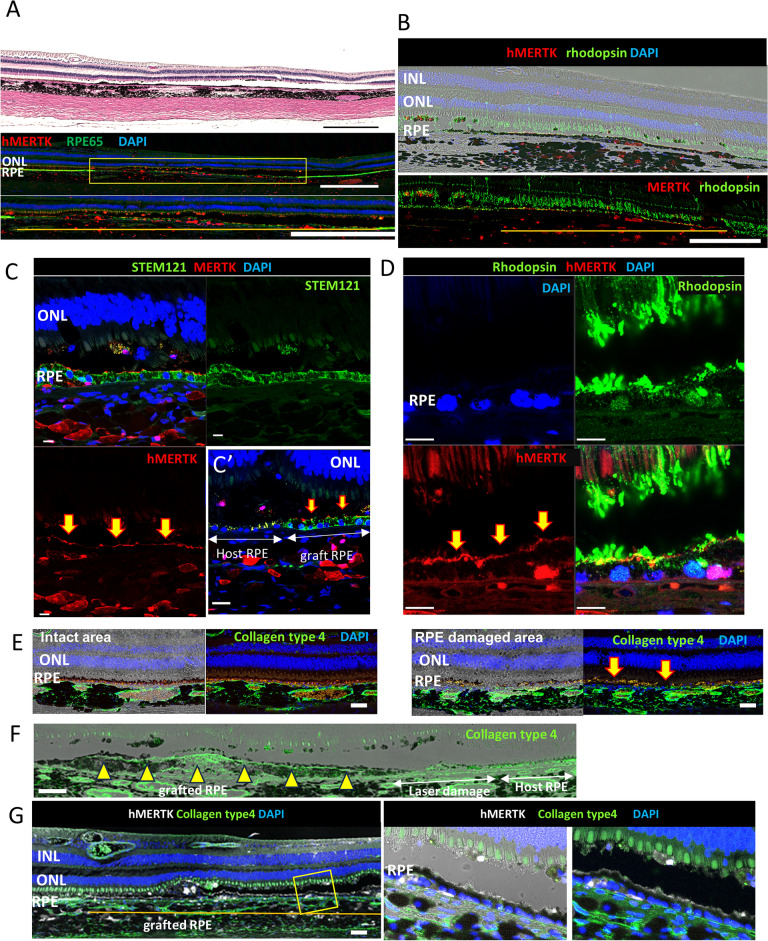
Clinical studies using suspensions or sheets of human pluripotent cell-derived retinal pigment epithelial cells (hiPSC-RPE) have been conducted globally for diseases such as age-related macular degeneration. Despite being minimally invasive, cell suspension transplantation faces challenges in targeted cell delivery and frequent cell leakage. Conversely, although the RPE sheet ensures targeted delivery with correct cell polarity, it requires invasive surgery, and graft preparation is time-consuming. We previously reported hiPSC-RPE strips as a form of quick cell aggregate that allows for reliable cell delivery to the target area with minimal invasiveness. In this study, we used a microsecond pulse laser to create a local RPE ablation model in cynomolgus monkey eyes. The hiPSC-RPE strips were transplanted into the RPE-ablated and intact sites. The hiPSC-RPE strip stably survived in all transplanted monkey eyes. The expansion area of the RPE from the engrafted strip was larger at the RPE injury site than at the intact site with no tumorigenic growth. Histological observation showed a monolayer expansion of the transplanted RPE cells with the expression of MERTK apically and collagen type 4 basally. The hiPSC-RPE strip is considered a beneficial transplantation option for RPE cell therapy.


Conflict of interest statement

The authors declare no competing interests.

Figures

Figure 1
Figure 1
Optimization of microsecond pulse laser conditions. (A) Table summarizing the tested conditions of the microsecond pulse laser treatment. (B) Retinal fundus photographs of a monkey after the irradiation of the microsecond pulse laser and autofluorescence photographs. The ‘M’ mark indicates the visible laser coagulation as a marker. The laser was irradiated at the numbered positions with the conditions listed in the table in Fig. A. Coagulated spots at numbers 1–7 are identified in the autofluorescence image. (C) Retinal fluorescence angiography (FA) photographs after the irradiation of the microsecond pulse laser. In the 4:30 image, coagulated spots present mild hyperfluorescence at coagulation spots 1–8. (D) Optical coherence tomography (OCT) image after the microsecond pulse laser. The ‘M’ mark indicates the site of laser irradiation as a marker. The yellow arrows indicate the sites where the microsecond pulse laser was irradiated. (E) Microsecond pulse lasers with powers of 450 mW, 550 mW, and 650 mW irradiated in a circled area. Autofluorescence photographs, fluorescent retinal angiography images, and OCT after the irradiation are shown. At 550 mW, the coagulated area showed reduced autofluorescence and a mild hyperfluorescence with FA with a mild disturbance in ONL by OCT.
Figure 2
Figure 2
Temporal changes in the RPE layer following micropulse laser treatment. (A) Retinal photographs of the eyes 2 and 5 days after the application of the subthreshold micropulse laser. (B) Autofluorescence images 2 and 5 days after the subthreshold microsecond pulse laser treatment. (C) Optical coherence tomography (OCT) images of the coagulated site 2 and 5 days after the microsecond pulse laser treatment. The yellow line indicates the locus of laser treatment. (D) Hematoxylin and eosin staining of the retinal pigment epithelium (RPE) damaged site immediately after and 2 and 5 days after the microsecond pulse laser treatment. (E) Immunostaining of RPE65 and rhodopsin at intact and RPE-damaged areas immediately after and 2 days after the microsecond pulse laser treatment. Yellow line indicates the locus of laser treatment. ONL outer nuclear layer. Scale bars: (D) 100 μm, (E) 500 μm.
Figure 3
Figure 3
Example of temporal changes in engrafted hiPSC-RPE strips (M4). (A) Schematic diagram of the hiPSC-RPE strip transplantation site. RPE-damaged site created by the microsecond pulse laser treatment. hiPSC-RPE strip cells were transplanted at both the RPE-damaged and intact sites. (B) Image of the hiPSC-RPE strip. (C) Engraftment of the hiPSC-RPE strip at the intact site of the monkey eye. Expansion of hiPSC-RPE strips was observed by both color fundus and autofluorescence images. (D) Engraftment of hiPSC-RPE strips at the RPE-damaged site of the monkey eye. Human iPSC-RPE strips expanded from the early observation time point in both color fundus and autofluorescent images. Blue arrows indicate transplanted hiPSC-RPE, and the white arrows indicate the sites of microsecond pulse laser treatment. (E) Optical coherence tomography (OCT) images after iPSC-RPE strip transplantation to the RPE-damaged site. (F) Fluorescent retinal angiography examination after iPSC-RPE strip transplantation to the RPE-damaged site. The yellow dotted line shows the site of the microsecond pulse laser treatment and hiPSC-RPE strips expanded and block choroidal fluorescence. (G)Temporal change in the ONL thickness at the laser ablation site with or without transplantation. ONL thickness for both the transplant and non-transplant areas within laser injury site was measured at three locations (yellow bars) in the OCT images of the corresponding section throughout the observation period. The ONL thickness of the transplant site was shown as a mean ± sd ratio to that of the laser-only non-transplanted area. At all-time points, there was no significant difference in ONL thickness between the laser-only and implanted sites. ONL outer nuclear layer, INL inner nuclear layer.
Figure 4
Figure 4
Histology of hiPSC-RPE strip transplant at an RPE-damaged site (M4). (A) Low magnified hematoxylin and eosin (HE) image and the immunostaining image of the neighboring section with anti-human MERTK (hMERTK) and − RPE65 antibody in the hiPSC-RPE strip transplanted area over RPE damage. Yellow line indicates MERTK positive grafted area. (B) Immunostaining image of hMERTK and rhodopsin. Yellow line indicates hMERTK positive grafted area. (C) Engrafted RPE cells are positive for STEM121 and hMERTK on the apical side (arrows) while host RPE cells at the border show only autofluorescence but not STEM121 or hMERTK positivity (C’). (D) hMERTK on the apical side of transplanted RPE cells (arrows) face and interact with rhodopsin-positive outer segments of host photoreceptors. (E) Immunohistochemistry of type IV collagen in intact and RPE-damaged sites at 2 days after laser treatment. Expression of type IV collagen is disrupted after microsecond pulse laser treatment. (F) Expression analysis of type IV collagen in the intact, laser-damaged, and transplant sites. Expression of type IV collagen is identified at the basement membrane of transplanted RPE. (G) Expression analysis of type IV collagen at the basement membrane of hMERTK-positive RPE cells. Magnified view of yellow boxed part on the right. ONL outer nuclear layer, INL inner nuclear layer. Scale bars: (A) 200 μm, (B) 100 μm, (C,D) 10 μm, (E) 50 μm, (F) 100 μm, (G) 50 μm.
Figure 5
Figure 5
Temporal changes in engrafted area and graft thickness of hiPSC-RPE from baseline at 1 week after transplantation. (A) Changes in engrafted hiPSC-RPE. The graft area was calculated as a ratio to that at 1 week after transplantation as the baseline. The graft area was manually traced at the engrafted site which was well identified in the images of all time points. Examples of manual tracing using autofluorescence images are shown on top panels. FA images were also referred to determine the graft area as shown in the right top. (B) Changes in the thickness of the transplanted iPS-RPE. The thickness was calculated as a fold change than observed at 1 week after transplantation by the maximum thickness using the same sectional view of optical coherence tomography (OCT) images.

Similar articles

Cited by

References

    1. Fernandes RAB, et al. Development of a new tissue injector for subretinal transplantation of human embryonic stem cell derived retinal pigmented epithelium. Int. J. Retina Vitreous. 2017;3:41. doi: 10.1186/s40942-017-0095-6. - DOI - PMC - PubMed
    1. da Cruz L, et al. Phase 1 clinical study of an embryonic stem cell-derived retinal pigment epithelium patch in age-related macular degeneration. Nat. Biotechnol. 2018;36:328–337. doi: 10.1038/nbt.4114. - DOI - PubMed
    1. Kashani AH, et al. A bioengineered retinal pigment epithelial monolayer for advanced, dry age-related macular degeneration. Sci. Transl. Med. 2018;10:eaa04097. doi: 10.1126/scitranslmed.aao4097. - DOI - PubMed
    1. Mandai M, et al. Autologous induced stem-cell-derived retinal cells for macular degeneration. N. Engl. J. Med. 2017;376:1038–1046. doi: 10.1056/NEJMoa1608368. - DOI - PubMed
    1. Schwartz SD, et al. Embryonic stem cell trials for macular degeneration: A preliminary report. Lancet. 2012;379:713–720. doi: 10.1016/S0140-6736(12)60028-2. - DOI - PubMed

Publication types

MeSH terms