. 2024 May 2;7(1):110.
doi: 10.1038/s41746-024-01123-7.

Constructing personalized characterizations of structural brain aberrations in patients with dementia using explainable artificial intelligence

Affiliations

Constructing personalized characterizations of structural brain aberrations in patients with dementia using explainable artificial intelligence

Esten H Leonardsen et al. NPJ Digit Med. .

Abstract

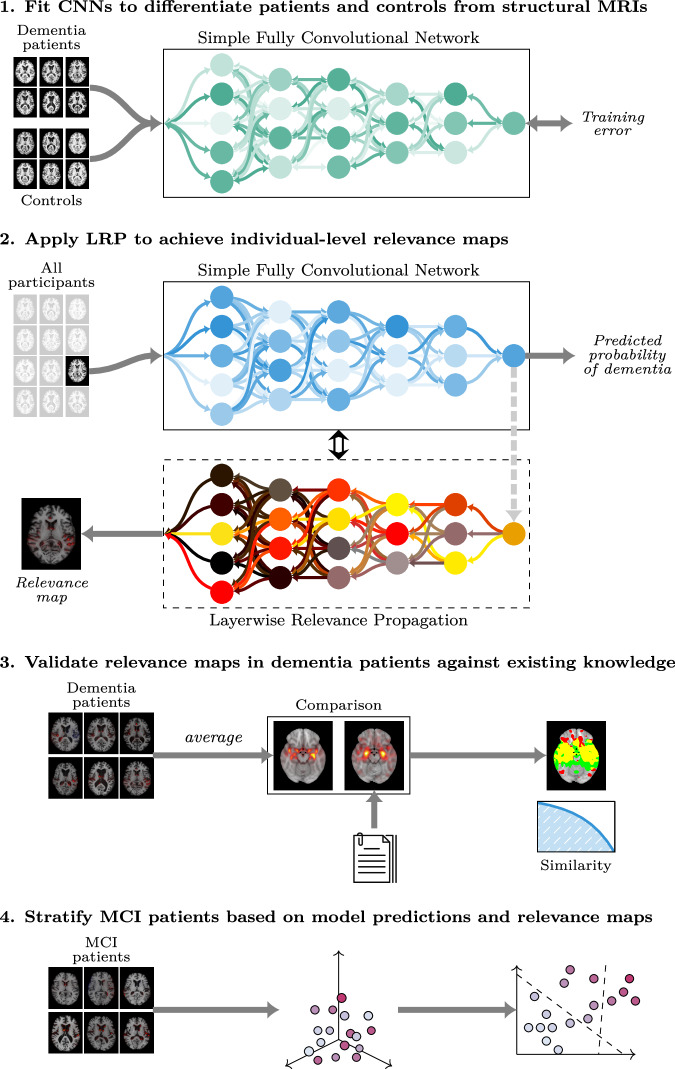
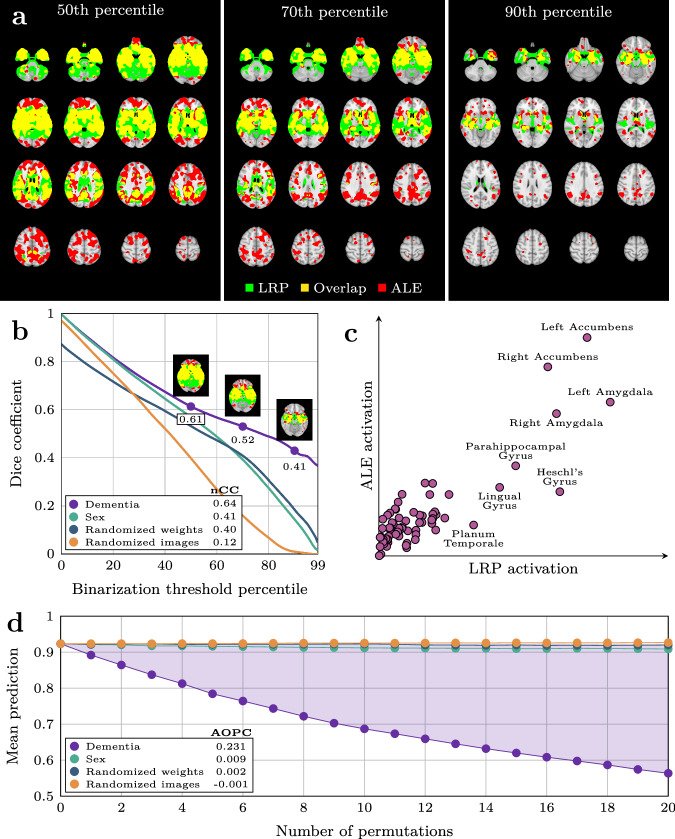
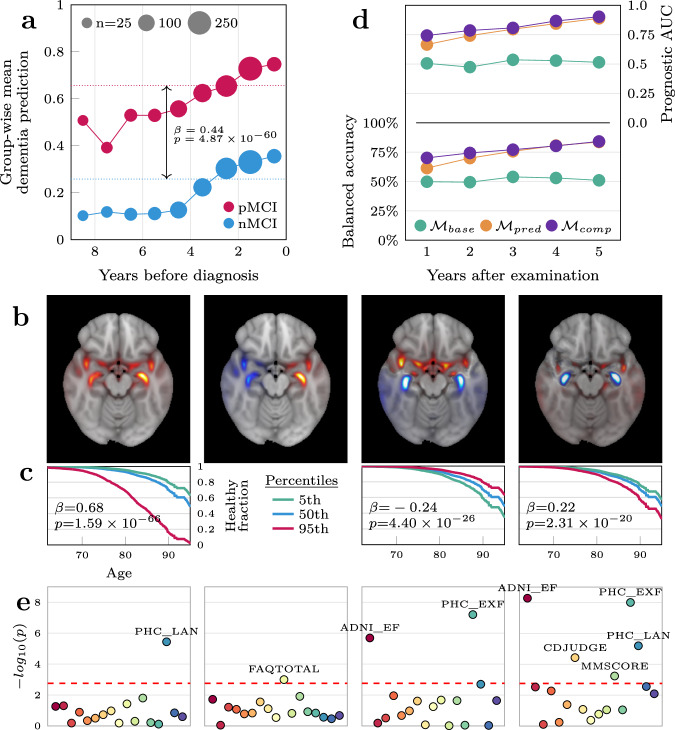
Deep learning approaches for clinical predictions based on magnetic resonance imaging data have shown great promise as a translational technology for diagnosis and prognosis in neurological disorders, but its clinical impact has been limited. This is partially attributed to the opaqueness of deep learning models, causing insufficient understanding of what underlies their decisions. To overcome this, we trained convolutional neural networks on structural brain scans to differentiate dementia patients from healthy controls, and applied layerwise relevance propagation to procure individual-level explanations of the model predictions. Through extensive validations we demonstrate that deviations recognized by the model corroborate existing knowledge of structural brain aberrations in dementia. By employing the explainable dementia classifier in a longitudinal dataset of patients with mild cognitive impairment, we show that the spatially rich explanations complement the model prediction when forecasting transition to dementia and help characterize the biological manifestation of disease in the individual brain. Overall, our work exemplifies the clinical potential of explainable artificial intelligence in precision medicine.


Conflict of interest statement

K.P. report work with Roche BN29553 and Novo Nordisk NN6535-4730 trials; All other authors declare that they have no competing interests.

Figures

Fig. 1
Fig. 1. Overview of the modeling process.
The modeling process consisted of four sequential steps. First, we fit multiple Simple Fully Convolutional Networks to classify dementia patients and healthy controls based on structural MRIs. Then we applied the best models to generate out-of-sample predictions and relevance maps for all participants. Next, we validated the relevance maps against existing knowledge using a meta-analysis to generate a statistical reference map. Finally, we employed the full pipeline in an exploratory analysis to stratify patients with mild cognitive impairment (MCI).
Fig. 2
Fig. 2. Validation of relevance maps from the dementia pipeline compared with three alternative pipelines.
a Visualization of the comparison between the binarized average relevance map R¯dementia from the dementia-pipeline and the binarized statistical reference map G from GingerALE, at different thresholds for binarization. b Overlap between the four average relevance maps R¯ from our four pipelines and G as a function of the binarization threshold. The numbers in the legend denote the normalized Cross Correlation (nCC) for each pipeline. c Mean voxel-wise activation in R¯dementia and G, grouped by brain region. d Average participant-wise prediction from the dementia model after iteratively masking out regions of the image according to relevance maps from the four pipelines. Area over the permutation curve (AOPC) for the dementia map is indicated by the shaded area and denoted in the legend for all pipelines.
Fig. 3
Fig. 3. Utility of the dementia pipeline for predicting progression and characterizing individual-level deviations in the mild cognitive impairment cohort.
a Group-wise mean predictions from the dementia-model in the progressive and non-progressive groups in the years before a diagnosis was given. b The four first voxel-wise components of the principal component analysis plotted in MNI152-space. c Survival curves for the average MCI patient (blue) and fictitious patients at the extreme percentiles of the span for each component. The second component was not significant and is not shown. d Predictive performance of the three models predicting progression in the years following the MRI examination. The baseline model (Mbase) included only sex and age as covariates, the next model Mpred included the prediction from the dementia classifier as a predictor, while the final model Mcomp also added the component vectors representing the relevance maps. e Significance levels of correlations between the each of the four PCA components and various cognitive measures. The six annotated measures are composite language (PHC_LAN) and executive function (PHC_EXF) scores from the ADSP Phenotype Harmonization Consortium, total score from the Functional Activities Questionnaire (FAQTOTAL), composite executive function score from UW – Neuropsych Summary Scores (ADNI_EF), clinical evaluation of impairment related to judgment and problem-solving (CDJUDGE) from the Clinical Dementia Rating, and an overall measure of cognition from the Mini-Mental State Examination (MMSCORE, commonly referred to as MMSE).
Fig. 4
Fig. 4. A visualization of the proposed morphological record for a randomly selected progressive MCI patient that was held out of all models and analyses.
a The top half shows the prediction from the dementia model at each visit, while the bottom part displays the relevance map underlying the prediction. The opaque sections (including c, d, and e) contain information accessible at the imagined current timepoint (22.02.07) to support a clinician in a diagnostic procedure. The angle () represents the change in dementia prediction per year based on the first two visits. b Translucent regions reveal the morphological record for the remaining follow ups in the dataset, thus depicting the future. The ground truth diagnostic trajectory is encoded by the color of the markers. c Predicted probabilities of progression at future follow-ups based on the prediction and relevance map at the current timepoint. d Survival curve of the patient compared to the average MCI patient calculated from the prediction and relevance map. The marker indicates the location of the patient at the current timepoint. e A list of cognitive domains where the patient is predicted to significantly differ from the average based on the prediction and relevance map.

References

    1. Woo C-W, Chang LJ, Lindquist MA, Wager TD. Building better biomarkers: brain models in translational neuroimaging. Nat. Neurosci. 2017;20:365–377. doi: 10.1038/nn.4478. - DOI - PMC - PubMed
    1. Bethlehem RaI, et al. Brain charts for the human lifespan. Nature. 2022;604:525–533. doi: 10.1038/s41586-022-04554-y. - DOI - PMC - PubMed
    1. Marek S, et al. Reproducible brain-wide association studies require thousands of individuals. Nature. 2022;603:654–660. doi: 10.1038/s41586-022-04492-9. - DOI - PMC - PubMed
    1. Arbabshirani MR, Plis S, Sui J, Calhoun VD. Single subject prediction of brain disorders in neuroimaging: promises and pitfalls. NeuroImage. 2017;145:137–165. doi: 10.1016/j.neuroimage.2016.02.079. - DOI - PMC - PubMed
    1. Sui J, Jiang R, Bustillo J, Calhoun V. Neuroimaging-based individualized prediction of cognition and behavior for mental disorders and health: methods and promises. Biol. Psychiatry. 2020;88:818–828. doi: 10.1016/j.biopsych.2020.02.016. - DOI - PMC - PubMed