. 2024 Sep;8(9):1124-1141.
doi: 10.1038/s41551-024-01211-9. Epub 2024 May 2.

Transient pacing in pigs with complete heart block via myocardial injection of mRNA coding for the T-box transcription factor 18

Affiliations

Transient pacing in pigs with complete heart block via myocardial injection of mRNA coding for the T-box transcription factor 18

David W Wolfson et al. Nat Biomed Eng. 2024 Sep.

Abstract

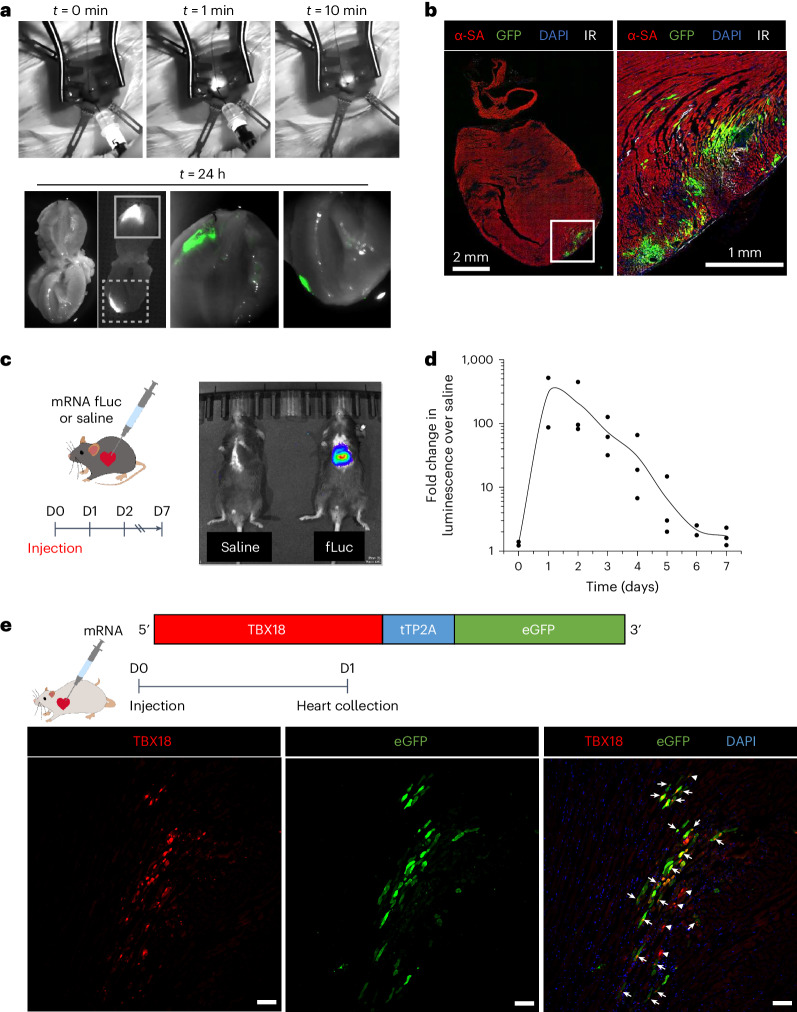
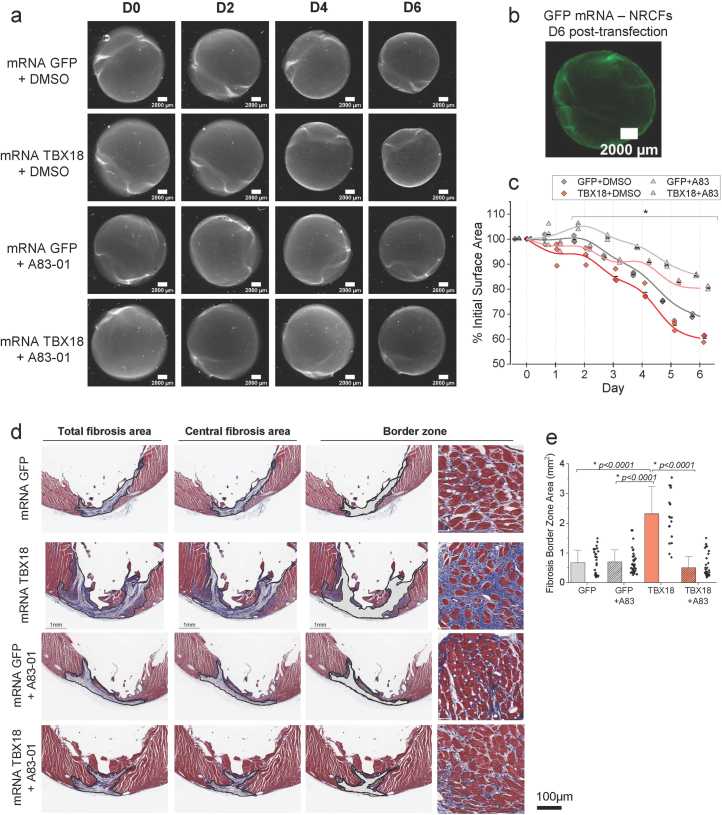
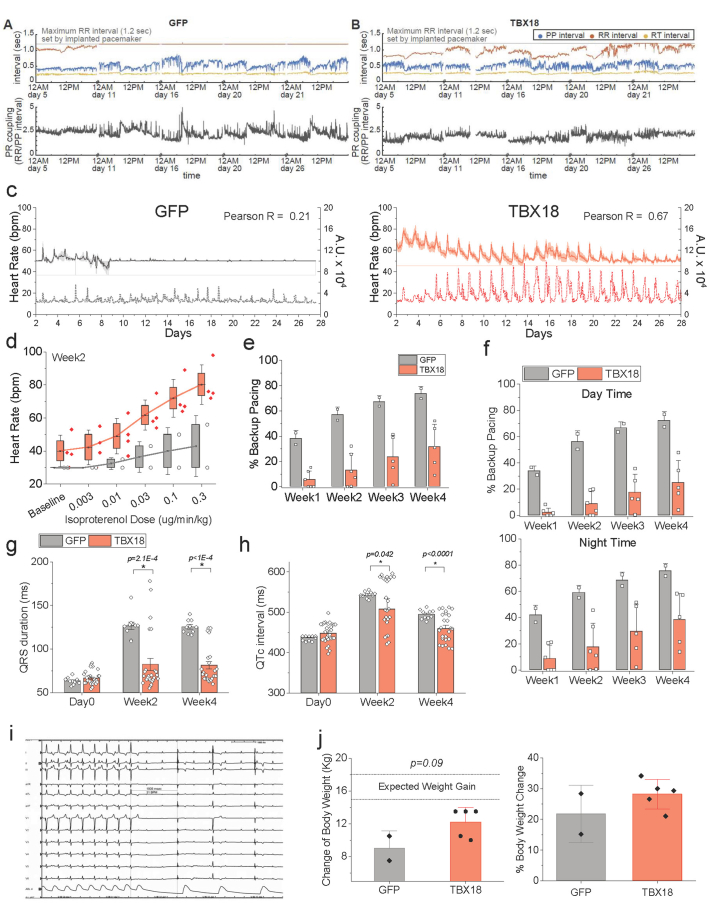
The adenovirus-mediated somatic transfer of the embryonic T-box transcription factor 18 (TBX18) gene can convert chamber cardiomyocytes into induced pacemaker cells. However, the translation of therapeutic TBX18-induced cardiac pacing faces safety challenges. Here we show that the myocardial expression of synthetic TBX18 mRNA in animals generates de novo pacing and limits innate and inflammatory immune responses. In rats, intramyocardially injected mRNA remained localized, whereas direct myocardial injection of an adenovirus carrying a reporter gene resulted in diffuse expression and in substantial spillover to the liver, spleen and lungs. Transient expression of TBX18 mRNA in rats led to de novo automaticity and pacemaker properties and, compared with the injection of adenovirus, to substantial reductions in the expression of inflammatory genes and in activated macrophage populations. In rodent and clinically relevant porcine models of complete heart block, intramyocardially injected TBX18 mRNA provided rate-adaptive cardiac pacing for one month that strongly correlated with the animal's sinus rhythm and physical activity. TBX18 mRNA may aid the development of biological pacemakers.


Conflict of interest statement

The authors have filed a patent (WO2019169228) related to this work.

Figures

Fig. 1
Fig. 1. Myocardial gene transfer of synthetic mRNA is rapid and transient.
a, Representative time-lapse GFP fluorescence images from Adv GFP- or mRNA GFP-treated NRVMs (n = 3 wells each). Scale bars, 150 μm. b,c, The mean GFP fluorescence of mRNA GFP (n = 3 wells) and Adv GFP (n = 3 wells) during the first 15 h (b) and 15 days (c) post-gene transfer. Mean ± s.d. *P < 0.05, temporal comparisons with two-way repeated measures ANOVA with Tukey’s test. d, Representative flow cytometry contour of GFP expression in α-SA+/− cells 1 day post-transfection with mRNA GFP (n = 3 wells). Each well was sorted between α-SA+ cardiomyocytes (left) and α-SA non-myocytes (right), before GFP gating. e, The proportion of GFP+ cells was significantly higher in myocytes versus non-myocytes (n = 3 wells). Mean ± s.d. *P < 0.05, two-sided two-sample t-test. FSC, forward scatter; FITC, fluorescein isothiocyanate.
Fig. 2
Fig. 2. TBX18 mRNA reprogrammes primary ventricular myocytes to pacemaker cells.
a, A representative 8 s recording of extracellular potential changes with MEA (n = 31 MEAs). Scale bar, 2 s. b,c, Spontaneous beats recorded per MEA (b) and beat rate frequencies at day 3 (c) were significantly higher for mRNA TBX18-transfected NRVMs over GFP in the days following transfection (n = 31 MEAs per group, mean ± s.e.m., *P < 0.05, two-sided t-test comparison GFP versus TBX18 at each timepoint). d, Quantitative PCR of Hcn4 transcript levels was significantly higher in mRNA TBX18-transfected compared with mRNA GFP-transfected NRVMs on D3 post-transfection (n = 6 wells, mean ± s.e.m., *P < 0.05, one-sided two-sample t-test). e, Representative fluorescence images from Hcn4/GFP Tg NMVMs transfected with mRNA fLuc or mRNA TBX18 (top), or transduced with Adv mCherry or Adv TBX18-DsRed (bottom). Scale bars, 100 µm. The experiment was repeated independently twice. f, The mean proportion of Hcn4/GFP-expressing nuclei was significantly higher for both mRNA TBX18 and Adv TBX18, compared with their respective controls. n = 10 wells. *P < 0.05, two-way ANOVA with Tukey’s test (P values reported in Supplementary Tables 1 and 2). Box plot, 25th–75th percentiles; centre, mean; whisker, 10th–90th percentiles. No differences observed between doses. g, Representative colour contour plots of voltage activation time across NRVM monolayers transfected with mRNA fLuc (left) or mRNA TBX18 (right). h, The mean conduction velocity measured from contour maps at various pacing frequencies was significantly lower in mRNA TBX18-transfected monolayers (n = 8) compared with mRNA fLuc (n = 9). *P < 0.05, two-way repeated measures ANOVA with Tukey’s test. i, Immunoblotting revealed significantly lower Cx43 protein in mRNA TBX18-transfected NRVMs, compared with GFP (alternating wells, n = 6 wells, *P < 0.05, one-sided two-sample t-test). Mean ± s.d. DsRed is a red fluorescent protein from a corallimorpharian of the Discosoma genus. Source data
Fig. 3
Fig. 3. Myocardial transfection of naked mRNA in vivo.
a, Injection of Dylight-tagged GFP mRNA at the rat LV apex. The injection site was observed for 10 min to confirm tissue retention. Twenty-four hours post-injection, the heart was cut via the frontal plane. Solid and dashed magnified insets (bottom right) show GFP fluorescence overlap with areas of Dylight mRNA. b, Immunostained GFP+ myocytes at the injection site 1 day post mRNA GFP injection (left) with magnified inset (right). The experiment was repeated independently twice. c, Mice injected with either mRNA fLuc or saline at the LV apex were imaged daily with IVIS. mRNA fLuc-injected mice showed bioluminescence signal localized to the thoracic cage, 1 day following injection. D, day. d, Daily bioluminescence normalized to saline-injected mice shows transient expression of mRNA fLuc for <7 days (n = 3 mice). e, Myocardial injection of naked TBX18-tTP2A-eGFP mRNA leads to expression of TBX18 with GFP reporter in successfully transfected cells in rats. The experiment was repeated independently twice (arrows, TBX18 and GFP expression in same cell; arrowheads, TBX18 expression without GFP). DAPI, 4′,6-diamidino-2-phenylindole.
Fig. 4
Fig. 4. Naked myocardial mRNA delivery is focal, with minimal immune responses in vivo.
a, Representative IVIS images of isolated organs from Adv fLuc- (left) and mRNA fLuc- (right) injected rats. D, day. b, The saline-normalized luminescence flux was significantly higher in off-target organs of Adv fLuc-injected rats (n = 7). Box, mean ± s.e.m. Dashed line, saline. *P < 0.05, one-sided Mann–Whitney U test. c, Representative images of Adv GFP- and mRNA GFP-injected hearts at LV apex. CD8a-immunostained (white) infiltrating leukocytes surrounded GFP-expressing cells. Black arrows, areas of changed tissue morphology. White arrows, areas of high-density nuclei. Scale bars, 500 μm. The experiment was repeated independently twice. d, A quantitative PCR panel of fold change gene expression for select cytokines, chemokines and interferons in hearts 7 days post-injection of Adv GFP, mRNA GFP or saline (n = 3). *P < 0.05, one-way ANOVA with Tukey’s test. Top P value, Adv GFP versus mRNA GFP. Bottom P value, Adv GFP versus saline. n.s., not significant.
Fig. 5
Fig. 5. TBX18 mRNA-induced ventricular pacing in a small animal model of CAVB.
a, Schematic of in vivo study design. b, A representative telemetry ECG strip of mRNA GFP (left) or mRNA TBX18 (right) rats (n = 7 rats TBX18, n = 5 rats GFP). Arrows, fast negative polarity beats; circles, slow junctional escape rhythm. c, Daily mean heart rate ± s.e.m was higher for mRNA TBX18 over 2 weeks post-injection. Dashed line, average baseline for all rats before mRNA injection. Mean centre point ± s.e.m. *P < 0.05, two-way ANOVA repeated measures with Tukey’s test. d, Representative beat rate histograms for mRNA TBX18 (top) and GFP (bottom) rats on day (D)7. e, The average heart rate s.d. ± standard deviation of s.d. (SDSD) was higher for mRNA TBX18 over GFP. Error bands represent s.d. *P < 0.05, two-way ANOVA repeated measures with Tukey’s test. f, TBX18-treated rats showed significantly higher ISO-induced (3 mg kg−1, i.p.) increases in heart rate. *P < 0.05, one-sided Mann–Whitney U test. n = 5 TBX18 rats, n = 4 GFP. Average ± s.d. recorded from surface ECG. g, Daily average heart rate ± s.e.m. comparison between CAVB rats treated with mRNA TBX18 (solid) or Adv TBX18 (dashed).
Fig. 6
Fig. 6. TBX18-induced electrophysiological changes in adult cardiomyocytes in vivo.
a, Langendorff-perfused rat hearts extracted at 3 days post-mRNA injection. The experiment was repeated independently twice. b, Voltage optical mapping contour plots with Di-4-ANEPPS revealed a de novo pacing site near the site of injection (grey circle) in TBX18 mRNA-injected rats following ablation of the AV node (bottom right). No change in electrical propagation was observed under normal sinus rhythm for all rats (top). Simultaneous electrical potential recordings show a change in polarity after AV ablation in TBX18 (above contour) (n = 7 rats TBX18, n = 3 rats GFP). c, An experimental schematic of a sharp electrode recording from Langendorff-perfused rat hearts from the site of injection (arrow) on the LV free wall. LA, left atrium. d, Representative traces of action potentials recorded at the site of injection (n = 7 rats TBX18, n = 3 rats GFP). e, Current plots with expanded inset (right) reveal sharp upstroke velocity in GFP, whereas TBX18s show slow phase 4 current.
Fig. 7
Fig. 7. mRNA TBX18 provides heart rate control and chronotropic competence in CAVB pigs.
a, Large animal study design. b, Representative ECG telemetry traces with P and R waves labelled via a machine-learning algorithm. Labelled ECGs reveal correlated shortening of both PP and RR intervals in TBX18 pigs (bottom right). c, One-minute averaged ventricular rate, showing circadian cycle and higher heart rates during the 4-week study period in mRNA TBX18 compared with GFP. d, The maximum 1-min rate, plotted for each hour, was significantly higher in mRNA TBX18 than control. e, The PR correlation for each pig plateaued above the GFP control in TBX18-treated pigs after the first week (n = 2 GFP, n = 4 TBX18). Mean ± s.e.m. f, The overall mean PR correlation was significantly higher in TBX18-treated pigs compared with GFP. *P < 0.05, one-sided two-sample t-test, mean ± s.e.m., n = 2 GFP, n = 4 TBX18 pigs over five timepoints. g, The total animal activity (dashed) plotted with heart rate (solid) ± s.d. (shaded area) for each representative pig in mRNA GFP (left) or mRNA TBX18 (right) groups in a 24-h period on day 15. h, ISO challenge test given at day (D)28 with increasing doses of β-adrenergic agonist isoprenaline (intravenously infused). Responding heart rates in the TBX18 group were significantly more sensitive, reaching a higher maximal compared with the GFP group (n = 2 pigs GFP, n = 4 pigs TBX18). *P < 0.05, two-way ANOVA repeated measures Tukey’s test, mean ± s.d. Box, 25th–75th percentiles; whisker, s.d.; centre, mean. i, VRT measured from the end of stimulation to the first spontaneous ventricular beat. Mean VRT was lower with mRNA TBX18 at D28 (n = 2 pigs GFP, n = 4 pigs TBX18). j, Representative NOGA images showing intracardiac propagation of antegrade conduction at the mRNA TBX18 injection site (high septal area) to the apex at D28 (right), similar to pre-AV node ablation (left). Red, earliest activation point.
Fig. 8
Fig. 8. Ventricular rate variability of TBX18 mRNA-paced pigs mimics the variability of their sinus rhythm.
a, Poincaré plots of PP intervals (blue) and RR intervals (red) at day 11 show minimal RR dispersion in GFP-treated pig (left), compared with TBX18 (right). b, Quantification of dispersion measured by oval fitting shows similar SD1 and SD2 values for PP intervals, but significantly lower RR interval SD2 in GFP control. c, Poincaré plot at day (D)11 of PR coupling (RR/PP ratio) in GFP and TBX18 pigs. d, Oval fitting analysis revealing significantly lower PR dispersion in TBX18-treated pigs. e, PSD on D11 of each interval (PP and RR) in the VLF range (<0.04 Hz). f, Spectral analysis revealing significantly higher RR interval complexity (αPSD) in TBX18-treated pigs versus GFP. g, DFA of intervals (PP and RR) on D11. h, TBX18 pigs had significantly higher RR complexity (αDFA), compared with GFP. In b, d, f and h, mean ± s.e.m. for all pigs on days 5, 11, 16, 20 and 26 combined. *P < 0.05, one-sided two-sample t-test. n = 2 GFP, n = 4 TBX18 pigs over five timepoints.
Extended Data Fig. 1
Extended Data Fig. 1. In vitro functional characterization of TBX18 mRNAderived pacemaker cells.
a, Normalized TBX18 mRNA transcript level relative to Gapdh in NRVMs treated with Adv TBX18 or mRNA TBX18 (n = 4 wells, Mean + /-SD). b, Normalized TBX18 protein expression relative to Gapdh in NRVMs post-gene transfer (n = 4 wells, Mean + /-SEM). Quantified TBX18 expression was normalized to peak TBX18 expression for each vector. Representative Western Blot stained for TBX18 (green) and Gapdh (red) at time (hours) post-gene transfer. c, Percent of beating wells for mRNA TBX18- or GFP-transfected NRVMs. Beating MEA defined as averaging >5 bpm over a 30-minute recording. d, Mean number of beats per MEA in NRVMs transfected with various doses of IVT TBX18 (n = 9 MEAs, Mean + /-SEM) at 43-hours post-transfection. e, Transgenic scheme of Hcn4/GFP mice. SAN and AVN, expressing Hcn4, can be visualized with GFP. Only ventricles below the AVN were collected for isolation and culture. f, Representative fluorescence images from Hcn4/GFP Tg NMVMs transfected with 3 ng/k cells of mRNA (left), or transduced with Adv multiplicity of infection of 5 (right). Scale bar, 100 µm. Experiment repeated independently twice. g, Quantified number of GFP-expressing cells was higher in TBX18 NMVMs, compared to respective control. (n = 10 wells, Mean + /-SD, *p < 0.05 2-way ANOVA with Tukey’s test, See Supplementary Tables 3-4 for p value results). h, i, Relative expression levels of pacemaker-enriched genes found in isolated neonatal rat SAN tissues (n = 1 samples with 20 pooled independent tissues) (H) and mRNA TBX18-transfected NRVMs 14-days post transfection (n = 3 wells GFP, n = 6 wells TBX18, *p < 0.05 two-sided Mann-Whitney Test) (I). j, Measured conduction velocity of spontaneous beat propagations in transfected NRVM monolayers (n = 7 wells fLuc, n = 4 wells TBX18, Mean + /-SD, *p < 0.05 1-way ANOVA with Tukey’s test). Source data
Extended Data Fig. 2
Extended Data Fig. 2. IVT mRNA transfection in vivo by direct myocardial injection.
a, Immunostained images of hearts injected with either GFP mRNA (left), Adv (middle), or saline. Heart sections were co-stained for alpha-sarcomeric actinin (magenta, top). Focal GFP expression was observed in mRNA injected. Adv GFP injected showed widespread GFP fluorescence throughout the chamber wall with additional off-target fluorescence in the endothelial wall of the aorta (inset a). Experiment repeated independently twice. b, Temporal IVIS imaging of mice injected with either saline (left) or fLuc mRNA (right). Color maps represent intensity of detected bioluminescence signal (scale bar, right). These results were observed in 2 independent experiments (labeled top). c, Successful transfection of TBX18 mRNA in rat hearts, showing nuclear TBX18 expression in aSA+ cardiomyocytes. Dashed box, magnified area of interest. Experiment repeated independently twice.
Extended Data Fig. 3
Extended Data Fig. 3. Functional TBX18 IVT mRNA induced-biological pacing in vivo.
a, IVT TBX18- (top) or IVT GFP- (bottom) injected rats, ECG telemetry analyzed for 1-hour averaged heart rate +/- standard deviation plotted over the 2-week recording period for each rat (n = 7 TBX18, n = 5 GFP). b, Representative ECG telemetry strip of an IVT TBX18 (left) and GFP (right) rat at Day 14, when heart rate variability has significantly increased in TBX18-treated rats. Lead 1, top. Lead 2, bottom. c, Heart rate of TBX18 and GFP treated rats under anesthesia (baseline) and after bolus injection of isoproterenol at D14 (n = 4 rats GFP, n = 5 rats TBX18, Mean + /-SD). d, Daily average heart rate measured from ECG telemetry of rats treated with either GFP Adv or mRNA (n = 5 rats GFP mRNA, n = 4 rats GFP Adv, Mean + /-SEM). e, Average body weight relative to baseline +/- SEM for TBX18 (red) and GFP (gray) rats plotted at each time-point along the study (n = 5 rats TBX18, n = 4 rats GFP). *p < 0.05 2-way ANOVA repeated measures with subsequent Tukey’s test.
Extended Data Fig. 4
Extended Data Fig. 4. TBX18 mRNA-induced electrophysiological changes in adult cardiomyocytes in vivo.
a, Representative sharp electrode recordings from TBX18 mRNA-injected rat hearts at a remote site (left) and injection site (right). b, RNAscope imaging of rat hearts injected with either TBX18-GFP mRNA (top), GFP mRNA (middle), or unstained (bottom) at 1 day post-injection. Heart sections were co-stained with anti-GFP, Gja1 probe, and DAPI (left to right). White arrows denote nuclei for reference. Scale bar, 50 um. Experiment repeated independently twice.
Extended Data Fig. 5
Extended Data Fig. 5. Delivery of mRNA and A83-01 in pigs.
a, Representative fluoroscopy images showing injection of mRNA and iopamidol solution to the interventricular septum. Red arrows indicate site of injection. b, Naked mRNA mixed with various concentrations of iopamidol (contrast agent) injected to the LV apex of rats. Iopamidol (0–20%) had no effect on successful transfection of GFP mRNA. Suture marks site of injection. Experiment repeated independently twice. c, Implantation of osmotic pumps to the subcutaneous space of the porcine lower abdomen for systemic delivery of A83-01. d, Weekly mean heart rate. e, Weekly 1 minute max heart rate. D, E n = 2 GFP pigs, n = 5 TBX18 pigs, Mean + /-SEM.
Extended Data Fig. 6
Extended Data Fig. 6. Fibroblast activation and cardiac fibrosis are reduced by treatment with A83-01.
a, Collagen gel contraction assay revealed TBX18-transfected fibroblasts significantly increased the rate of collagen contraction over the course of 6-days. Scale bar, 2 mm. Experiment repeated independently twice. b, Representative fluorescence image of collagen gel loaded with GFP-transfected fibroblasts. Experiment repeated independently twice. c, Surface area of collagen gels was measured each day from stereoscope images. Treatment with A83-01 reduced the rate of contraction for all groups (n = 3 gels, *p < 0.05 2-Way ANOVA repeated measures with Bonferroni test. p-value results in Supplementary Table 5). d, Representative Masson’s Trichrome stain and measurement of total fibrosis (left), central fibrosis lacking red-stained myocytes (middle), and remaining border zone area (right). Inset shows magnified border zone area with collagen interweaving myocytes. Experiment repeated independently twice. e, Fibrosis border zone area, measured from stained heart slices, is significantly higher in TBX18-injected rats, which was significantly reduced with co-treatment of A83 (n = 3 rats, Mean + /-SD, 2-Way ANOVA with Tukey’s Test).
Extended Data Fig. 7
Extended Data Fig. 7. TBX18 mRNA supports higher heart rates and chronotropic competence in CAVB pigs.
a, b, Representative 24-hour plots on select days reveal day-day fluctuations in RR and PP intervals (top) and calculated PR coupling ratio (bottom) from pigs in each group. RR interval of the GFP control pig is at the maximal interval allowed by the back-up pacemaker (1.2 s, 50 bpm, gray line), indicating near complete pacemaker device dependence. c, Activity-HR plots for the full 28-day study period. Total activity was highly correlated with heart rate in TBX18 vs. GFP (Pearson coefficient, R = 0.67 vs. R = 0.21 respectively). d, Isoproterenol challenge test given at D14 with increasing doses of beta-adrenergic agonist, isoproterenol (i.v. infused, n = 2 GFP pigs, n = 4 TBX18 pigs, Mean +/- SD, Box 25–75 percentile, Whisker SD, Center mean). e, Proportion of ventricular beats paced by backup pacemaker. f, Pacemaker dependency was lower in day time (top) than night time (bottom). E,F n = 2 GFP pigs, n = 5 TBX18 pigs, Mean + /-SD. g, h, ECG parameters, QRS duration (G) and QT interval (H) were significantly shorter in mRNA TBX18 compared to GFP, following AV ablation and mRNA delivery. Mean +/- SEM. (n = 10 GFP, n = 25 TBX18). G, *p < 0.05 One-sided Two-sample t test, GFP vs. TBX18 at each time point. H, *p < 0.05 One-sided Two-sample t test with Welch Correction, GFP vs. TBX18 at each time point. i, Representative ECG trace of VRT measurement. j, Increase in body weight for each pig in relation to expected weight gain for healthy pigs (top). TBX18-treated pigs on average had a higher % increase in body weight compared to GFP (bottom). (n = 2 GFP pigs, n = 5 TBX18 pigs, Mean + /-SD, Two-sided Two-sample t Test).
Extended Data Fig. 8
Extended Data Fig. 8. TBX18-treated pigs show lower PR coupling variation than GFP-treated.
a, Representative power spectral density curves for GFP and TBX18 pigs at D11 (left, middle). Spectral analysis of PR coupling revealed TBX18-treated pigs have a lower average slope (αPSD) in the VLF domain, though not significant. Mean +/- SEM. Measured for all pigs (n = 2 GFP or 5 TBX18) at 5 different time points. b, Representative detrended fluctuation analysis of PR coupling for all pigs at D11 (left & middle). Fractal complexity measured by the slope (αDFA) showed TBX18 pigs had significantly lower PR complexity compared to GFP. Mean +/- SEM. Measured for all pigs (n = 2 GFP or 5 TBX18) at 5 different time points. *p < 0.05 Two-sided Two-sample t test.
Extended Data Fig. 9
Extended Data Fig. 9. PES results for all subjects. Induction or non-induction of arrhythmia with PES +/- Isoproterenol, β-adrenergic stimulation.
a, Representative surface ECG results of GFP and TBX18-treated rats (n = 6 rats TBX18, n = 5 rats GFP). Arrows indicate when electrical stimulation was applied. No rats showed sustained tachyarrhythmias (>30 s). Both treatments showed similar prevalence of inducible non-sustained arrhythmias. b, c Representative surface ECG traces of GFP and TBX18-treated pigs with inducible non-sustained ventricular tachycardia (NSVT). Akin to rats, prevalence of arrhythmia was similar between treatments in pigs. d, Telemetry ECG trace of spontaneous ventricular fibrillation in a pig treated with TBX18 mRNA.
Extended Data Fig. 10
Extended Data Fig. 10. Echocardiography of LV chamber dimension and functional changes before and after the study.
TBX18 (red), GFP (gray). Measurements made with M-mode. a, Left ventricular end systolic diameter. b, Left ventricular end diastolic diameter. c, Left ventricular fractional shortening. d, Left ventricular ejection fraction. e, Left ventricular end systolic volume. f, Left ventricular end diastolic volume. g, Stroke volume. h, Representative M-mode echo images at baseline and week4. All pigs showed LV chamber dilation, most notably by diastolic diameter and volume increase. Enlarged LV chambers resulted in significantly higher stroke volume by the end of the study. No statistical differences were measured between treatment groups. Mean +/- SD. (n = 2 GFP, 5 TBX18, 2-way ANOVA) i, Histological staining of pig heart tissues collected near the site of AV ablation show similar amounts of necrosis and fibrosis in GFP-(top) and TBX18-(bottom) mRNA injected pigs. Experiment repeated independently twice. Scale bar, 2.5 mm.

References

    1. Villain, E. Indications for pacing in patients with congenital heart disease. Pacing Clin. Electrophysiol.31, S17–S20 (2008). - PubMed
    1. Connolly, S. J. et al. Effects of physiologic pacing versus ventricular pacing on the risk of stroke and death due to cardiovascular causes. Canadian Trial of Physiologic Pacing Investigators. N. Engl. J. Med.342, 1385–1391 (2000). - PubMed
    1. Amin, M. S., Matchar, D. B., Wood, M. A. & Ellenbogen, K. A. Management of recalled pacemakers and implantable cardioverter-defibrillators: a decision analysis model. JAMA296, 412–420 (2006). - PubMed
    1. Fortescue, E. B. et al. Patient, procedural, and hardware factors associated with pacemaker lead failures in pediatrics and congenital heart disease. Heart Rhythm1, 150–159 (2004). - PubMed
    1. Hauser, R. G. et al. Clinical experience with pacemaker pulse generators and transvenous leads: an 8-year prospective multicenter study. Heart Rhythm4, 154–160 (2007). - PubMed

LinkOut - more resources