

Robust language-based mental health assessments in time and space through social media
- PMID: 38698174
- PMCID: PMC11065872
- DOI: 10.1038/s41746-024-01100-0
Robust language-based mental health assessments in time and space through social media
Abstract
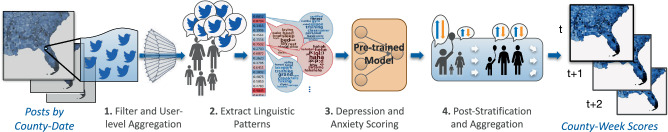
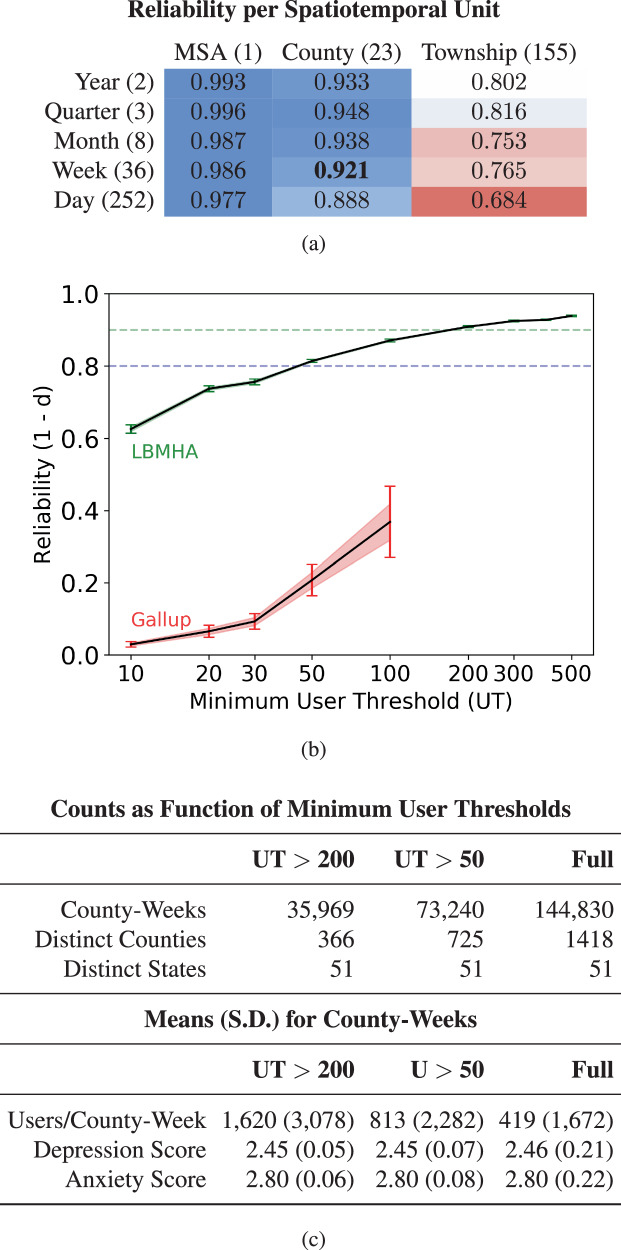
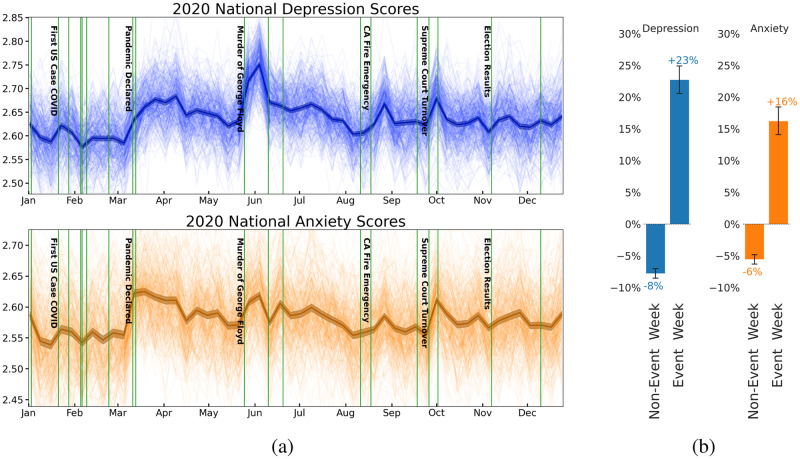
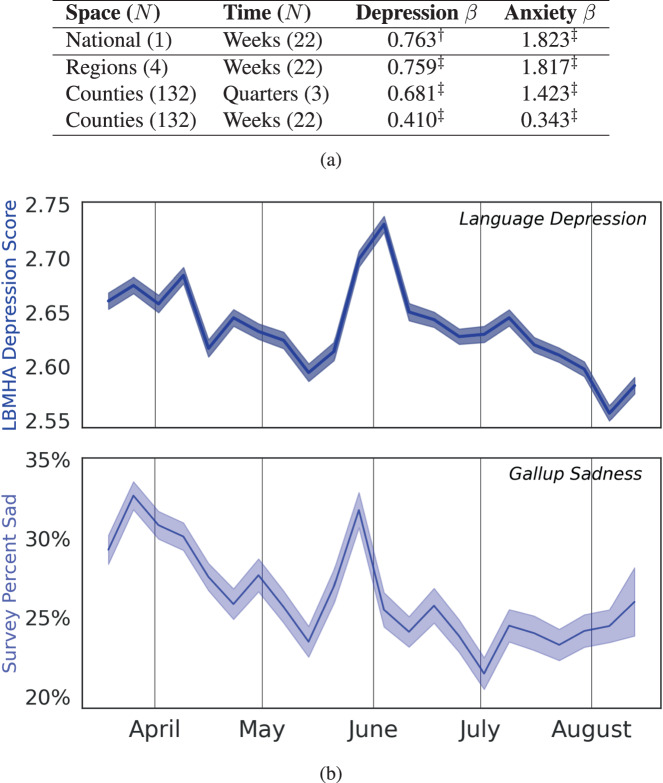
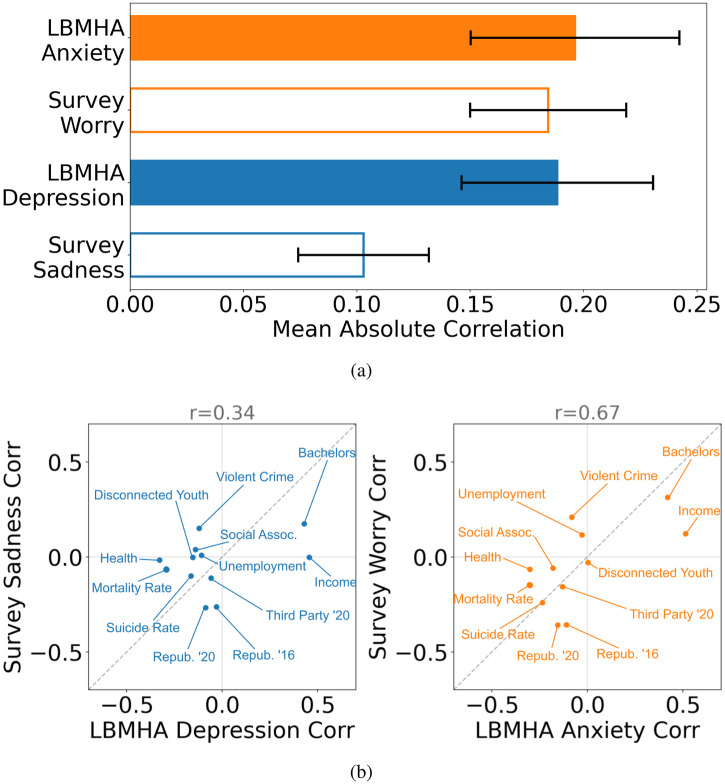
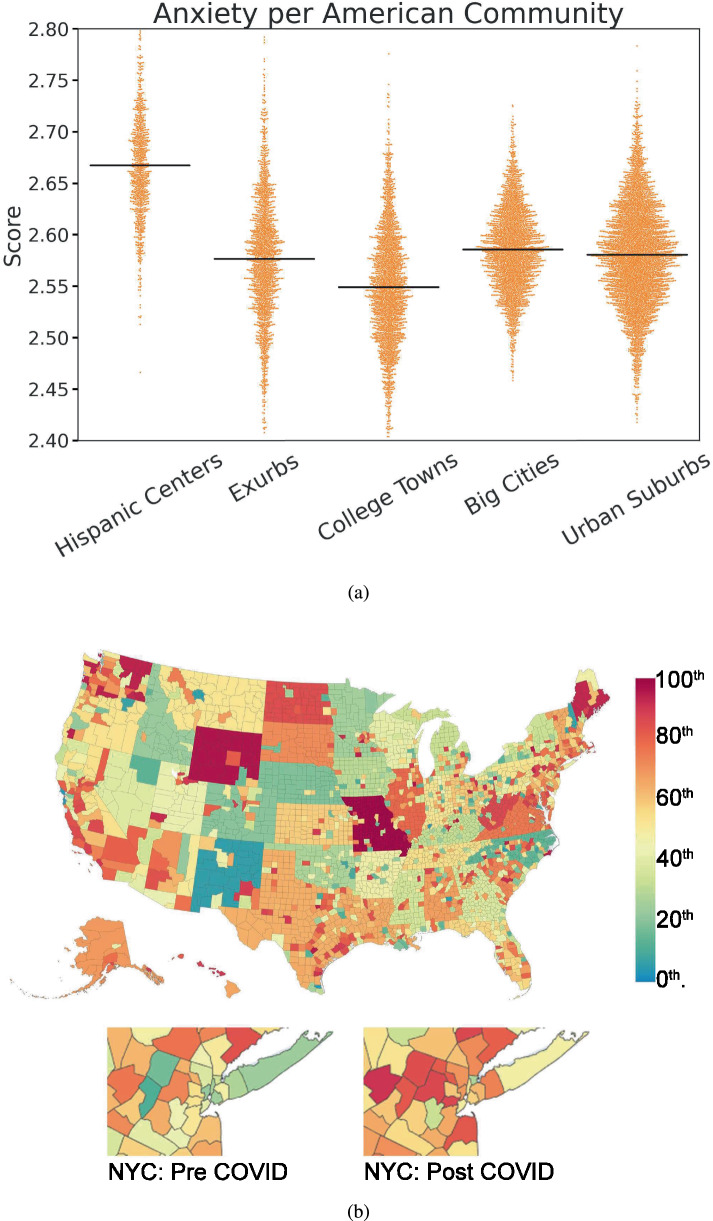
In the most comprehensive population surveys, mental health is only broadly captured through questionnaires asking about "mentally unhealthy days" or feelings of "sadness." Further, population mental health estimates are predominantly consolidated to yearly estimates at the state level, which is considerably coarser than the best estimates of physical health. Through the large-scale analysis of social media, robust estimation of population mental health is feasible at finer resolutions. In this study, we created a pipeline that used ~1 billion Tweets from 2 million geo-located users to estimate mental health levels and changes for depression and anxiety, the two leading mental health conditions. Language-based mental health assessments (LBMHAs) had substantially higher levels of reliability across space and time than available survey measures. This work presents reliable assessments of depression and anxiety down to the county-weeks level. Where surveys were available, we found moderate to strong associations between the LBMHAs and survey scores for multiple levels of granularity, from the national level down to weekly county measurements (fixed effects β = 0.34 to 1.82; p < 0.001). LBMHAs demonstrated temporal validity, showing clear absolute increases after a list of major societal events (+23% absolute change for depression assessments). LBMHAs showed improved external validity, evidenced by stronger correlations with measures of health and socioeconomic status than population surveys. This study shows that the careful aggregation of social media data yields spatiotemporal estimates of population mental health that exceed the granularity achievable by existing population surveys, and does so with generally greater reliability and validity.
© 2024. The Author(s).
Conflict of interest statement
The authors declare no competing interests.
Figures
Similar articles
-
Deployment of personnel to military operations: impact on mental health and social functioning.Campbell Syst Rev. 2018 Jun 1;14(1):1-127. doi: 10.4073/csr.2018.6. eCollection 2018. Campbell Syst Rev. 2018. PMID: 37131363 Free PMC article.
-
Investigating the relationship of COVID-19 related stress and media consumption with schizotypy, depression, and anxiety in cross-sectional surveys repeated throughout the pandemic in Germany and the UK.Elife. 2022 Jul 4;11:e75893. doi: 10.7554/eLife.75893. Elife. 2022. PMID: 35781372 Free PMC article.
-
The need for holistic, longitudinal and comparable, real-time assessment of the emotional, behavioral and societal impact of the COVID-19 pandemic across nations.Psychiatriki. 2021 Apr 19;32(1):15-18. doi: 10.22365/jpsych.2021.010. Epub 2021 Mar 8. Psychiatriki. 2021. PMID: 33759804 English, Greek, Modern.
-
[Psychometric characteristics of questionnaires designed to assess the knowledge, perceptions and practices of health care professionals with regards to alcoholic patients].Encephale. 2004 Sep-Oct;30(5):437-46. doi: 10.1016/s0013-7006(04)95458-9. Encephale. 2004. PMID: 15627048 Review. French.
-
Direct economic burden of mental health disorders associated with polycystic ovary syndrome: Systematic review and meta-analysis.Elife. 2023 Aug 3;12:e85338. doi: 10.7554/eLife.85338. Elife. 2023. PMID: 37534878 Free PMC article.
Cited by
-
Language use on Twitter reflects social structure and social disparities.Heliyon. 2023 Dec 12;10(2):e23528. doi: 10.1016/j.heliyon.2023.e23528. eCollection 2024 Jan 30. Heliyon. 2023. PMID: 38293550 Free PMC article.
-
Schizophrenia more employable than depression? Language-based artificial intelligence model ratings for employability of psychiatric diagnoses and somatic and healthy controls.PLoS One. 2025 Jan 8;20(1):e0315768. doi: 10.1371/journal.pone.0315768. eCollection 2025. PLoS One. 2025. PMID: 39774560 Free PMC article.
-
Detecting and tracking depression through temporal topic modeling of tweets: insights from a 180-day study.Npj Ment Health Res. 2024 Dec 6;3(1):62. doi: 10.1038/s44184-024-00107-5. Npj Ment Health Res. 2024. PMID: 39643656 Free PMC article.
References
-
- Substance Abuse and Mental Health Services Administration. Key substance use and mental health indicators in the United States: results from the 2019 national survey on drug use and health. HHS Publication no. 52, 17–5044 (2020).
-
- Case, A., Deaton, A., Deaths of Despair and the Future of Capitalism. (Princeton University Press, Princeton, New Jersey, 2020).
Grants and funding
LinkOut - more resources
Full Text Sources
