. 2024 Jun;9(6):1555-1565.
doi: 10.1038/s41564-024-01680-3. Epub 2024 May 2.

Oral bacteria relative abundance in faeces increases due to gut microbiota depletion and is linked with patient outcomes

Affiliations

Oral bacteria relative abundance in faeces increases due to gut microbiota depletion and is linked with patient outcomes

Chen Liao et al. Nat Microbiol. 2024 Jun.

Abstract

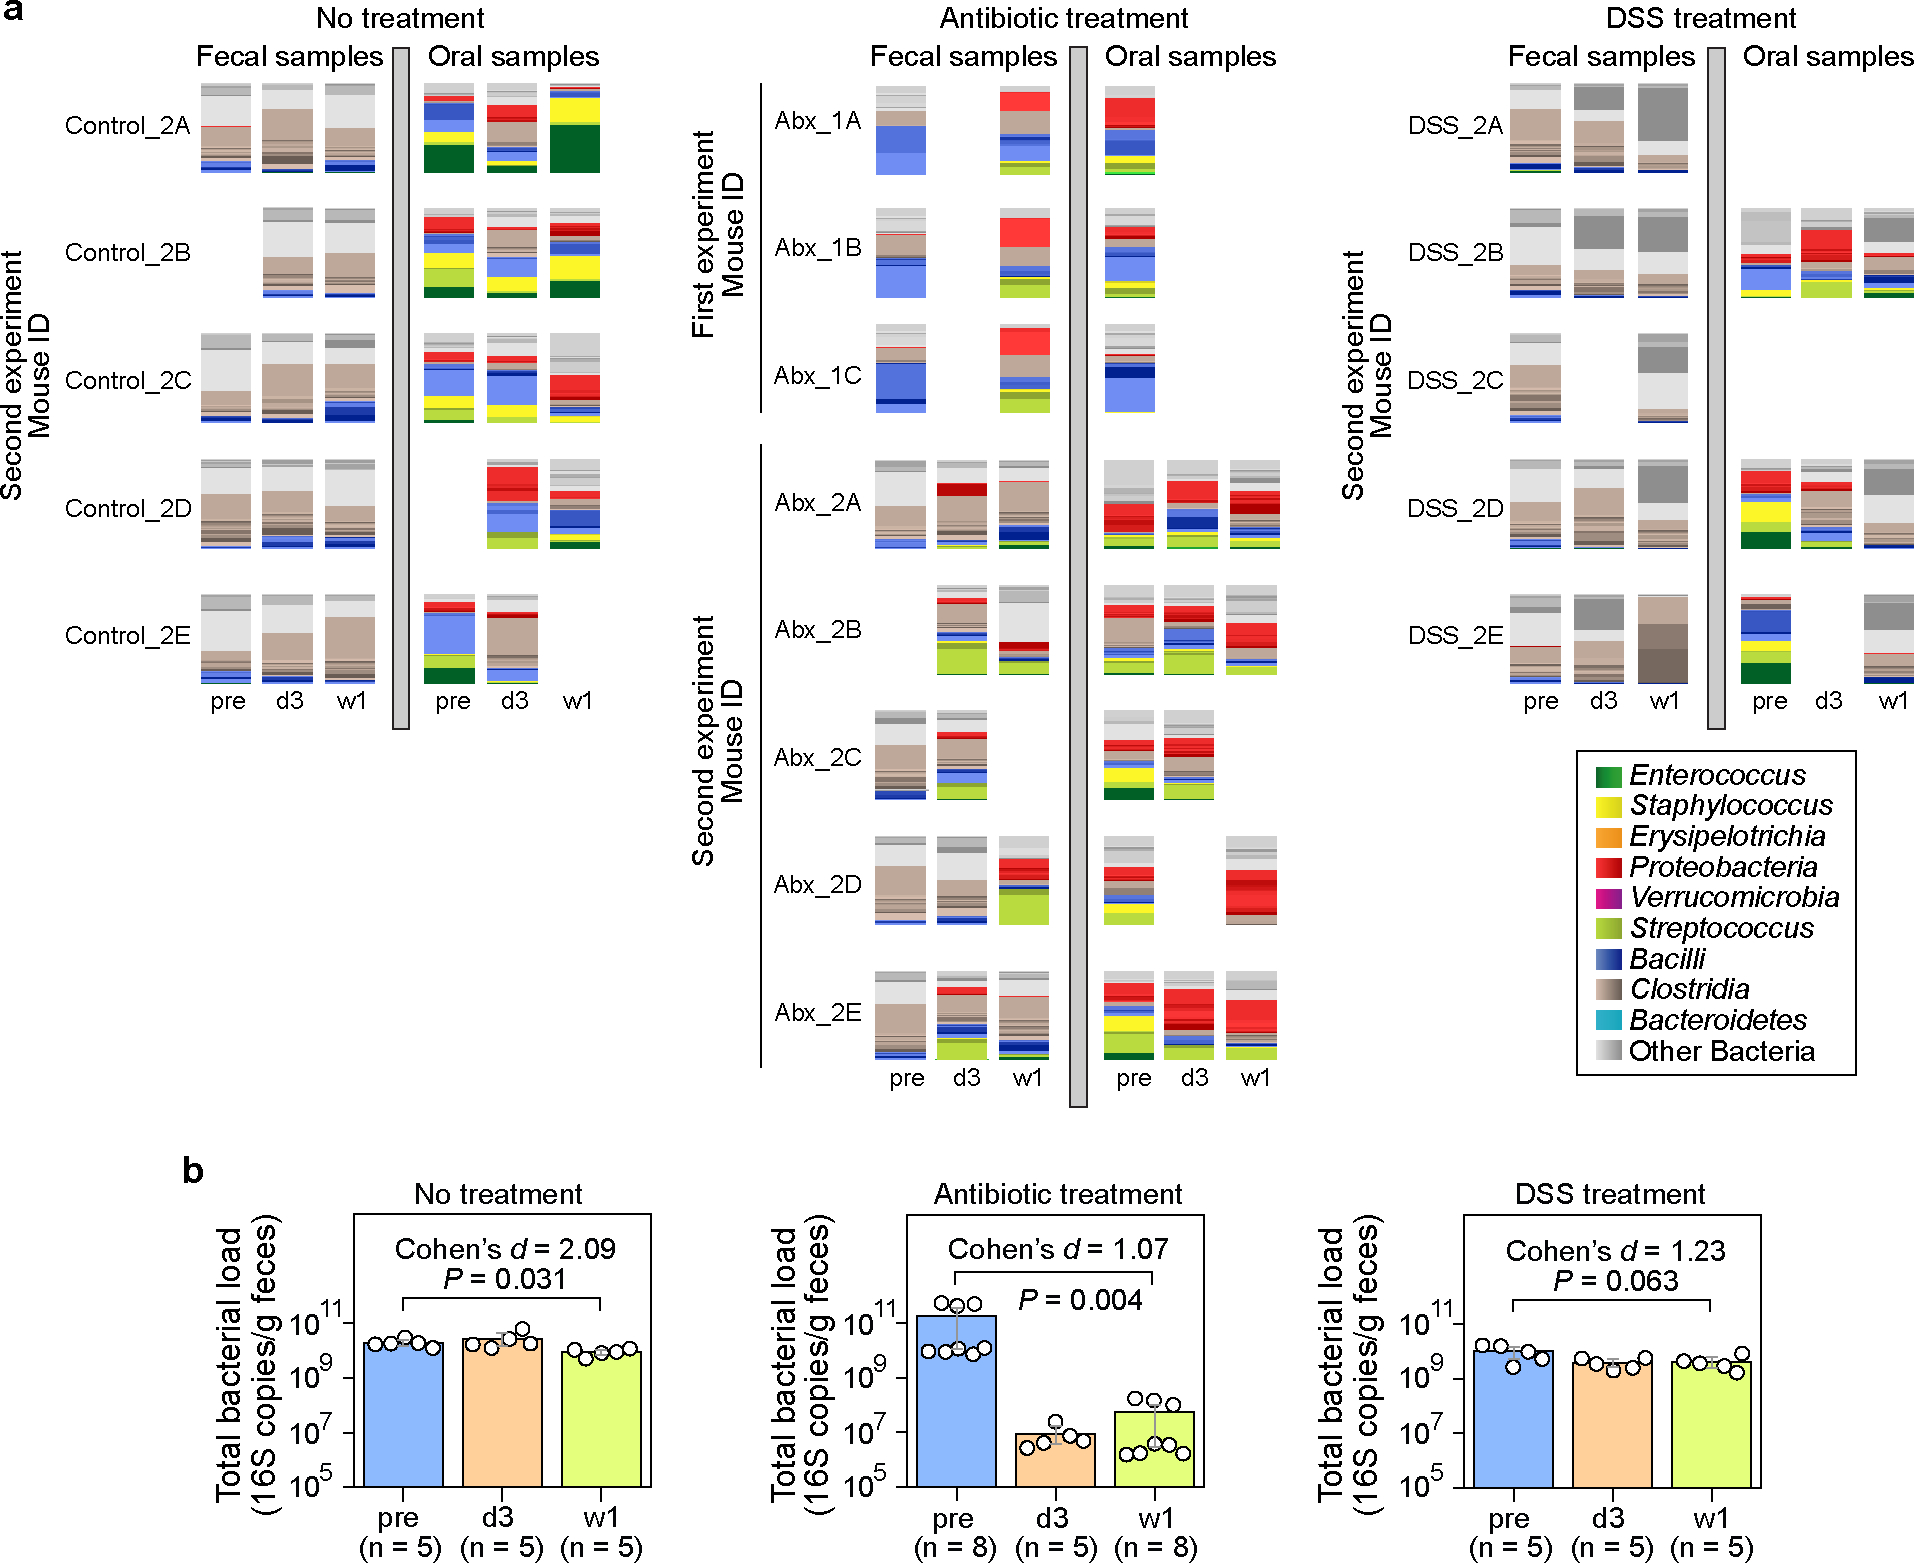
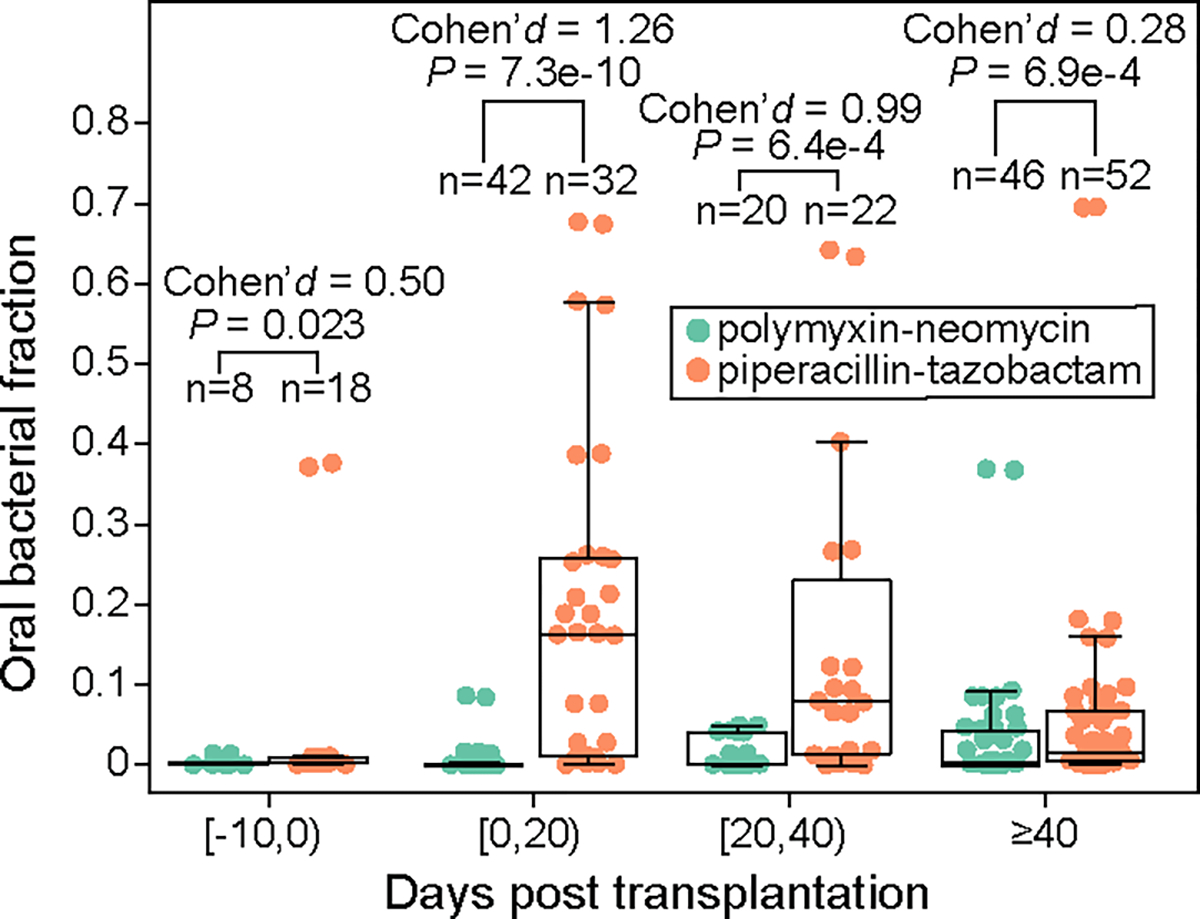
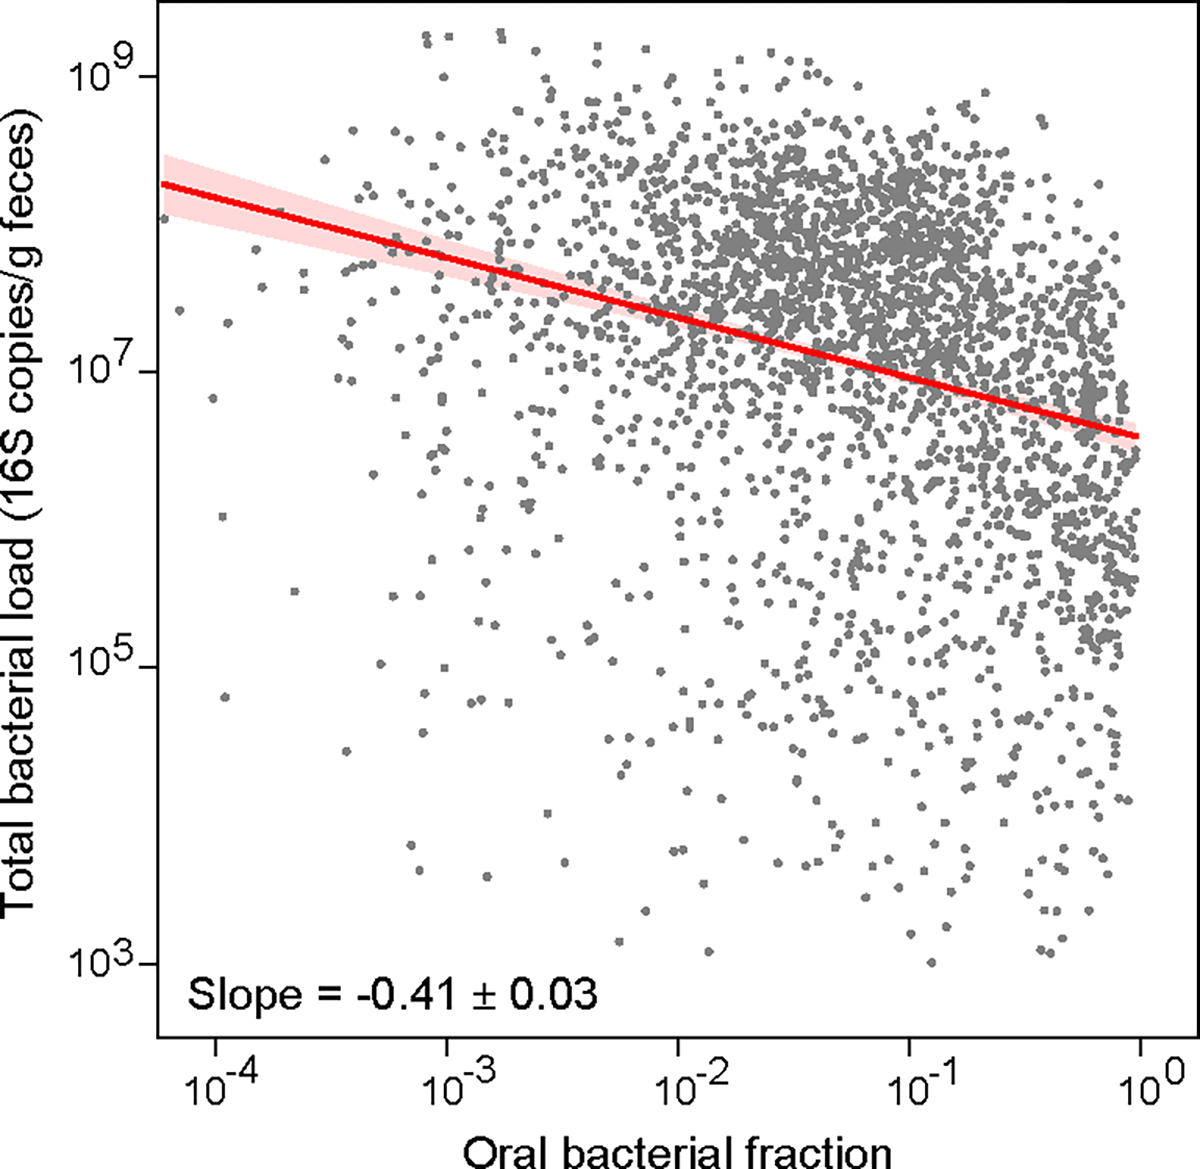
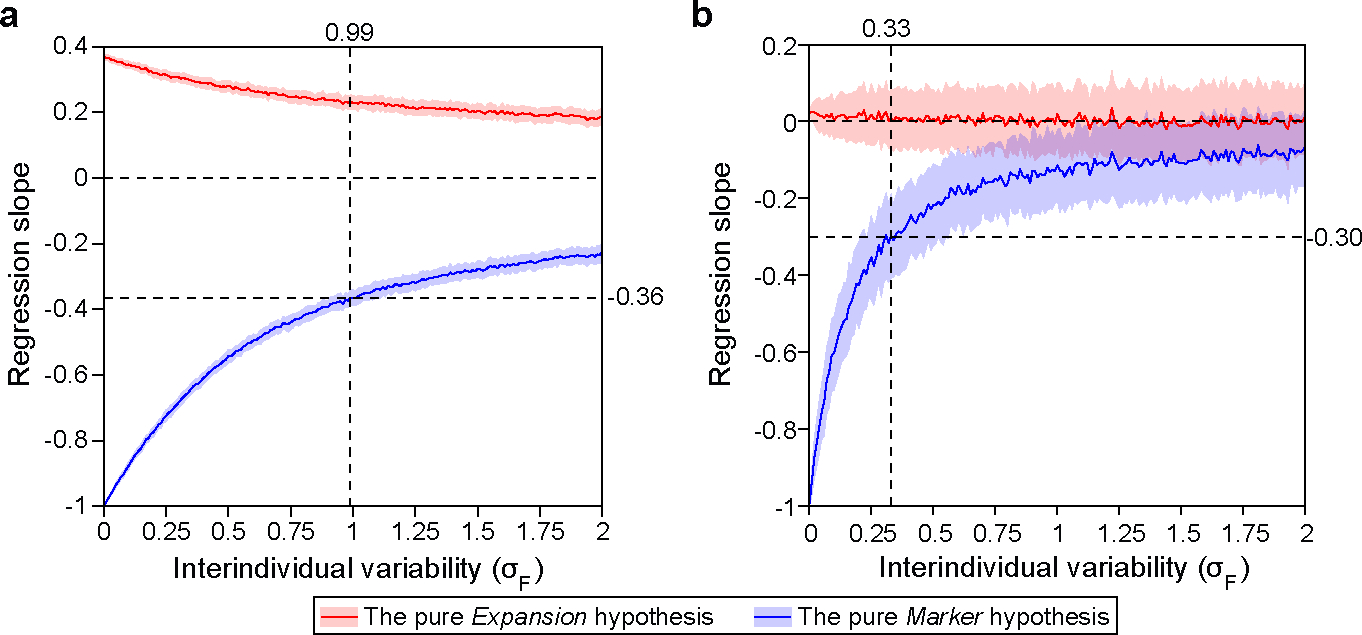
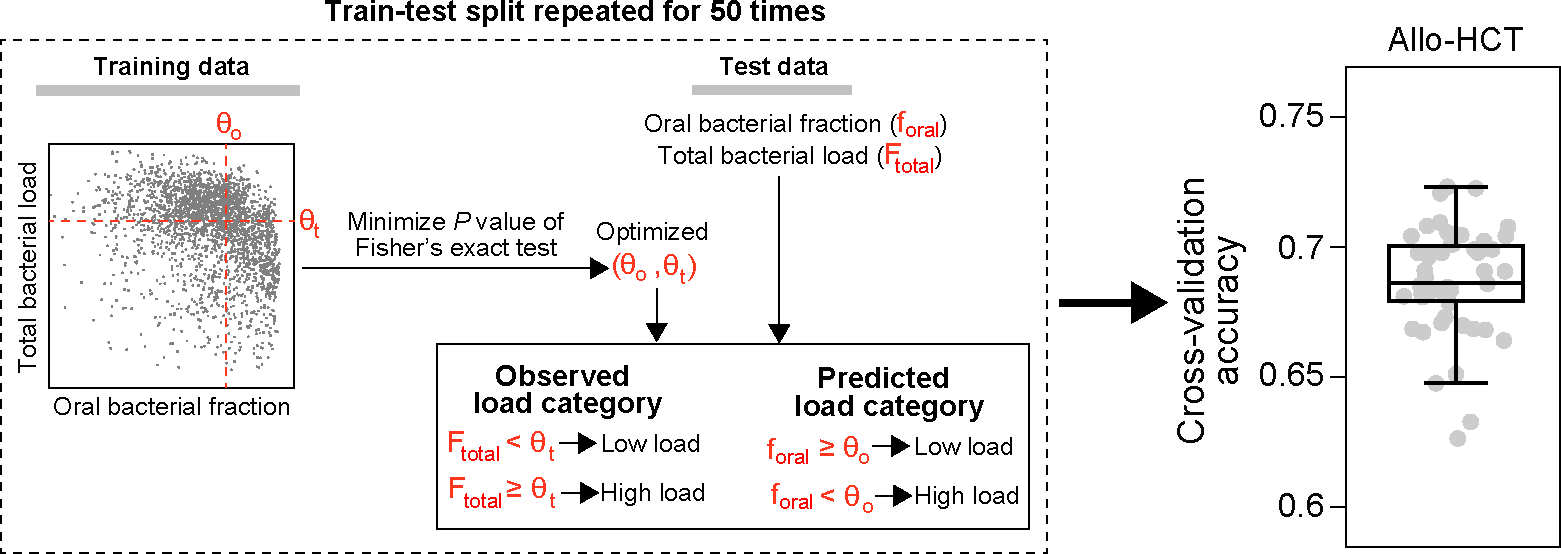
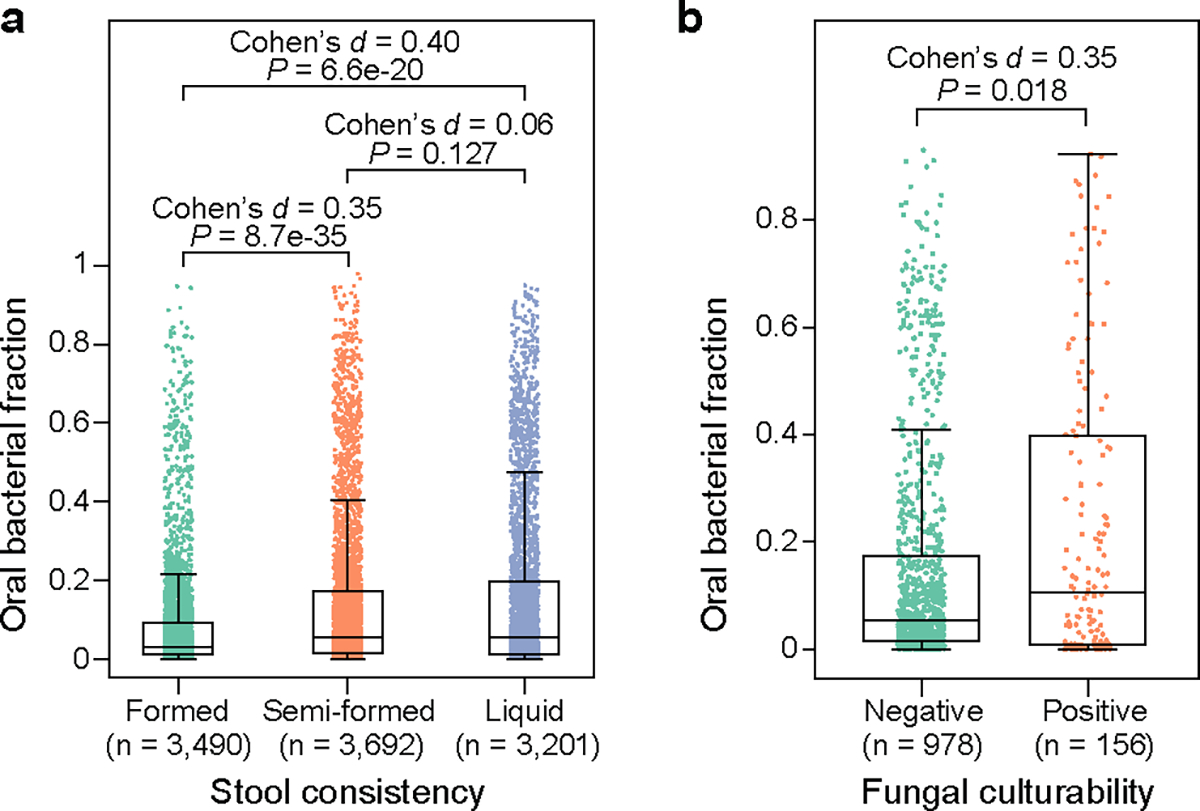
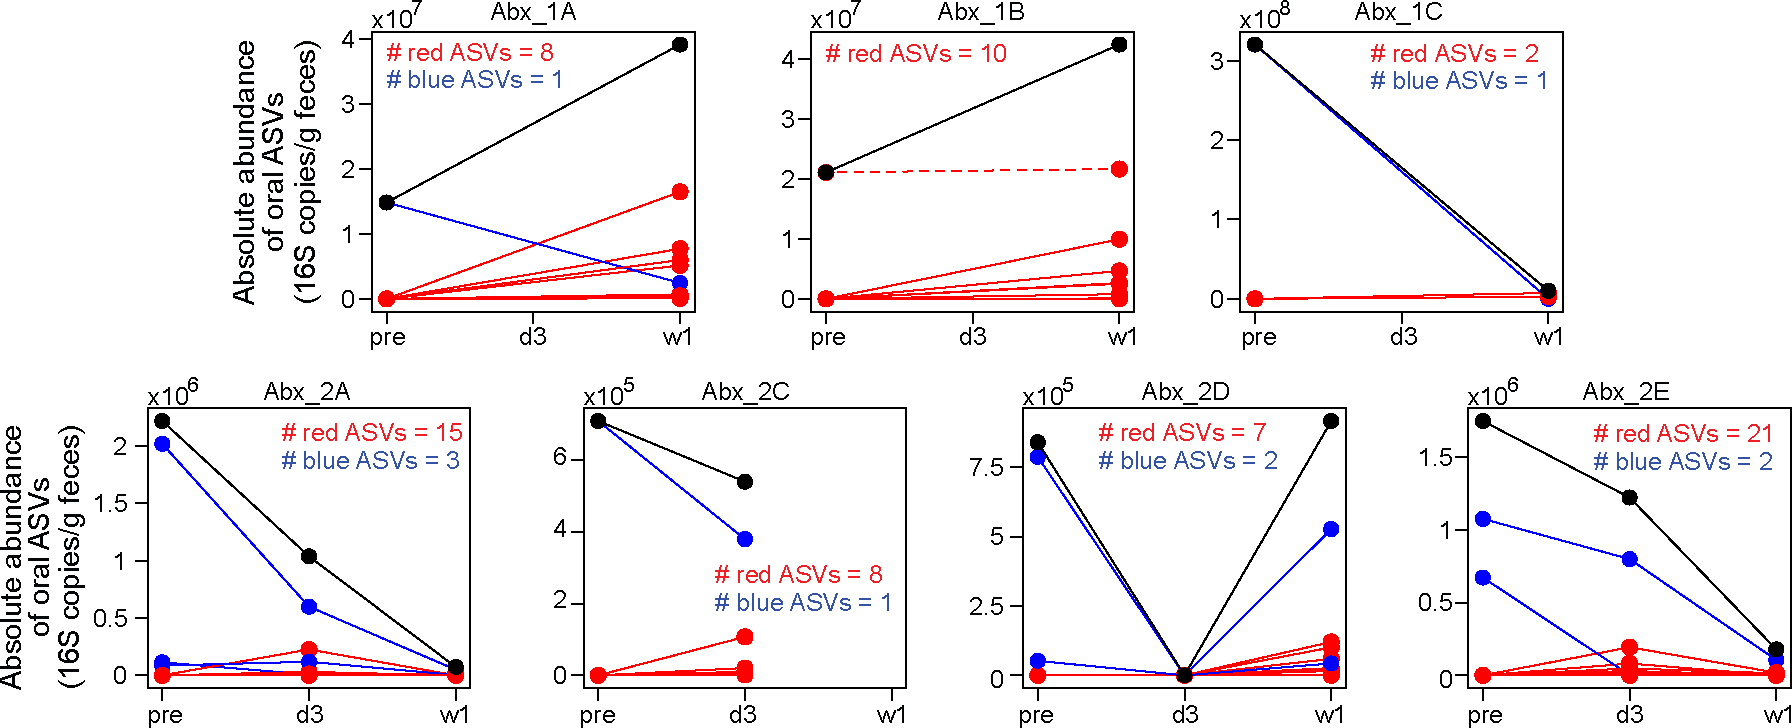
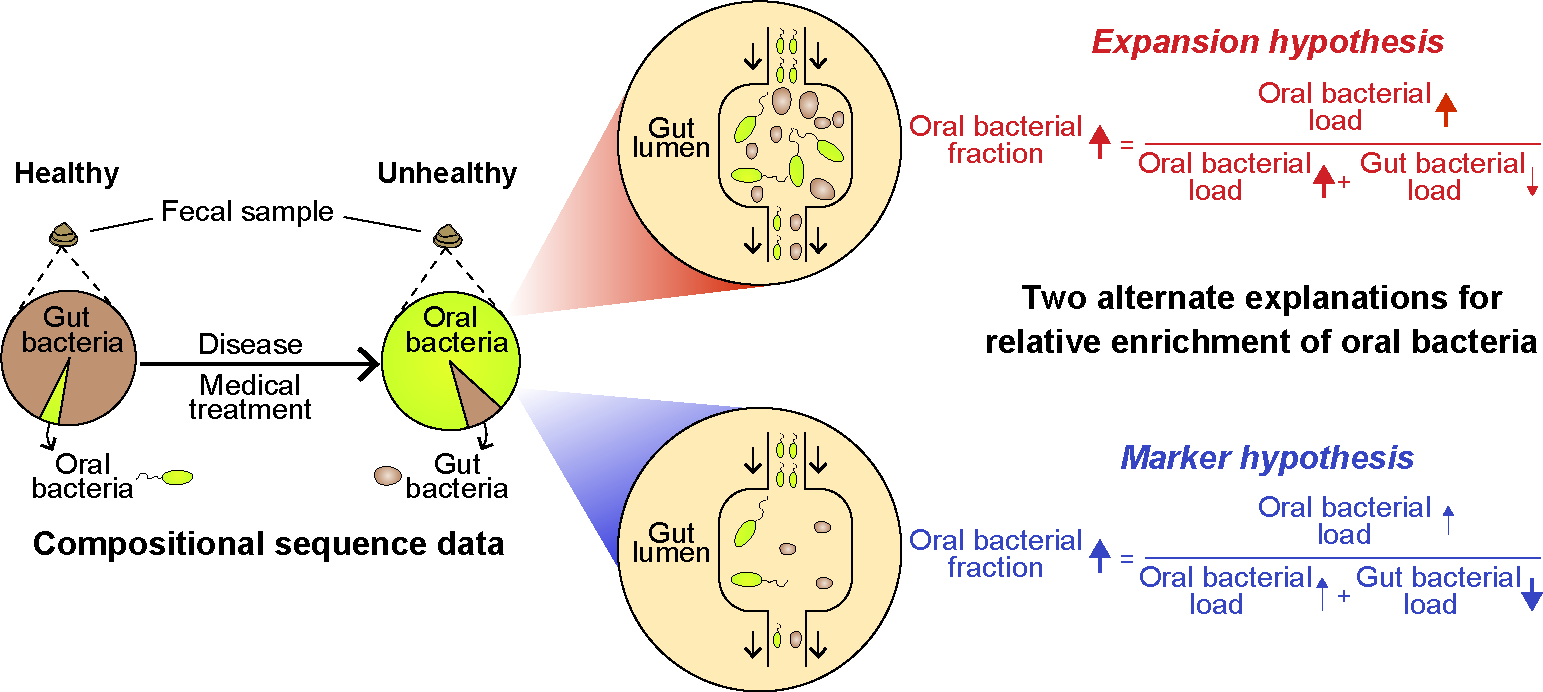
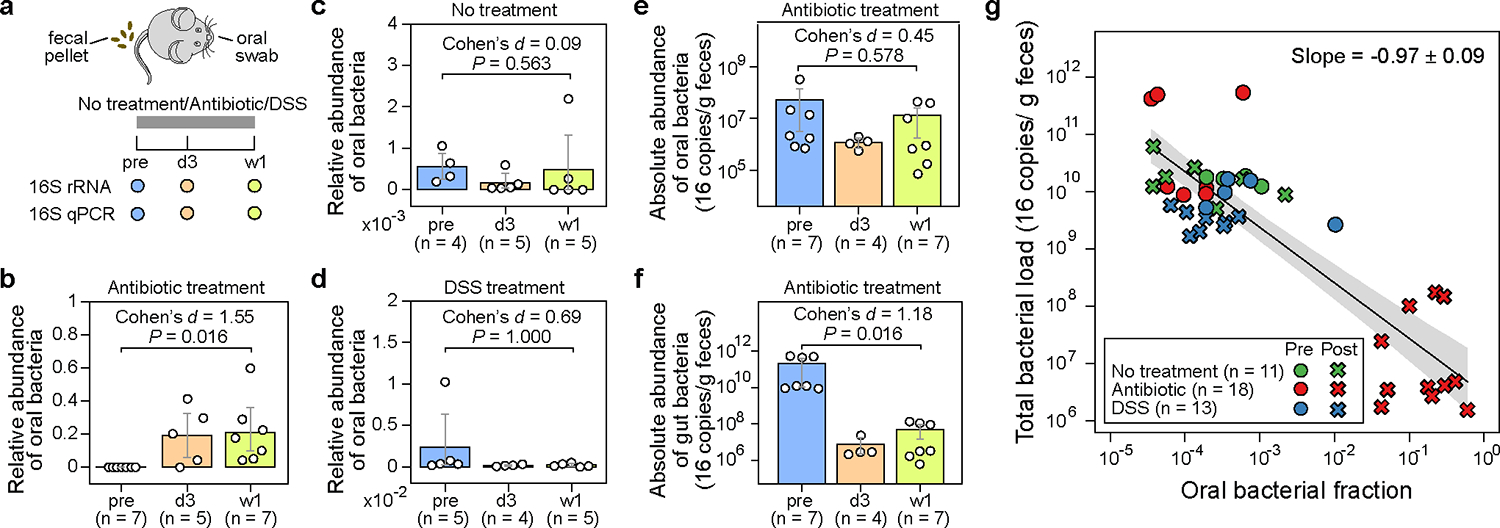
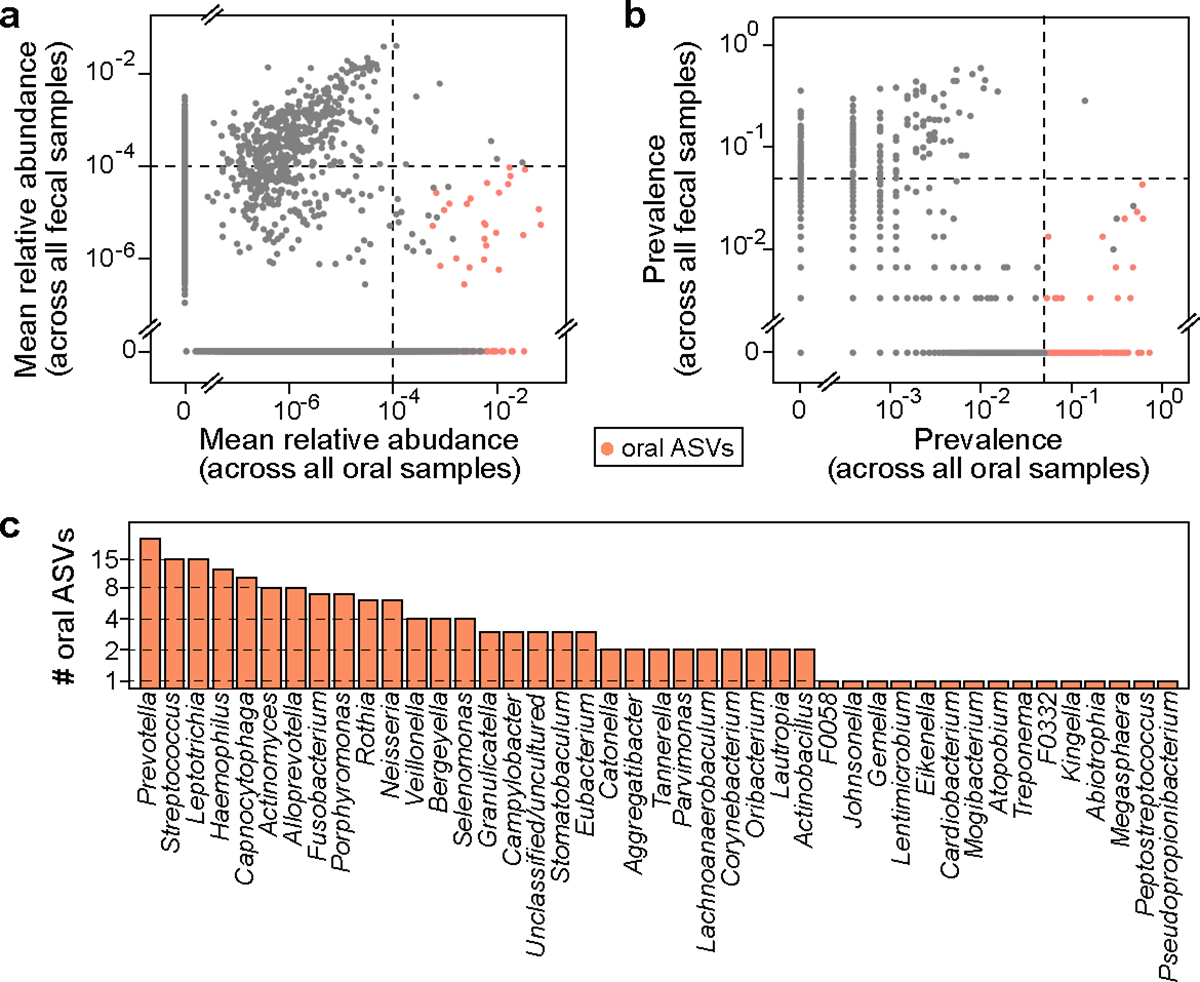
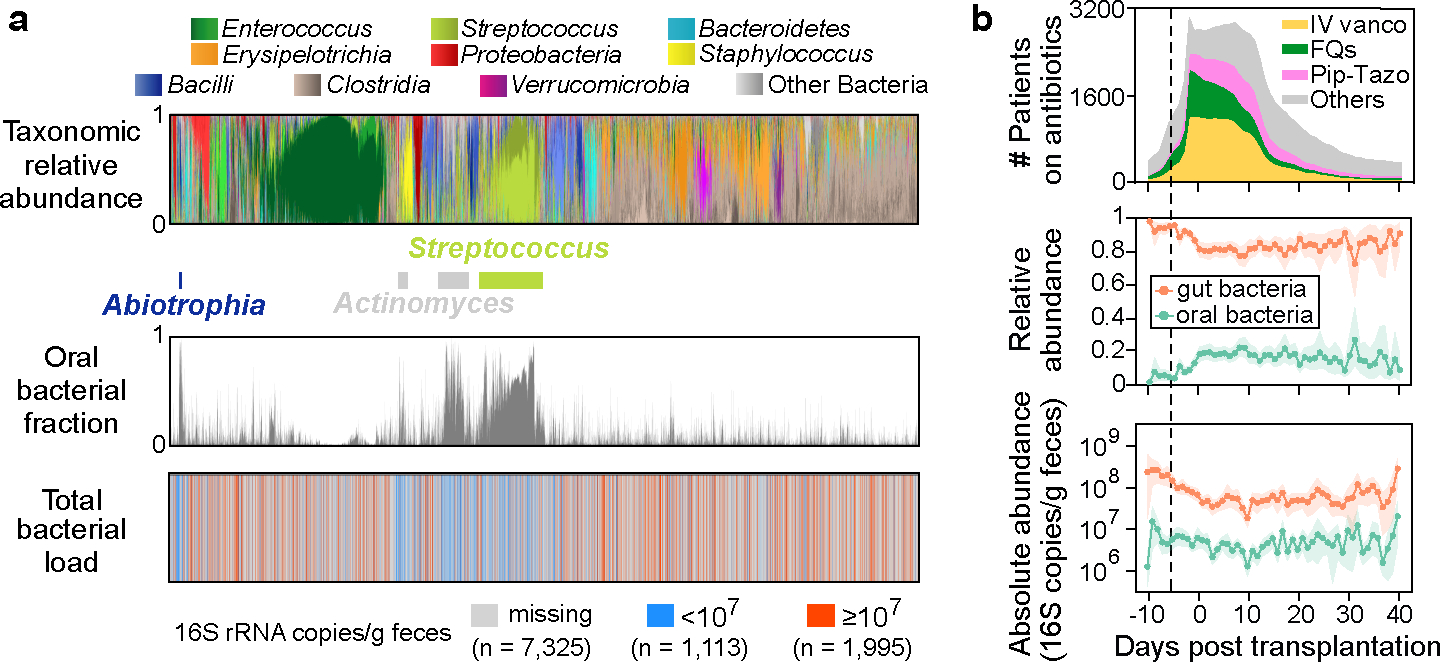
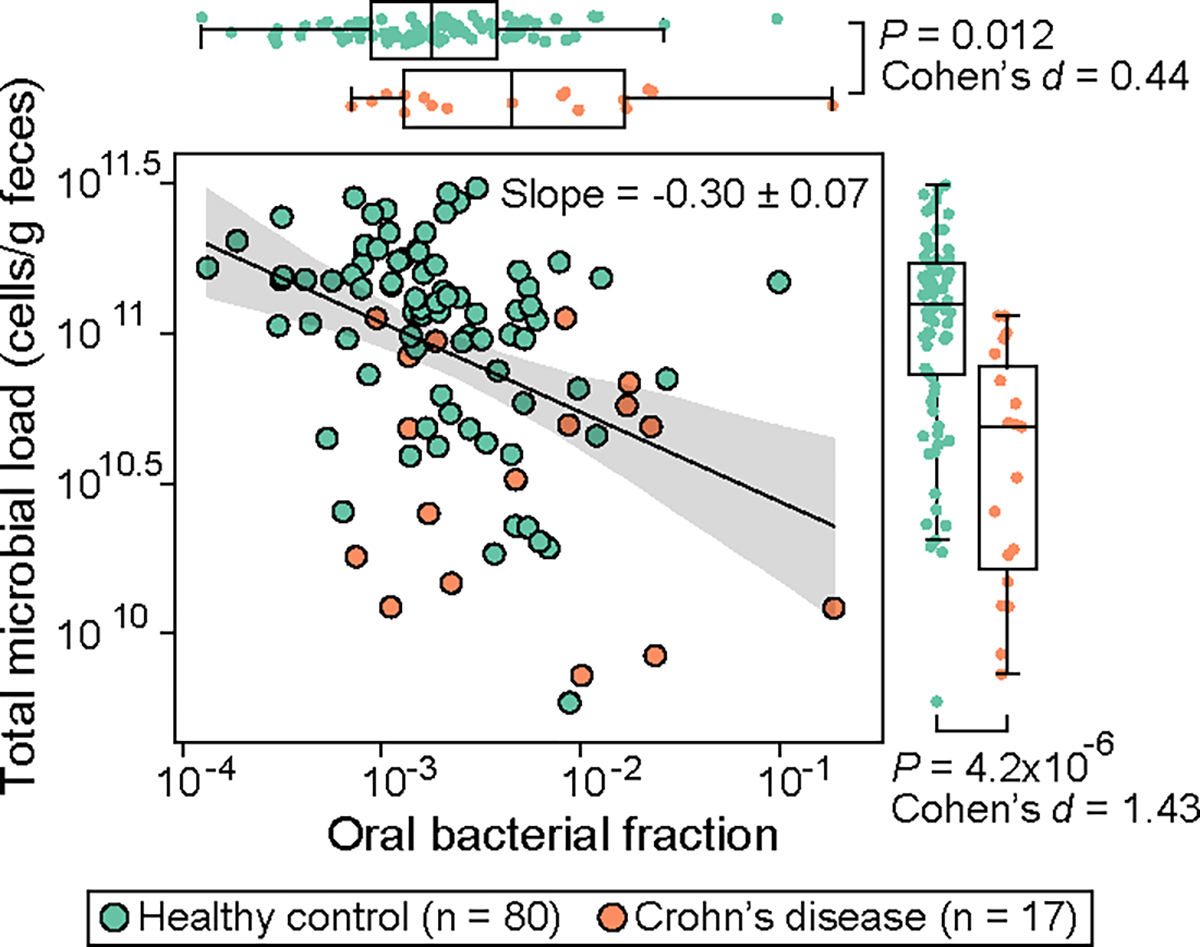
The detection of oral bacteria in faecal samples has been associated with inflammation and intestinal diseases. The increased relative abundance of oral bacteria in faeces has two competing explanations: either oral bacteria invade the gut ecosystem and expand (the 'expansion' hypothesis), or oral bacteria transit through the gut and their relative increase marks the depletion of other gut bacteria (the 'marker' hypothesis). Here we collected oral and faecal samples from mouse models of gut dysbiosis (antibiotic treatment and DSS-induced colitis) and used 16S ribosomal RNA sequencing to determine the abundance dynamics of oral bacteria. We found that the relative, but not absolute, abundance of oral bacteria increases, reflecting the 'marker' hypothesis. Faecal microbiome datasets from diverse patient cohorts, including healthy individuals and patients with allogeneic haematopoietic cell transplantation or inflammatory bowel disease, consistently support the 'marker' hypothesis and explain associations between oral bacterial abundance and patient outcomes consistent with depleted gut microbiota. By distinguishing between the two hypotheses, our study guides the interpretation of microbiome compositional data and could potentially identify cases where therapies are needed to rebuild the resident microbiome rather than protect against invading oral bacteria.


Conflict of interest statement

Competing interests

J.U.P. reports research funding, intellectual property fees and travel reimbursement from Seres Therapeutics and consulting fees from DaVolterra, CSL Behring and from Maat Pharma. He serves on an Advisory board of and holds equity in Postbiotics Plus Research. He has filed intellectual property applications related to the microbiome (reference nos. 62/843,849, 62/977,908 and 15/756,845). M.R.M.v.d.B. has received research support from Seres Therapeutics; he has consulted, received honorarium from or participated in advisory boards for Seres Therapeutics, WindMIL Therapeutics, Rheos, Frazier Healthcare Partners, Nektar Therapeutics, Notch Therapeutics, Forty Seven Inc., Priothera, Ceramedix, Lygenesis, Pluto Immunotherapeutics, Magenta Therapeutics, Merck & Co., Inc. and DKMS Medical Council (Board); and he has IP Licensing with Seres Therapeutics, Juno Therapeutics and stock options from Seres and Notch Therapeutics. T.M.H. has participated in a scientific advisory board for Boehringer-Ingelheim Inc. T.R. is currently an employee of BioNTech SE. Memorial Sloan Kettering Cancer Center (MSKCC) has financial interests relative to Seres Therapeutics. The remaining authors declare no competing interests.

Figures

Extended Data Figure 1:
Extended Data Figure 1:. Paired fecal and oral microbiome samples in the mouse experiments.
a, Bacterial ASV profiles displayed using stacked bar plots. Samples were collected at three time points: pre (before treatment), d3 (3 days after treatment initiation), and w1 (one week after treatment initiation). Missing samples in the second experiment were due to low sequence coverage (samples with less than 1,000 reads were excluded). b, Total bacterial load in fecal samples (circles). Bar heights represent the means, with error bars indicating the 95% confidence interval. P values were calculated using a one-sided Wilcoxon signed-rank test. DSS: Dextran Sulfate Sodium.
Extended Data Figure 2:
Extended Data Figure 2:. Quantitative agreement between our method and FEAST for estimating oral bacterial fraction in post-treatment fecal samples.
The FEAST-estimated values were averaged over 10 different runs. DSS: Dextran Sulfate Sodium. See Supplementary Note 1 for discussion on the discrepancy between the two approaches when oral bacterial fractions estimated by our approach fall below 0.0001.
Extended Data Figure 3:
Extended Data Figure 3:. Principal coordinate analysis plot of the microbiome samples in the mouse experiments.
PCo1 and PCo2 represent principal component 1 and 2, respectively. a, Fecal and oral samples together. The unit of total bacterial load is 16S copies per gram of feces for fecal samples and 16S copies per swab for oral samples. b, Fecal samples only. Panel b shows that PCo1 captures the gut microbiota changes after antibiotic treatment, while PCo2 captures the gut microbiota changes after DSS treatment. DSS: Dextran Sulfate Sodium.
Extended Data Figure 4:
Extended Data Figure 4:. Validation of oral bacterial ASVs identified from healthy individuals in patients with inflammatory bowel disease.
This cohort consists of 16 patients with Crohn’s disease (CD), 42 patients with ulcerative colitis (UC), and 43 healthy controls (HC). Notably, none of the participants had taken antibiotics within the last three months prior to the study entry. a, Impact of cutoff parameters on the estimated oral bacterial fraction in feces of these participants. We systematically varied cutoffs for the mean relative abundance (0.01%, 0.1%), prevalence (5%, 10%), and the definition of ASV presence (0.01%, 0.1%) in the computation of prevalence to establish the reference set of oral ASVs. For each reference set, oral ASVs in their feces were inferred through exact sequence matching. The default parameter combination used throughout the study is outlined in the red box. P values were calculated using a one-sided Mann-Whitney U test. b, Percentage of inferred oral ASVs in feces that are also found in paired saliva samples. c, Percentage of the total relative abundance of inferred oral ASVs in feces contributed by those found in paired saliva samples. Two HC samples with a zero oral bacterial fraction are not shown in all box plots. Box plots represent the median, 25th and 75th percentiles and whiskers represent the 95th and 5th percentiles.
Extended Data Figure 5:
Extended Data Figure 5:. Validation of piperacillin-tazobactam’s effect on enriching oral bacteria in feces using an independent pediatric allo-HCT cohort.
19 children (1–17 year old, 10.1 year old on average) were treated with either oral polymyxin-neomycin or oral piperacillin-tazobactam in the Leiden University Medical Center, Netherlands. Both medications were administered 10 days before transplantation until engraftment or 21 days after transplantation, whichever occurred later. Samples were grouped into four transplantation stages. FDR-corrected P values were calculated using a one-sided Mann-Whitney U test. Box plots represent the median, 25th and 75th percentiles and whiskers represent the 95th and 5th 148 percentiles.
Extended Data Figure 6:
Extended Data Figure 6:. Inverse correlation between oral bacterial fraction and total bacterial load in fecal samples from MSKCC allo-HCT recipients.
Each dot in the plot represents a fecal sample. Samples with zero oral bacterial fraction, or with total bacterial load less than 1,000 16S copies per gram of feces, or collected 20 days before or 40 days after transplantation were excluded from the plot and the linear regression analysis. The number of remaining samples is 2,524. The red line represents the best linear fit, and the shading of the same color indicates its ± 95% confidence interval. The plot also displays the estimated regression slope and its standard error.
Extended Data Figure 7:
Extended Data Figure 7:. Impact of interindividual variability on the regression slope between oral bacterial fraction and total bacterial load.
We generated synthetic datasets using parameters estimated from the MSKCC allo-HCT cohort analyzed in Fig. 4 (a) and the Crohn’s disease cohort analyzed in Fig. 5 (b). In both panels, we systematically varied σF (Eq. 1) from 0 to 2 while co-varying σf (Eq. 2) to maintain a constant ratio of σf/σF. For each synthetic dataset, the regression slope was determined through linear regression between oral bacterial fraction and total bacterial load in the log-log space. The red and blue lines represent the mean slopes over 100 simulation runs, with the shaded regions of the same color indicating the standard deviations. Vertical dashed lines in the panel (a) and (b) mark the σF values estimated from the pre-antibiotic-prophylaxis samples in the allo-HCT cohort and from the healthy individuals in the Crohn’s disease cohort, respectively. At these σF values, the pure Marker hypothesis predicted that the regression slopes are −0.36 and −0.30. For detailed information on our simulation approach, please refer to the Methods section.
Extended Data Figure 8:
Extended Data Figure 8:. Cross-validation accuracy for classifying total bacterial load in fecal samples from MSKCC allo-HCT recipients.
A schematic illustration of our classification model is enclosed in the dashed box. Our model uses two threshold parameters, θo and θt, to convert the oral bacterial fraction and total bacterial load into binary categories, respectively. Given training data, we optimized the two cutoff parameters by minimizing the P value of Fisher’s exact test of independence, subject to the constraints θo10-4,1 and θt103,1010. The optimized θo. was subsequently applied to predict high or low bacterial loads in the test set by comparing the oral bacterial fractions to θo. Simultaneously, we binarized the observed bacterial loads by comparing them to θt. Accuracy was assessed by comparing the predicted bacterial load categories to the observed bacterial load categories. In the boxplot, each dot corresponds to a single 5-fold cross-validation split and the random train-test split was repeated 50 times. Box plots represent the median, 25th and 75th percentiles and whiskers represent the 95th and 5th percentiles.
Extended Data Figure 9:
Extended Data Figure 9:. Distribution of oral bacterial fraction in fecal samples from MSKCC allo-HCT recipients, categorized by stool consistency
(a) and fungal cultivability (b). Each dot represents a fecal sample. FDR-corrected P values were calculated using a two-sided Mann-Whitney U test. Box plots represent the median, 25th and 75th percentiles and whiskers represent the 95th and 5th percentiles.
Extended Data Figure 10:
Extended Data Figure 10:. Emergence of new oral ASVs in mouse feces after antibiotic treatment.
Each panel plots data from one mouse. Mouse Abx_2B was excluded due to the absence of its pre-treatment fecal sample. In each panel, individual oral ASVs are shown by lines. ASVs that increased in absolute abundance after treatment (i.e., post-treatment average > pre-treatment) are shown in red, while those that decreased or remained unchanged (post treatment average ≤ pre-treatment) are shown in blue. The black line in each panel represents the total absolute abundance, which is the sum of all red and blue lines. Except for one oral ASV in mouse Abx_1B (shown as a red dashed line), all ASVs displaying increased absolute abundance (solid red lines) were not present in the pre-treatment fecal samples; they represent new ASVs emerging from the oral cavity. Samples were collected at three time points: pre (before treatment), d3 (3 days after treatment initiation), and w1 (one week after treatment initiation).
Figure 1:
Figure 1:. The relative enrichment of oral bacteria in feces has two competing explanations.
Certain diseases and medical treatments lead to an enrichment of oral bacteria in fecal samples. This phenomenon has two plausible explanations. In the Expansion hypothesis (highlighted in red), the increased fraction of oral bacteria is caused by a similar rise in absolute numbers. On the other hand, the Marker hypothesis (highlighted in blue) attributes this phenomenon to the depletion of gut bacteria. Whereas the Expansion hypothesis suggests that the gut environment has become more favorable for oral bacteria, the Marker hypothesis proposes that the number of gut resident bacteria has decreased. Consequently, the oral bacteria, which are simply passing through, increase in proportion in feces. Distinguishing between these two hypotheses is crucial for interpreting microbiome population dynamics through compositional analysis of fecal samples.
Figure 2:
Figure 2:. The administration of antibiotics to mice depletes gut bacteria and increases the relative abundance of oral bacteria in fecal samples.
a, Experimental design. The experiment included three research arms: untreated controls (n=5), mice administered an antibiotic cocktail of ampicillin, vancomycin, and neomycin (n=8), and mice treated with dextran sulfate sodium (DSS) (n=5). Paired fecal and oral samples were collected at three-time points: the same day before treatment initiation (pre), 3 days after treatment initiation (d3), and one week after treatment initiation (w1). Samples with less than 1,000 reads were excluded from analysis and not shown in panels (b)-(g). b-d, Relative abundance of oral bacteria in fecal samples from mice in the antibiotic treatment group (b), no treatment group (c), and DSS treatment group (d). e,f, Absolute abundance of oral (e) and gut (f) bacteria in fecal samples from antibiotic-treated mice. In panels (b)-(f), each circle represents a fecal sample. Bar heights represent the means, with error bars indicating the 95% confidence interval (CI). P values were calculated using a one-sided Wilcoxon signed-rank test. g, Linear regression between oral bacterial fraction and total bacterial load in the log10-log10 scale. Pre-treatment (pre) and post-treatment (d3, w1) samples are represented by circles and crosses, respectively. The black line, and the shading of the same color indicates the ±95% CI. Samples with zero oral bacterial fraction were not shown and excluded from the linear regression analysis.
Figure 3:
Figure 3:. Oral bacterial ASVs identified from healthy human individuals involved in the HMP dataset.
a,b, Mean relative abundance (a) and prevalence (b) of ASVs across 2,641 oral cavity samples (x-axis) and 291 paired fecal samples (y-axis). Each dot represents an ASV. Black dashed lines represent the cutoffs used to identify oral ASVs (see Methods for details). Among a total of 23,411 ASVs, 178 ASVs identified as of oral origin are highlighted in orange. c, Distribution of the 178 oral ASVs at the genus level.
Figure 4:
Figure 4:. Relative enrichment of oral bacteria in fecal samples of allo-HCT patients coincides with onset of antibiotic prophylaxis and depletion of gut bacteria.
a, Bacterial population composition in all 10,433 fecal samples from our MSKCC dataset. Each thin vertical bar represents a single sample, with taxonomic composition (top), estimated oral bacterial fraction (middle), and total bacterial load (bottom) aligned for all samples. b, Profiles of antibiotic exposure (top) aligned with the population dynamics of relative (middle) and absolute (bottom) abundance of oral (green curves) and gut (orange curves) bacteria in feces. Lines and dots represent the means, and shadings of the same color indicate the 95% confidence interval. The black dashed line marks the median day −6 when antibiotic prophylaxis was initiated. IV vanco: intravenous vancomycin; FQs: fluoroquinolones; Pip-Tazo: piperacillin-tazobactam.
Figure 5:
Figure 5:. Inverse correlation between total fraction of oral bacteria and microbial load in fecal samples of patients with Crohn’s disease.
Each circle represents a fecal sample. Samples with zero oral bacterial fraction in the original dataset were excluded from the plot and statistical analyses. The black line represents the best linear fit, and the shading of the same color indicates the 95% confidence interval. The plot also displays the regression slope and its standard error. P values for the difference in the marginal distributions between patient and control groups were calculated using a one-sided Mann-Whitney U test. Box plots represent the median, 25th and 75th percentiles and whiskers represent the 95th and 5th percentiles.

References

    1. The Human Microbiome Project Consortium. Structure, function and diversity of the healthy human microbiome. Nature 486, 207–214 (2012). - PMC - PubMed
    1. Segata N, et al. Composition of the adult digestive tract bacterial microbiome based on seven mouth surfaces, tonsils, throat and stool samples. Genome Biol. 13, 1–18 (2012). - PMC - PubMed
    1. Atarashi K, et al. Ectopic colonization of oral bacteria in the intestine drives TH1 cell induction and inflammation. Science 358, 359–365 (2017). - PMC - PubMed
    1. Li B, et al. Oral bacteria colonize and compete with gut microbiota in gnotobiotic mice. Int. J. Oral Sci. 11, 1–9 (2019). - PMC - PubMed
    1. Kitamoto S, et al. The intermucosal connection between the mouth and gut in commensal pathobiont-driven colitis. Cell 182, 447–462. e414 (2020). - PMC - PubMed