. 2024 Sep;31(9):1377-1385.
doi: 10.1038/s41594-024-01299-2. Epub 2024 May 2.

Structural basis of TRPV1 modulation by endogenous bioactive lipids

Affiliations

Structural basis of TRPV1 modulation by endogenous bioactive lipids

William R Arnold et al. Nat Struct Mol Biol. 2024 Sep.

Abstract

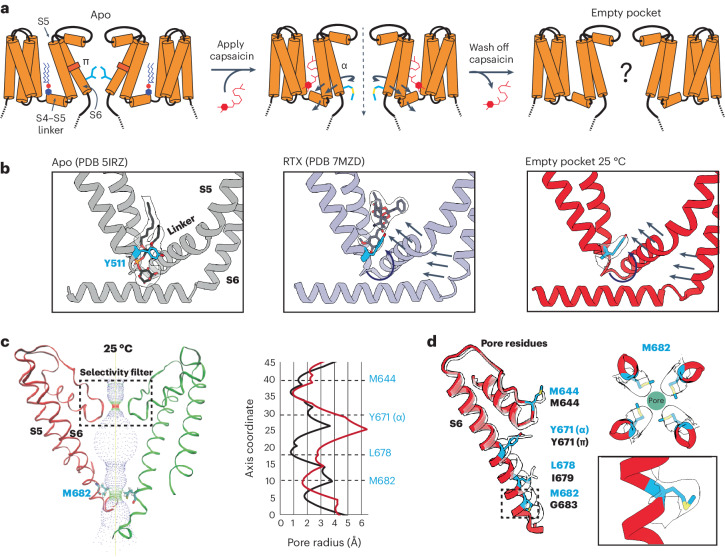
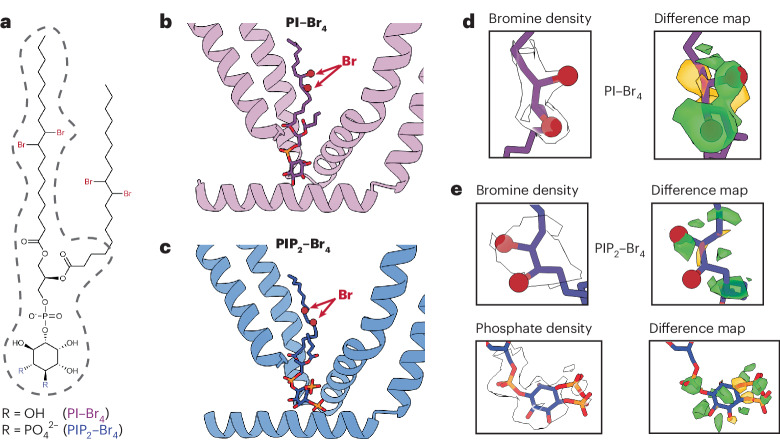
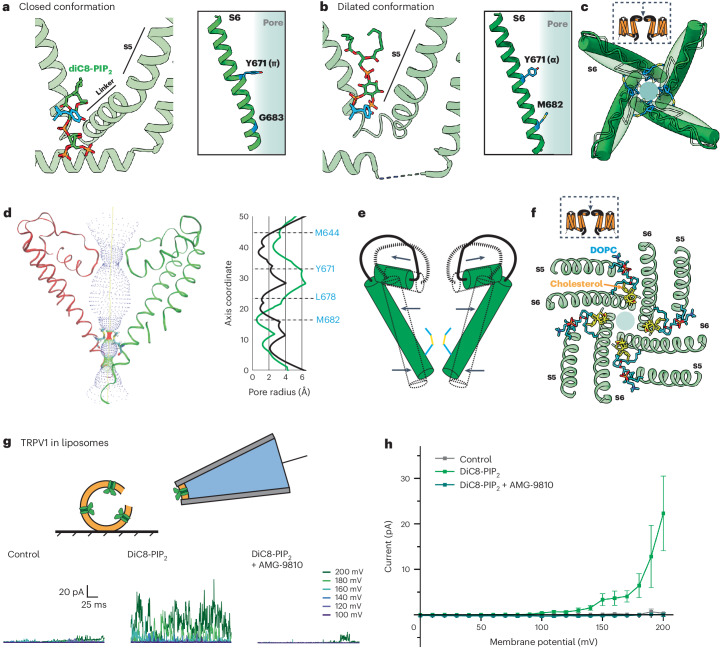
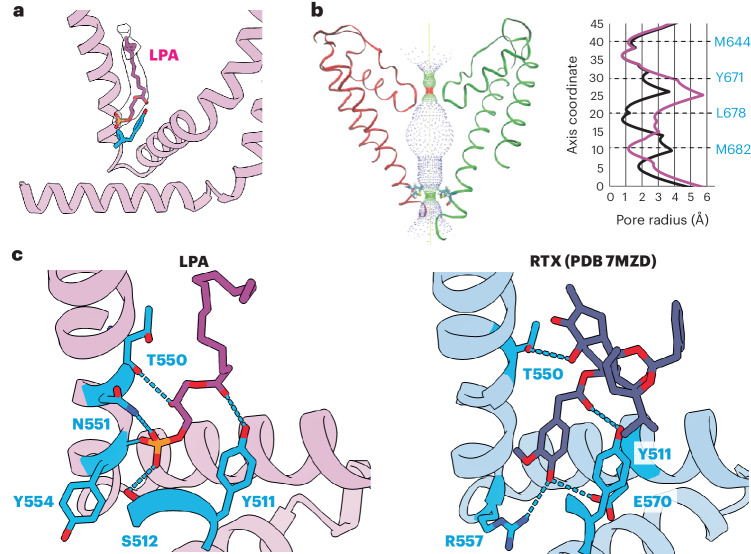
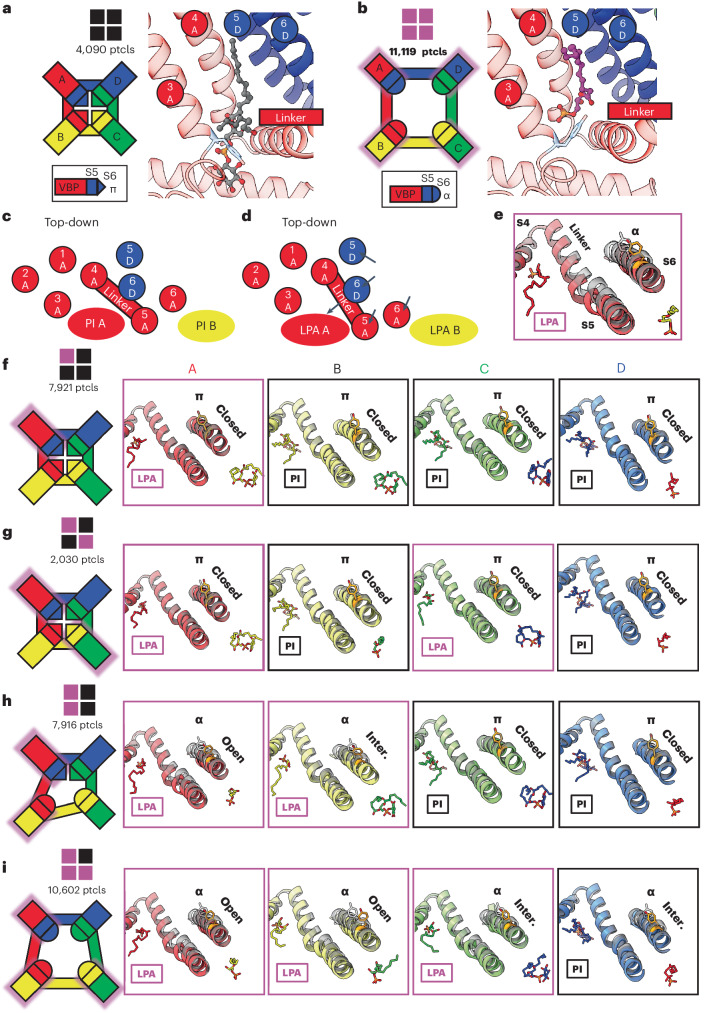
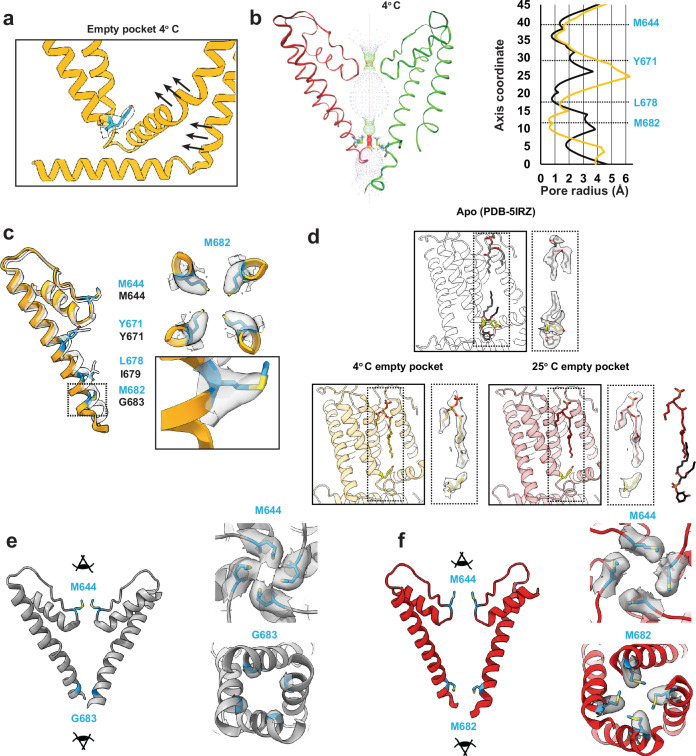
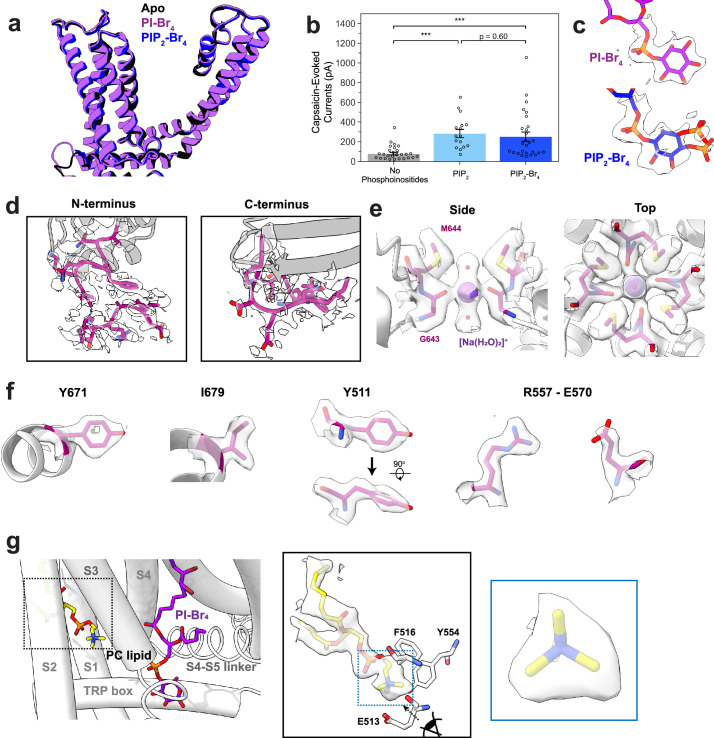
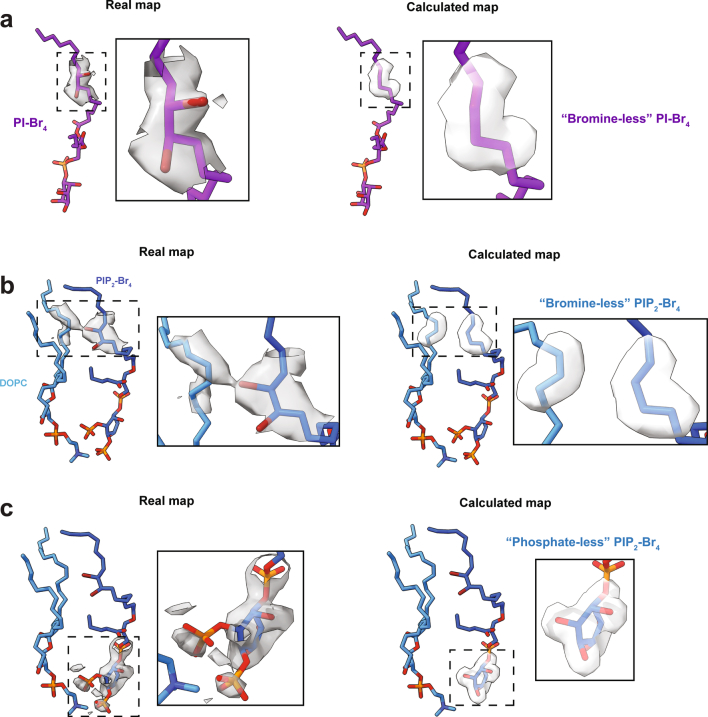
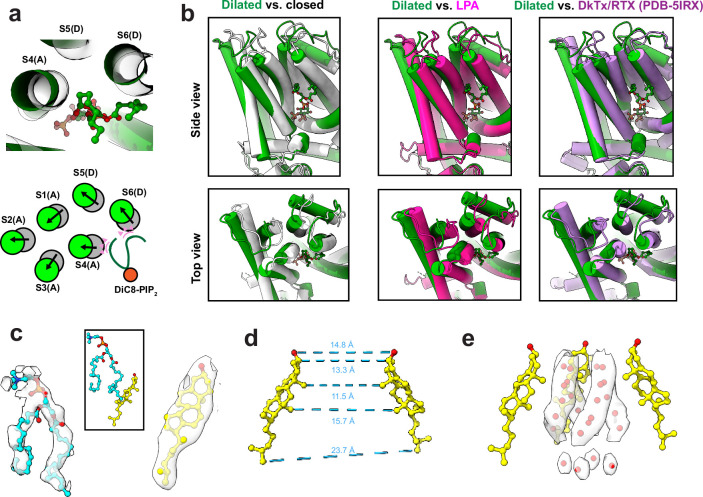
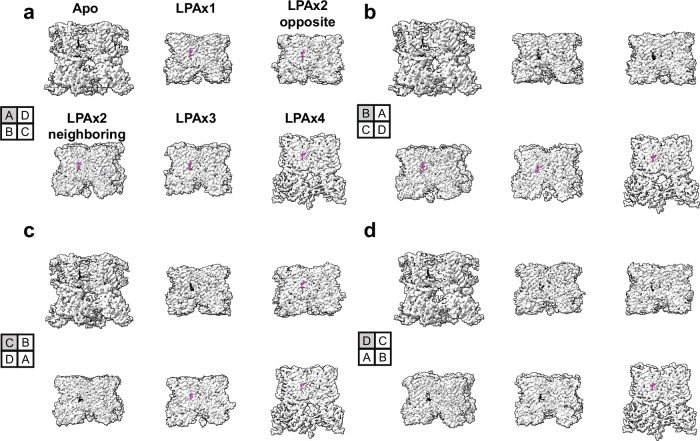
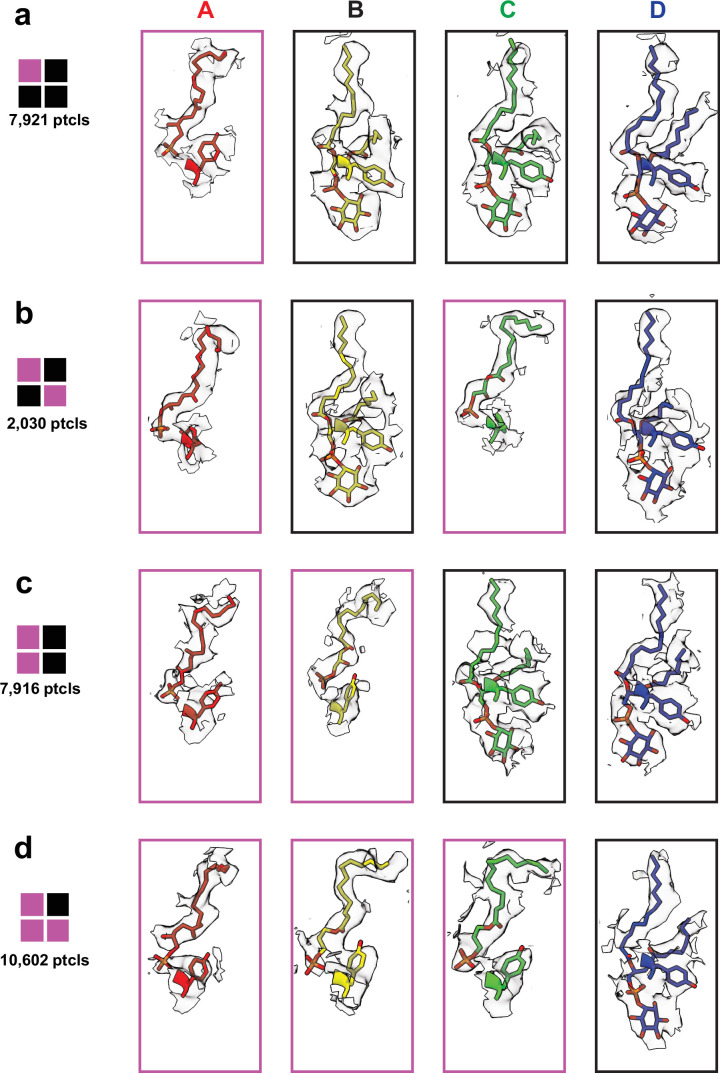
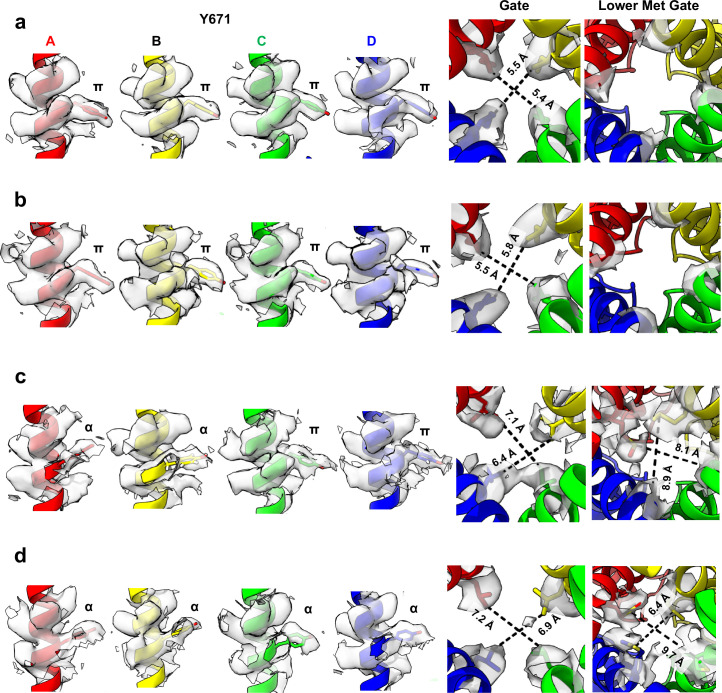
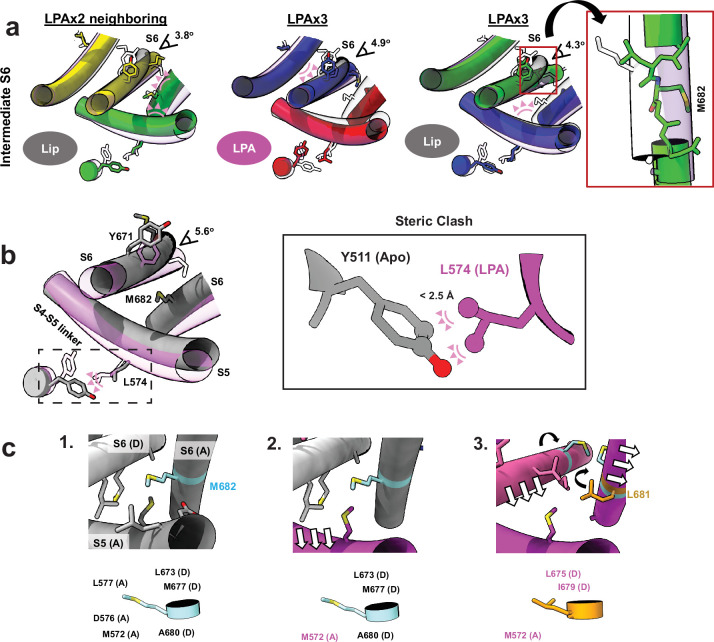
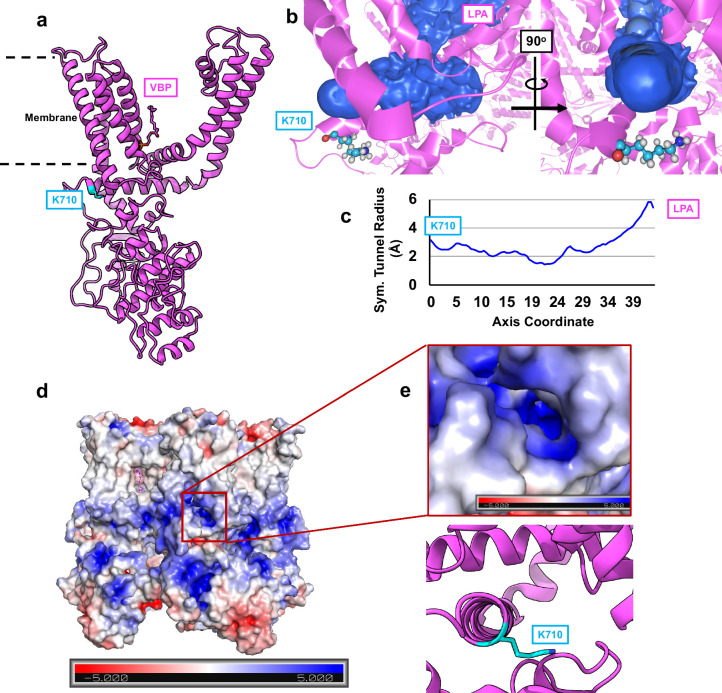
TRP ion channels are modulated by phosphoinositide lipids, but the underlying structural mechanisms remain unclear. The capsaicin- and heat-activated receptor, TRPV1, has served as a model for deciphering lipid modulation, which is relevant to understanding how pro-algesic agents enhance channel activity in the setting of inflammatory pain. Identification of a pocket within the TRPV1 transmembrane core has provided initial clues as to how phosphoinositide lipids bind to and regulate the channel. Here we show that this regulatory pocket in rat TRPV1 can accommodate diverse lipid species, including the inflammatory lipid lysophosphatidic acid, whose actions are determined by their specific modes of binding. Furthermore, we show that an empty-pocket channel lacking an endogenous phosphoinositide lipid assumes an agonist-like state, even at low temperature, substantiating the concept that phosphoinositide lipids serve as negative TRPV1 modulators whose ejection from the binding pocket is a critical step toward activation by thermal or chemical stimuli.


Conflict of interest statement

Y.C. is a non-shareholder member of Scientific Advisory Board at ShuiMu BioSciences Ltd. and Pamplona Therapeutic Co. Ltd. All other authors declare no competing interest.

Figures

Fig. 1
Fig. 1. Empty-pocket TRPV1.
a, Schematic of the capsaicin washout procedure for obtaining empty-pocket TRPV1. b, VBP in the apo state (PDB 5IRZ), bound with RTX (PDB 7MZD) or in the empty-pocket state at 25 °C (PDB 8U3L; this study). c, Left: pore profile of empty-pocket TRPV1 at 25 °C. Right: pore radius of empty-pocket TRPV1 at 25 °C (red) and apo TRPV1 (black) were determined using the HOLE program. d, Key residues lining the channel pore. The red ribbon with blue labels depicts empty-pocket TRPV1 at 25 °C; the transparent ribbon represents apo TRPV1.
Fig. 2
Fig. 2. Brominated phosphoinositide binding to TRPV1.
a, The chemical structure of brominated phosphoinositides used in this study. The part of the lipids with resolvable density is outlined with dashed gray lines. b,c, VBP bound with PI–Br4 (b) and PIP2–Br4 (c). d,e, Density map of key functional groups for PI–Br4 (d) and PIP2–Br4 (e) with corresponding difference maps. Difference maps were determined by subtracting calculated map of models lacking bromine atoms and the phosphate moieties at 4 and 5 positions of the inositol headgroup from the experimental map (Methods). Both positive (green) and negative (orange) difference densities are shown.
Fig. 3
Fig. 3. DiC8-PIP2 is a partial potentiator of TRPV1 activity.
a,b, VBP with diC8-PIP2 bound in the closed conformation (a) and the dilated conformation (b). c, Top-down view of the TRPV1 pore in the closed conformation (transparent green) and the dilated conformation (dark green). M644 (blue) of the selectivity filter is highlighted. d, Left: pore profile of TRPV1 in the dilated conformation. Right: pore radii of closed (black) and dilated (green) states. e, Schematic of the pore movements demonstrating the dilation of the upper portion of the pore and constriction of the lower portion. f, Top-down view of TRPV1 showing the binding of DOPC (blue) and cholesterol (yellow). g, Top: schematic showing excised inside-out patch clamp recording configuration. Bottom: sample TRPV1 currents evoked by application of control (bathing) solution, 100 µM DiC8-PIP2, or 100 µM DiC8-PIP2 plus 10 µM antagonist AMG-9810. h, Summary of current–voltage relationships showing that DiC8-PIP2 reliably activates TRPV1. Data are graphed as mean ± s.e.m., patch clamp recordings n = 10. Source data
Fig. 4
Fig. 4. LPA binding to TRPV1.
a, VBP with LPA bound. b, Left: pore profile of TRPV1 with LPA bound. Right: pore radii show profiles for LPA (magenta) compared to the corresponding apo state (black). c, Molecular interactions between ligand headgroups and TRPV1. Residues that form electrostatic interactions with ligand functional groups (within 3.5 Å) for LPA and RTX (PDB 7MZD) are shown in blue.
Fig. 5
Fig. 5. Substoichiometric states of LPA binding.
a, The closed configuration of TRPV1 with all four subunits occupied by PI lipid. Particle numbers (ptcls) are shown. b, The open configuration of TRPV1 with LPA bound to all four subunits. The VBPs of the A monomers are shown to demonstrate the domain-swap architecture that comprises the VBP (S3, S4 and S4–S5 from A; S5 and S6 from D). c,d, Schematic of the binding pocket from a top-down view highlighting the domain-swap architecture and helical movements between the closed (c) and open (d) conformations. e, Structural changes associated with the binding of LPA compared to apo (transparent black). fi, Substochiometric states of LPA binding with monomers bound with 1 LPA (f), 2 LPA in opposite pockets (g), 2 LPA in neighboring pockets (h) and 3 LPA (i). The leftmost panels show a cartoon representation of the TRPV1 tetramer indicating the functional state of each VBP monomer. Monomers are labeled anticlockwise; LPA-occupied monomers are shadowed with magenta. The functional state of the pore is indicated as ‘closed’ (π helix at Y671), ‘open’ (α helix at Y671 with S6 moved away from the pore to the same extent as fully occupied LPA) and ‘intermediate’ (‘inter.’, α helix at Y671 with S6 positioned between that of apo and fully occupied LPA).
Extended Data Fig. 1
Extended Data Fig. 1. Supplementary TRPV1 empty pocket data.
(a) Vanilloid pocket with empty-pocket TRPV1 at 4 °C. (b) Pore profile for empty-pocket TRPV1 at 4 °C. Pore radius was determined using the HOLE program. Black is apo TRPV1 and orange is empty-pocket TRPV1. (c) Key pore residues of empty-pocket TRPV1 (orange) compared to apo TRPV1 (PDB-5IRZ). Density for M682 is shown. (d) Comparing the density for an outer leaflet lipid in the apo (PDB-5IRZ) and the empty-pocket states. The resident lipid in PDB-5IRZ (black sticks) and the outer leaflet lipid (dark red sticks) are shown superimposed beside the 25 °C data to highlight the binding overlap of the two lipids. (e) Upper methionine restriction (M644) and G683 of apo TRPV1 (PDB-5IRZ). (f) Upper methionine restriction (M644) and lower methionine restriction (M682) of TRPV1 in the empty-pocket pocket at 25 °C.
Extended Data Fig. 2
Extended Data Fig. 2. Structural details revealed by the brominated lipid data.
(a) Superimposition of the transmembrane region of TRPV1 in the apo (black), PI-Br4-bound (purple), and PIP2-Br4-bound (blue) states. (b) Patch clamp summary of TRPV1 purified and reconstituted into defined liposomes, in conditions without phosphoinositides (patch clamp recordings, n = 27), with PIP2 (n = 16), or PIP2-Br4 (n = 27) added. Currents were evoked with 10 µM capsaicin at a membrane potential of +120 mV. Hollow circles represent individual data points, bar graph indicates mean ± S.E.M. for the condition. Statistical significance was determined by Kruskal-Wallis test (H = 24.8, p = 4.2 × 10⁻⁶) and post-hoc Dunn’s test using Bonferroni correction (p = 1.6 × 10⁻⁵ for No Phosphoinositides vs PIP2, p = 4.6 × 10⁻⁴ for No Phosphoinositides vs PIP2-Br4, p = 0.60 for PIP2 vs PIP2-Br4), *** p < 0.001. (c) Lipid headgroup densities for PI-Br4 and PIP2-Br4. One monomer is shown for clarity. (d) Higher resolution for the N-terminus and C-terminus of the PI-Br4 consensus map allows for further modeling of the N-terminus (starting at residue 177) and the remaining C-terminus of the truncated TRPV1 construct (up to residue 764). (e) Captured density at the selectivity filter in the PI-Br4 consensus map models well to a [Na(H2O)2]+ cation coordinated to G643. (f) Well-defined densities for key residues as revealed in the PIBr4 consensus map. (g) Lipid density in a binding pocket within the S1 to S3 transmembrane helices shows well-defined features for a PC headgroup, importantly the tri-lobular of the quaternary amine group. Data shown is from the PI-Br4 data in Conformation 1. Source data
Extended Data Fig. 3
Extended Data Fig. 3. Real and calculated maps used for difference map analysis.
(a) Maps used for PI-Br4 analysis. (b) Maps used for the bromine analysis for PIP2-Br4. (c) Maps used for the headgroup analysis for PIP2-Br4. Insets show close ups of the maps.
Extended Data Fig. 4
Extended Data Fig. 4. TRPV1 bound with diC8-PIP2 in the dilated state.
(a) Top: Top-down view of diC8-PIP2 (green sticks and balls) and surrounding helices. Grey ghost tubes are TRPV1 bound with diC8-PIP2 in the closed state and green tubes are in the dilated state. Bottom: schematic comparing the helical positions between the closed and dilated states. Pink triangles indicate the steric overlap between the diC8-PIP2 molecule in the dilated state and the transmembrane helices of TRPV1 in the closed state. (b) Comparisons of the dilated state of TRPV1 with diC8-PIP2 bound and other states. (c) Densities for cholesterol and a lipid (modeled as DOPC) that is found in a cleft between the S6 and S5 helices of adjacent monomers (see Fig. 3). (d) Interatom distances between two opposite cholesterol molecules demonstrating the pore radius formed by cholesterol. (e) Extra densities within the pore that are modeled as ordered water molecules due to the hydrophobic effect. 3 of the 4 cholesterol molecules are shown for clarity.
Extended Data Fig. 5
Extended Data Fig. 5. Density maps of TRPV1 bound with 0–4 LPA. Each subpanel.
(a-d) shows TRPV1 rotated 90 °Counterclockwise starting with pocket A (a) and ending with pocket D (d). Density corresponding to the resident phosphoinositide lipid is shown as black and density corresponding to LPA is shown as magenta.
Extended Data Fig. 6
Extended Data Fig. 6. LPA sub-stoichiometric ligand densities.
Densities for Y511 and LPA or the resident lipid are shown for each monomer. LPA = magenta; resident lipid = black. (a) LPAx1. (b) LPAx2 opposite. (c) LPAx2 neighboring. (d) LPAx3.
Extended Data Fig. 7
Extended Data Fig. 7. Densities of key residues lining the pore of the sub-saturating states.
(a) LPAx1. (b) LPAx2 in opposite pockets. (c) LPAx2 in neighboring pockets. (d) LPAx3. Interatom distances of the closest non-hydrogen atoms for the gating residues and the lower methionine filter are shown.
Extended Data Fig. 8
Extended Data Fig. 8. Intermediate states and mechanism of allostery.
(a) Intermediate states of the S6 helices. Steric clashes preventing full opening of the S6 helix are shown as pink triangles. Angles of opening are shown as a measure of the intermediate state. For LPAx3, the S6-C helix is distorted from a typical α-helical structure. (b) Steric clash between the superimposed position of Y511 in the closed state (grey) and L574 in the LPAx4 state (magenta) shows that the inward movement of Y511 is necessary for open transitions to occur. Boxed figure shows a zoom-in of the steric clash represented as pink pseudobonds (<2.5 Å distance). (c) Proposed mechanism for the LPA-induced opening of TRPV1 as the channel goes from apo state (grey) to one completely occupied by LPA (magenta). Residues in contact with M682 (< 5.0 Å) as it switches positions with L681 due to the π-α helix transition are highlighted. 1. M682 maintains contact with several hydrophobic residues in the apo state. 2. The S4-S5 linker moves inward toward the pocket because of Y511 flipping toward the pocket with LPA bound; the space around M682 opens. 3. S5 and S6 dilate away from the pore axis because of the void created by the moving of the S4-S5 linker; M682 is able to rotate towards the pore axis and the π-α transition occurs.
Extended Data Fig. 9
Extended Data Fig. 9. K710 marks a potential ingress tunnel for LPA.
(a) K710 (blue) sits near the membrane surface and approximately 20 Å away from the VBP. (b) An access tunnel (blue) connecting K710 to the VBP as identified by the program CAVER. (c) Size of the tunnel as determined from CAVER. (d) Surface charge map of TRPV1 with location of putative tunnel indicated by red box. (e) Surface charge map of the tunnel identified by CAVER with the corresponding model of TRPV1-LPAx4 below.

Update of

References

    1. Estacion, M., Sinkins, W. G. & Schilling, W. P. Regulation of Drosophila transient receptor potential-like (TrpL) channels by phospholipase C-dependent mechanisms. J. Physiol.530, 1–19 (2001). 10.1111/j.1469-7793.2001.0001m.x - DOI - PMC - PubMed
    1. Huang, J. et al. Activation of TRP channels by protons and phosphoinositide depletion in Drosophila photoreceptors. Curr. Biol.20, 189–197 (2010). 10.1016/j.cub.2009.12.019 - DOI - PubMed
    1. Rohacs, T. Phosphoinositide regulation of TRP channels. Handb. Exp. Pharmacol.223, 1143–1176 (2014). 10.1007/978-3-319-05161-1_18 - DOI - PMC - PubMed
    1. Chuang, H. H. et al. Bradykinin and nerve growth factor release the capsaicin receptor from PtdIns(4,5)P2-mediated inhibition. Nature411, 957–962 (2001). 10.1038/35082088 - DOI - PubMed
    1. Gao, Y., Cao, E., Julius, D. & Cheng, Y. TRPV1 structures in nanodiscs reveal mechanisms of ligand and lipid action. Nature534, 347–351 (2016). 10.1038/nature17964 - DOI - PMC - PubMed