. 2024 Jun;25(6):2610-2634.
doi: 10.1038/s44319-024-00147-0. Epub 2024 May 2.

Synaptotagmin-11 facilitates assembly of a presynaptic signaling complex in post-Golgi cargo vesicles

Affiliations

Synaptotagmin-11 facilitates assembly of a presynaptic signaling complex in post-Golgi cargo vesicles

Luca Trovò et al. EMBO Rep. 2024 Jun.

Abstract

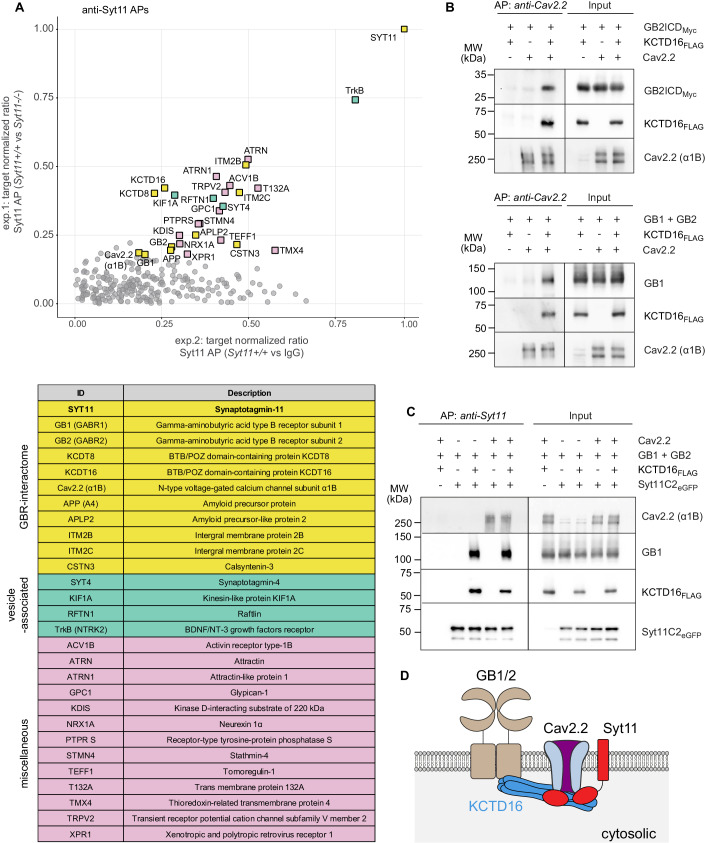
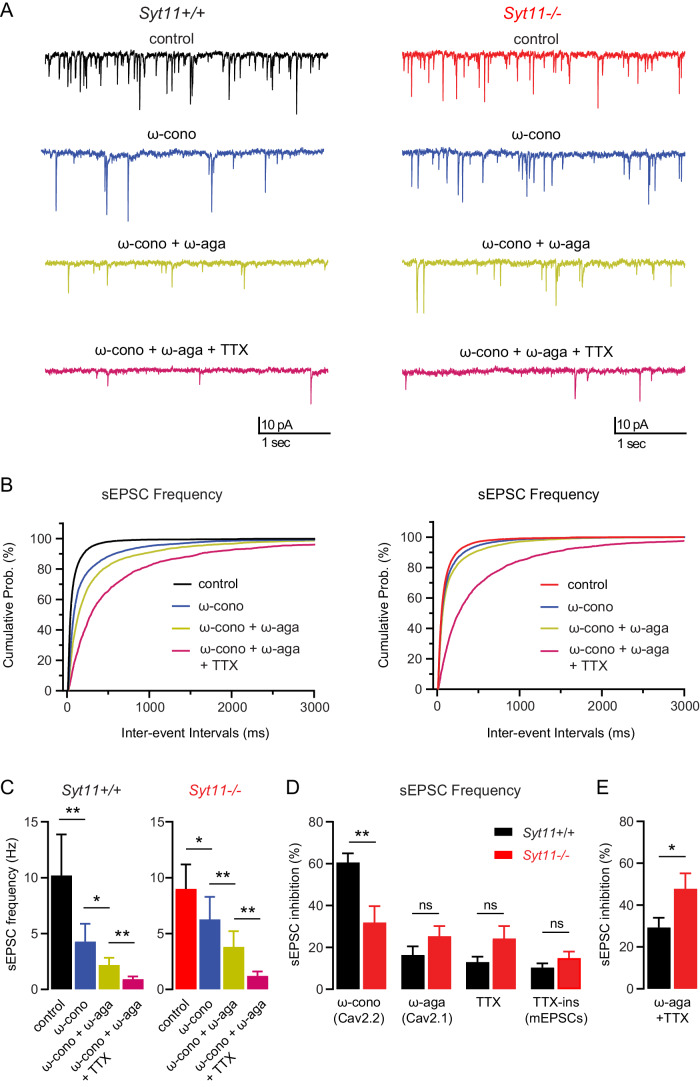
GABAB receptors (GBRs), the G protein-coupled receptors for GABA, regulate synaptic transmission throughout the brain. A main synaptic function of GBRs is the gating of Cav2.2-type Ca2+ channels. However, the cellular compartment where stable GBR/Cav2.2 signaling complexes form remains unknown. In this study, we demonstrate that the vesicular protein synaptotagmin-11 (Syt11) binds to both the auxiliary GBR subunit KCTD16 and Cav2.2 channels. Through these dual interactions, Syt11 recruits GBRs and Cav2.2 channels to post-Golgi vesicles, thus facilitating assembly of GBR/Cav2.2 signaling complexes. In addition, Syt11 stabilizes GBRs and Cav2.2 channels at the neuronal plasma membrane by inhibiting constitutive internalization. Neurons of Syt11 knockout mice exhibit deficits in presynaptic GBRs and Cav2.2 channels, reduced neurotransmitter release, and decreased GBR-mediated presynaptic inhibition, highlighting the critical role of Syt11 in the assembly and stable expression of GBR/Cav2.2 complexes. These findings support that Syt11 acts as a vesicular scaffold protein, aiding in the assembly of signaling complexes from low-abundance components within transport vesicles. This mechanism enables insertion of pre-assembled functional signaling units into the synaptic membrane.

Keywords: Cav2.2; GABA-B; KCTD16; Receptor Signaling Complex Assembly; Transport Vesicle.


Conflict of interest statement

BB is a member of the scientific advisory board of Addex Therapeutics, Geneva, a pharmaceutical company focused on the development of allosteric modulators for neurological disorders. All other authors declare no competing interests.

Figures

Figure 1
Figure 1. Syt11 assembles with GBR/Cav2.2 complexes by binding to both KCTD16 and Cav2.2.
(A) Abundance ratios of proteins identified in APs from solubilized Syt11+/+ and Syt11−/− mouse brain membranes using target-specific anti-Syt11 antibodies and control IgG (target-normalized ratio values (tnRs), see Methods). Proteins that were consistently enriched (tnR > 0.18) in Syt11 APs from Syt11+/+ brain membranes compared to control Syt11 APs from Syt11−/− brain membranes (exp.1) and control APs with pre-immunization IgG (exp.2) are indicated and listed in the table. Among the identified 28 proteins, 11 were previously identified as constituents of native GBR-complexes (highlighted in yellow), 4 are vesicle-associated proteins (green), and 13 miscellaneous proteins (pink). (B, C) AP experiments in transfected HEK293T cells. (B) Co-AP of the Myc-tagged intracellular C-terminal domain of GB2 (GB2ICD; top), which mediates binding of GBRs to KCTD proteins (Schwenk et al, 2010) or GB1 (bottom) with Cav2.2 in the presence of FLAG-tagged KCTD16. (C) Co-AP of GB1 and Cav2.2 with the eGFP-tagged cytoplasmic C2A and C2B domains of Syt11 fused to eGFP (Syt11C2eGFP) in the presence of FLAG-tagged KCTD16. Notably, Cav2.2, but not GB1 is detected in anti-Syt11C2eGFP APs in the absence of KCTD16, indicating that Syt11 directly interacts with Cav2.2. The α1B subunit of Cav2.2 channels, co-expressed with auxiliary β and α2δ subunits, was identified on Western blots using the anti-Cav2.2 antibody from Millipore (# AB5154). For APs demonstrating the specificity of the interaction of KCTD16 with Syt11, see Fig. EV1B. (D) Scheme depicting the interaction of Syt11 with GBR/Cav2.2 complexes. Syt11 directly binds to Cav2.2 and KCTD16, an auxiliary subunit of GBRs that links the GB2 subunit of GBRs to Cav2.2 channels. Source data are available online for this figure.
Figure 2
Figure 2. Syt11 binding to GBRs does not modulate G protein signaling.
(A) GABA dose-response curves of GBRs expressed in HEK293T cells together with KCTD16 in the absence (control) or presence of Syt11. Gα signaling was monitored using a luciferase-reporter assay based on artificially coupling GBRs via chimeric Gαqi to phospholipase C (top). Expression of Syt11 does not significantly change basal and GABA-induced luciferase activity. Non-linear regression curve fits of n = 8 independent experiments per condition. Mean ± SEM, p = 0.5929, extra sum-of-squares F-test (middle). Baseline activity (BL), p = 0.5882, unpaired t-test (bottom). (B) Gβγ released upon GBR activation in HEK293T cells was monitored using a BRET assay reporting the binding of Venus-tagged Gβγ to a membrane-associated GRK3ct-luciferase (top). Representative experiments (middle) and quantification of BRET changes (bottom) induced by the application of GABA and the inverse agonist CGP54626. Co-expression of Syt11 does not significantly alter GABA (p = 0.2068) and CGP54626 (p = 0.9777) induced BRET changes compared to control (unpaired Student’s t test). Mean ± SEM from n = 8 independent experiments recorded in triplicates, ns = not significant. Source data are available online for this figure.
Figure 3
Figure 3. GBR/Syt11 complexes traffic in axons and dendrites and localize to synaptic sites.
(A) Scheme illustrating the principle of BiFC. Complex formation of Syt11-VN with GB2-VC in the presence of KCTD16 leads to the reconstitution of Venus fluorescence. For validation of the GB2-VC/Syt11-VN BiFC in transfected HEK293T cells, see Fig. EV2. (B) Representative confocal images of cultured Kctd16+/+ and Kctd16−/− hippocampal neurons (DIV10) transfected with Syt11-VN and GB2-VC. Venus BiFC is observed in axons and dendrites of KCTD16+/+ neurons. In Kctd16−/− neurons, low background BiFC in the soma is likely due to Venus self-assembly in the ER. Transfected neurons were identified using mCherry as a volume marker. Scale bar: 10 μm. (C) Higher magnification of an axon and dendrite of a mature hippocampal neuron (DIV14) transfected with Syt11-VN, GB2-VC, and mCherry as a volume marker. The BiFC complex (Venus) partly co-localized with endogenous synaptophysin in axons (arrowheads). In dendrites, the BiFC complex localized to dendritic shafts and spine necks but not to spine heads, as identified by PSD95 staining. Scale bar: 5 μm. (D) BiFC and endogenous PSD95 fluorescence along BiFC positive spines (normalized to the peak fluorescence). The BiFC signal is high in spine necks and absent from spine heads, contrasting with the distribution of PSD95. Data are presented as mean ± SEM from n = 83 spines (4 independent preparations). (E) Time-lapse images and a related kymograph of well-separated fluorescent Syt11-VN/GB2-VC complexes moving anterogradely (white arrowhead) and retrogradely (black arrowhead) in an axon. For quantification of kymographs, see Fig. EV3A and B. (F) Representative confocal images of hippocampal neurons transfected with Syt11-VN, GB2-VC, and either NPY-mCherry or Rab5-mCherry. The fluorescent Syt11-VN/GB2-VC complex predominantly co-localizes with NPY-mCherry. MAP2 staining identifies dendrites. Higher magnifications of dendrites are shown at the bottom. Arrowheads indicate examples of co-localization. Scale bar: 10 μm. For quantification of co-localization, see Fig. EV3C. Source data are available online for this figure.
Figure 4
Figure 4. Syt11 facilitates recruitment of GBRs and Cav2.2 channels into post-Golgi vesicles.
(A) Representative single plane SIM images of an axon and dendrite of a cultured hippocampal neuron (DIV14). After fixation and permeabilization, neurons were stained for endogenous NPY (magenta), GB2 (green), and Cav2.2 (cyan). Staining of the α1B subunit of Cav2.2 channels was performed with the anti-Cav2.2 antibody from Alamone Labs (#ACC-002, RRID:AB2039766), which was validated with CNCNA1b−/− mouse tissue (Murakami et al, 2007). Arrowheads indicate examples of NPY+ vesicles carrying GB2 and Cav2.2. Scale bar: 5 μm. (B) Representative 3D reconstruction of a stack of SIM images showing the distribution of NPY (magenta), GB2 (green), and Cav2.2 (cyan) in the Syt11+/+ axon depicted in (A). Examples of four NPY+ vesicle populations are shown on the right: Double positive (GB2+/Cav2.2+), GB2 single positive (GB2+/Cav2.2-), Cav2.2 single positive (GB2-/Cav2.2+), and double negative (GB2-/Cav2.2-). (C) Quantification of the NPY+ vesicle-density in axons and dendrites of Syt11+/+ and Syt11−/− neurons. A total of n = 21 neurons per genotype from 4 independent preparations were analyzed. (D) Stacked bar chart illustrating the contribution of the four vesicle populations to NPY+ vesicles. The proportion of double positive (GB2+/Cav2.2+) vesicles is significantly reduced in Syt11−/− axons and dendrites, with a concomitant increase in the proportion of GB2 single positive and Cav2.2 single positive vesicles. Numbers are presented as a percentage of the total number of NPY+ vesicles. (E) Analysis of NPY+ vesicle populations. The proportion of double positive (GB2+/Cav2.2+) vesicles is significantly reduced in both the GB2+ and Cav2.2+ populations in the axons and dendrites of Syt11−/− neurons. Axons, n = 26 neurons; dendrites, n = 28 neurons from 4 independent preparations. Data information: Data are presented as mean ± SEM. Statistical significance was determined by unpaired Student’s t-test (C) or Mann–Whitney U test (D and E). ns not significant; ****p < 0.0001. Source data are available online for this figure.
Figure 5
Figure 5. Reduced synaptic transmission and GBR-mediated inhibition of glutamate release in cultured Syt11−/− hippocampal neurons.
(A) Representative traces of sEPSCs from Syt11+/+ (black) and Syt11−/− (blue) cultured primary hippocampal neurons recorded in the presence of gabazine (10 µM) at DIV15-19. (B) Cumulative probability distribution of sEPSC inter-event intervals in Syt11+/+ and Syt11−/− neurons. The sEPSC frequency (inset) was significantly reduced in Syt11−/− compared to Syt11+/+ neurons (Syt11+/+: 9.92 ± 1.25 Hz vs Syt11−/−: 6.03 ± 0.56 Hz). (C) Cumulative probability distribution of sEPSC amplitudes in Syt11+/+ and Syt11−/− neurons. The average sEPSC amplitude (inset) was not significantly different between the genotypes (Syt11+/+: 22.06 ± 2.06 pA vs Syt11−/−: 23.55 ± 1.73 pA). (D) Representative traces of sEPSCs recorded from a Syt11+/+ (top) and Syt11−/− (bottom) neuron in the presence of gabazine (10 µM) before (control, black/red) and after application of baclofen (100 μM, blue). (E) Cumulative probability distributions of sEPSC inter-event intervals from Syt11+/+ (top) and Syt11−/− (bottom) neurons. In both genotypes, the sEPSC frequency (insets) was significantly reduced in the presence of baclofen (bac) compared to control (con). Upper inset: Syt11+/+ neurons (con: 9.92 ± 1.25 Hz vs bac: 2.66 ± 0.62 Hz). Lower inset: Syt11−/− neurons (con: 6.03 ± 0.56 Hz vs bac: 2.32 ± 0.29 Hz). (F) Cumulative probability distributions of sEPSC amplitudes from Syt11+/+ (top) and Syt11−/− (bottom) neurons. In both genotypes, the average amplitude (insets) was significantly decreased in the presence of baclofen (bac) compared to control (con). Upper inset: Syt11+/+ neurons (con: 22.06 ± 2.06 pA vs bac: 15.23 ± 1.18 pA). Lower inset: Syt11-/ neurons (con: 23.55 ± 1.73 pA vs bac: 14.06 ± 1.10 pA). (G) Number of sEPSCs plotted against sEPSC amplitudes in Syt11+/+ neurons in the presence and absence (con) of baclofen (left). Activation of GBRs significantly inhibits small amplitude (<10 pA) and large amplitude (>10 pA) events (right). (H) Number of sEPSCs plotted against sEPSC amplitudes in Syt11−/− neurons in the presence and absence (con) of baclofen (left). Activation of GBRs significantly inhibits large amplitude (>10 pA) but not small amplitude (<10 pA) events. Data information: Data are presented as mean ± SEM. Statistical significance was determined by Mann–Whitney U test (B), unpaired Student’s t-test (C), paired Student’s t-test (E, upper inset and F) or Wilcoxon matched-pairs signed-rank test (E, lower inset; G and H). ns not significant; **p < 0.01, ***p < 0.001, ****p < 0.0001. Syt11+/+, n = 14 neurons; Syt11−/−, n = 19 neurons from 6 preparations. Source data are available online for this figure.
Figure 6
Figure 6. Cultured Syt11−/− hippocampal neurons exhibit a deficit in presynaptic Cav2.2 channels.
(A) Representative traces of sEPSCs from Syt11+/+ and Syt11−/− hippocampal neurons in culture recorded at DIV15-19 in the presence of gabazine (10 µM) before (control, black/red) and after application of ω-conotoxin (1 µM, blue), ω-conotoxin + ω-agatoxin (500 nM, yellow) and ω-conotoxin + ω-agatoxin + TTX (1 µM, magenta). (B) Cumulative probability distributions of sEPSC inter-event intervals of Syt11+/+ and Syt11−/− neurons recorded as in (A). (C) Summary bar graph depicting the sEPSC frequency of Syt11+/+ and Syt11−/− neurons recorded as in (A). In both genotypes, the frequency of sEPSCs was significantly reduced by the application of ω-conotoxin, ω-conotoxin + ω-agatoxin, and ω-conotoxin + ω-agatoxin + TTX. (D) Summary bar graph depicting the percentage inhibition of sEPSC frequency by ω-conotoxin, ω-agatoxin, and TTX in cultured hippocampal neurons of Syt11+/+ (black) and Syt11−/− mice (red). Inhibition by ω-conotoxin (blocking Cav2.2 channels) is significantly reduced in Syt11−/− compared to Syt11+/+ neurons (Syt11+/+: 60.55 ± 4.42% vs Syt11−/−: 31.90 ± 7.80%). The ω-agatoxin-sensitive (blocking Cav2.1 channels) and TTX-sensitive components of inhibition, as well as the TTX-insensitive component (mEPSCs) show no significant difference between genotypes. (E) The combined ω-agatoxin- and TTX-sensitive component of inhibition is significantly increased in Syt11−/− compared to Syt11+/+ neurons (Syt11+/+: 29.33 ± 4.64% vs Syt11−/−: 47.78 ± 7.37%). Data information: Data are presented as mean ± SEM. Statistical significance was determined by Wilcoxon matched-pairs signed-rank test with Bonferroni correction for multiple comparison (C) or Mann–Whitney U test (D and E). ns not significant; *p < 0.05, **p < 0.01. n = 9–11 neurons per genotype from 4 preparations. Source data are available online for this figure.
Figure EV1
Figure EV1. Mapping of protein-protein interactions within Syt11/GBR/Cav2.2 complexes in HEK293T cells.
(A) Cav2.2 co-purifies with the Myc-tagged intracellular C-terminal domain of GB2 (GB2ICD) in the presence of FLAG-tagged KCTD16 from total cell lysates of transfected HEK293T cells. The α1B subunit of Cav2.2 channels was co-expressed with auxiliary β and α2δ subunits. (B) HA-tagged GB2 co-purifies with eGFP-tagged Syt11 in the presence of Myc-tagged KCTD16, but not in the presence of KCTD8 or KCTD12 from total cell lysates of transfected HEK293T cells. HA-tagged GB2Y902A, a GB2 mutant that cannot bind KCTD proteins (Schwenk et al, 2010), does not co-purify with eGFP-tagged Syt11 in the presence of KCTD16. (C) Significantly increased co-purification of Myc-tagged Syt11 with the α1B subunit of Cav2.2 channels compared to α1A subunit of Cav2.1 channels from total cell lysates of transfected HEK293T cells. Auxiliary β and α2δ subunits were co-expressed with the α1A and α1B subunits. Representative Western blots (left) and quantification from n = 4 independent experiments (right). Values are presented as mean ± SEM, *p = 0.028, Mann–Whitney U test.
Figure EV2
Figure EV2. Validation of the GB2-VC/Syt11-VN BiFC in transfected HEK293T cells.
(A) Representative confocal images of HEK293T cells expressing GB2-VC and Syt11-VN tagged with the C-terminal (VC) and N-terminal (VN) fragments of the fluorescent Venus protein (top row). Reconstitution of Venus fluorescence is observed only in cells expressing KCTD16. In control experiments, replacing Syt11-VN with Syt11ΔC2-VN lacking the C2A and C2B domains (middle row) or Syt1-VN (bottom row) does not reconstitute Venus fluorescence. Transfected cells were identified using mCherry. Scale bar: 10 μm. (B) Representative Western blots (left) and corresponding quantifications from n = 5 independent experiments (right) of APs with anti-HA antibodies from cell lysates of transfected HEK293T cells expressing the indicated constructs. AP and input lanes were probed with anti-Syt11 (top), anti-KCTD16 (middle), and anti-HA (bottom) antibodies. The presence of VN- or VC-tags on Syt11 and GB2, respectively, does not significantly alter the amounts of KCTD16 (p = 0.436) and Syt11 (p = 0.858) co-purified with GB2. Values are presented as mean ± SEM, ns = not significant, unpaired t-test.
Figure EV3
Figure EV3. Trafficking analysis of GB2-VC/Syt11-VN complexes in axons and dendrites of cultured hippocampal neurons.
(A) Live-cell imaging analysis of GB2-VC/Syt11-VN complexes (Venus fluorescence) in transfected neurons. Left: Percentage of mobile and immobile complexes. Right: Percentage of complexes traveling antero- and retrograde. The number of complexes analyzed is indicated in brackets. Data are from 4 independent transfections. (B) Average velocities of GB2-VC/Syt11-VN complexes traveling antero- and retrograde. Axons: anterograde, n = 16 complexes; retrograde, n = 23. Dendrites: anterograde, n = 15; retrograde, n = 20. (C) Co-localization of GB2-VC/Syt11-VN complexes and mCherry-tagged NPY or Rab5 in transfected neurons. The Manders’ coefficients report the degree of overlap between Venus and mCherry fluorescence. NPY-Cherry, n = 18 neurons; Rab5-mCherry, n = 17 neurons from 3 independent transfections. Data information: Data are presented as mean ± SEM. Statistical significance was determined by two-way ANOVA (B) or Mann–Whitney U test (C). ns not significant; ***p < 0.001, ****p < 0.0001.
Figure EV4
Figure EV4. Syt11 stabilizes GBRs and Cav2.2 channels but not A1R at the cell surface of neurons.
(A) Representative confocal images of dendrites of cultured Syt11+/+ and Syt11−/− hippocampal neurons (DIV14). Neurons were incubated with Transferrin-AF647 (magenta) for 30 min to label early endosomes. Fixed and permeabilized neurons were then stained for endogenous GB2, Cav2.2, or A1R (all green). Arrowheads indicate examples of Transferrin-AF647+ vesicles carrying GB2, Cav2.2, or A1R. Scale bar, 5 μm. Increased Transferrin-AF647 uptake is observed in Syt11−/− compared to Syt11+/+ neurons. n = 21 neurons for each genotype from 3 independent experiments. (B) Quantification of co-localization of GB2, Cav2.2, or A1R with Transferrin-AF647 in experiments described in (A). The Pearson’s correlation coefficients indicate the degree of co-localization between Transferrin-AF647 and GB2, Cav2.2, or A1R in dendrites. In Syt11−/− neurons, co-localization with Transferrin-AF647 is increased for endogenous GB2 and Cav2.2, indicating increased internalization. GB2, n = 27 neurons; Cav2.2, n = 18 neurons; A1R, n = 20 neurons from 3 independent experiments. (C) Representative confocal images of dendrites of cultured Syt11+/+ and Syt11−/− hippocampal neurons (DIV14) stained for endogenous GB2 (green) and the lysosome marker LAMP1 (magenta). Arrowheads indicate examples of co-localization of GB2 with LAMP1. Scale bar, 5 μm. Pearson’s correlation coefficient indicates increased co-localization of GB2 with LAMP1 in dendrites of Syt11−/− neurons. Syt11+/+, n = 18 neurons; Syt11−/−, n = 17 neurons from 3 independent experiments. Data information: Data are presented as mean ± SEM. Statistical significance was determined by Welch’s t-test (A), unpaired Student’s t-test (B), or Mann–Whitney U test (C). ns not significant; **p < 0.01.
Figure EV5
Figure EV5. Lack of tonic or constitutive GBR activity in cultured Syt11+/+ and Syt11−/− hippocampal neurons.
(A) Representative traces of sEPSCs recorded from a Syt11+/+ (top) and Syt11−/− (bottom) neuron in the presence of gabazine (10 µM) before (control, black/red) and after application of CGP54626 (4 μM, yellow). (B) Cumulative probability distributions of sEPSC inter-event intervals from Syt11+/+ (top) and Syt11−/− (bottom) neurons recorded as in (A). In both genotypes, the sEPSC frequency (insets) was not significantly different in the presence of CGP54626 (CGP) compared to control (con). Upper inset: Syt11+/+ neurons (con: 8.16 ± 2.46 Hz vs CGP: 7.07 ± 1.83 Hz). Lower inset: Syt11−/− neurons (con: 5.74 ± 1.32 Hz vs CGP: 6.31 ± 1.67 Hz). n = 5 neurons per genotype from 3 preparations. (C) Summary bar graph showing the sEPSC frequency of Syt11+/+ (left) and Syt11−/− (right) neurons in the presence of gabazine (10 µM) before (control, black/red) and after application of baclofen (100 µM, blue) and baclofen + CGP54626 (4 µM, yellow). Syt11+/+, n = 11 neurons; Syt11−/−, n = 16 neurons from 6 preparations. Data information: Data are presented as mean ± SEM. Statistical significance was determined by Wilcoxon matched-pairs signed-rank test (B) or Friedman test and Dunn’s multiple comparisons (C). ns not significant; ****p < 0.0001.

Similar articles

Cited by

References

    1. Ahmari SE, Buchanan J, Smith SJ. Assembly of presynaptic active zones from cytoplasmic transport packets. Nat Neurosci. 2000;3:445–451. doi: 10.1038/74814. - DOI - PubMed
    1. Armando S, Quoyer J, Lukashova V, Maiga A, Percherancier Y, Heveker N, Pin JP, Prezeau L, Bouvier M. The chemokine CXC4 and CC2 receptors form homo- and heterooligomers that can engage their signaling G-protein effectors and βarrestin. FASEB J. 2014;28:4509–4523. doi: 10.1096/fj.13-242446. - DOI - PubMed
    1. Arora S, Saarloos I, Kooistra R, van de Bospoort R, Verhage M, Toonen RF. SNAP-25 gene family members differentially support secretory vesicle fusion. J Cell Sci. 2017;130:1877–1889. doi: 10.1242/jcs.201889. - DOI - PubMed
    1. Bajaj R, Rodriguez BL, Russell WK, Warner AN, Diao L, Wang J, Raso MG, Lu W, Khan K, Solis LS, et al. Impad1 and Syt11 work in an epistatic pathway that regulates EMT-mediated vesicular trafficking to drive lung cancer invasion and metastasis. Cell Rep. 2022;40:111429. doi: 10.1016/j.celrep.2022.111429. - DOI - PMC - PubMed
    1. Benke D, Balakrishnan K, Zemoura K. Regulation of cell surface GABAB receptors: contribution to synaptic plasticity in neurological diseases. Adv Pharm. 2015;73:41–70. doi: 10.1016/bs.apha.2014.11.002. - DOI - PubMed