. 2024 May 2;22(1):216.
doi: 10.1186/s12951-024-02468-7.

A lava-inspired proteolytic enzyme therapy on cancer with a PEG-based hydrogel enhances tumor distribution and penetration of liposomes

Affiliations

A lava-inspired proteolytic enzyme therapy on cancer with a PEG-based hydrogel enhances tumor distribution and penetration of liposomes

Jiaojiao Li et al. J Nanobiotechnology. .

Abstract

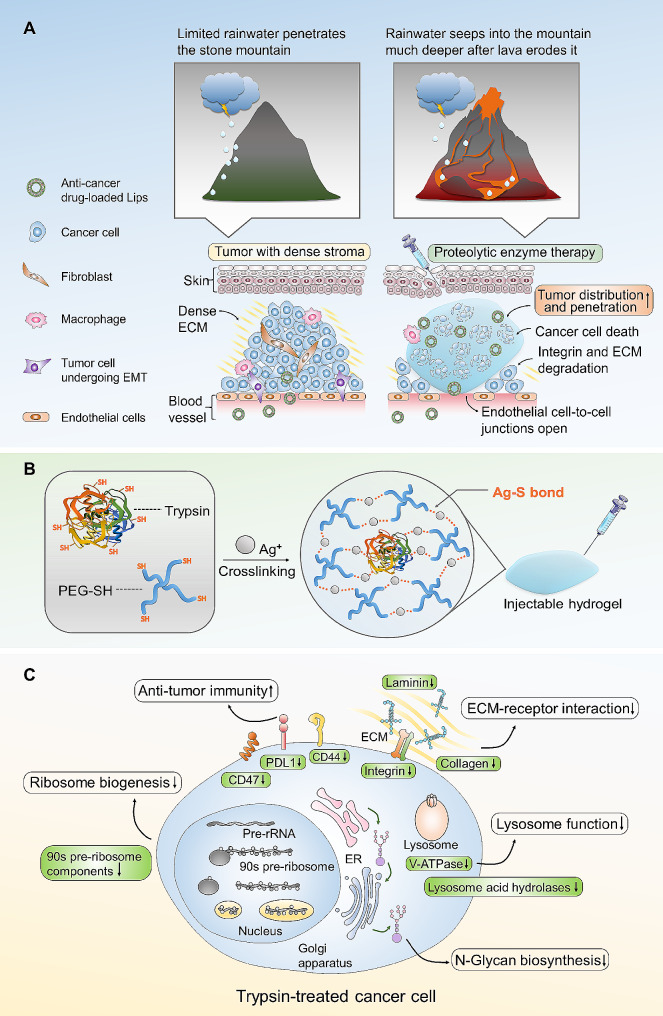
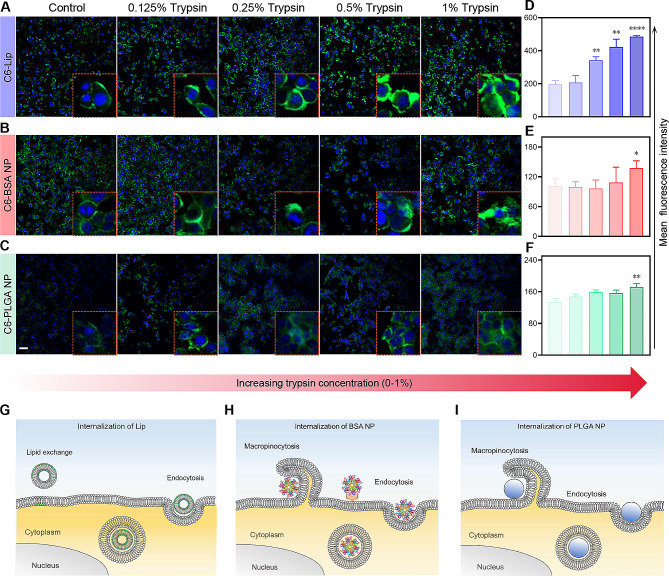
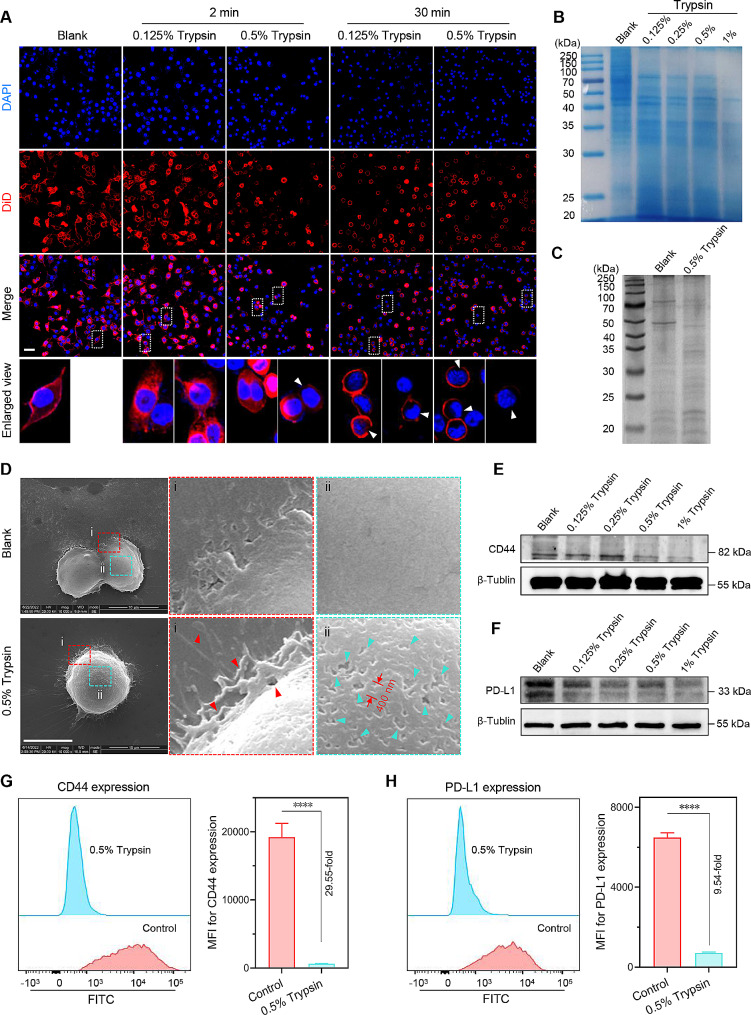
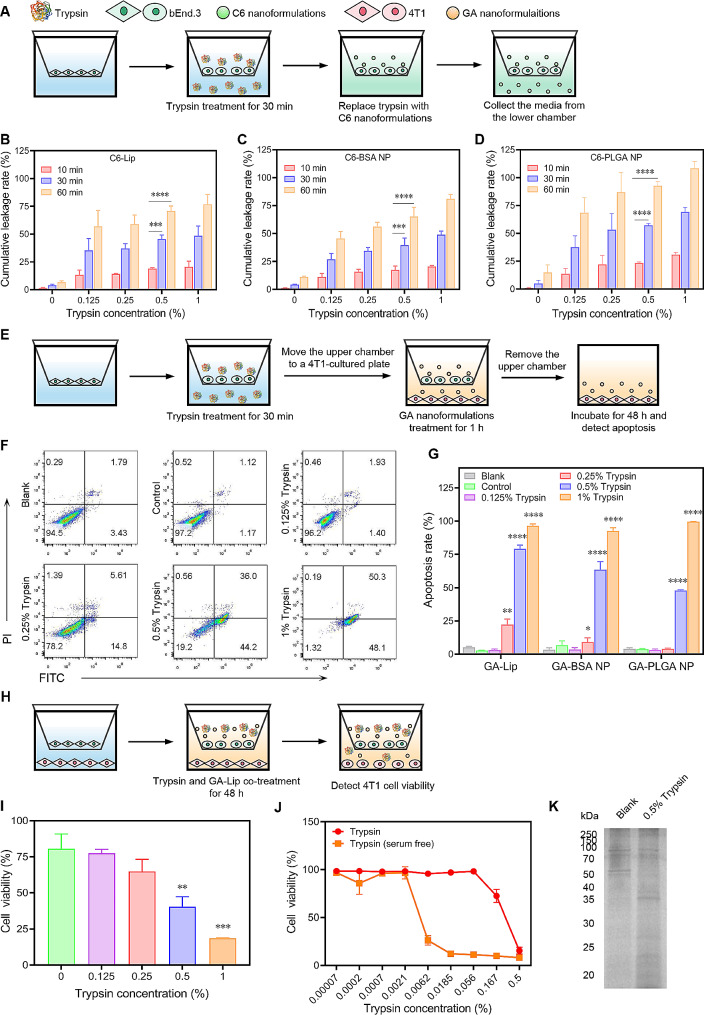
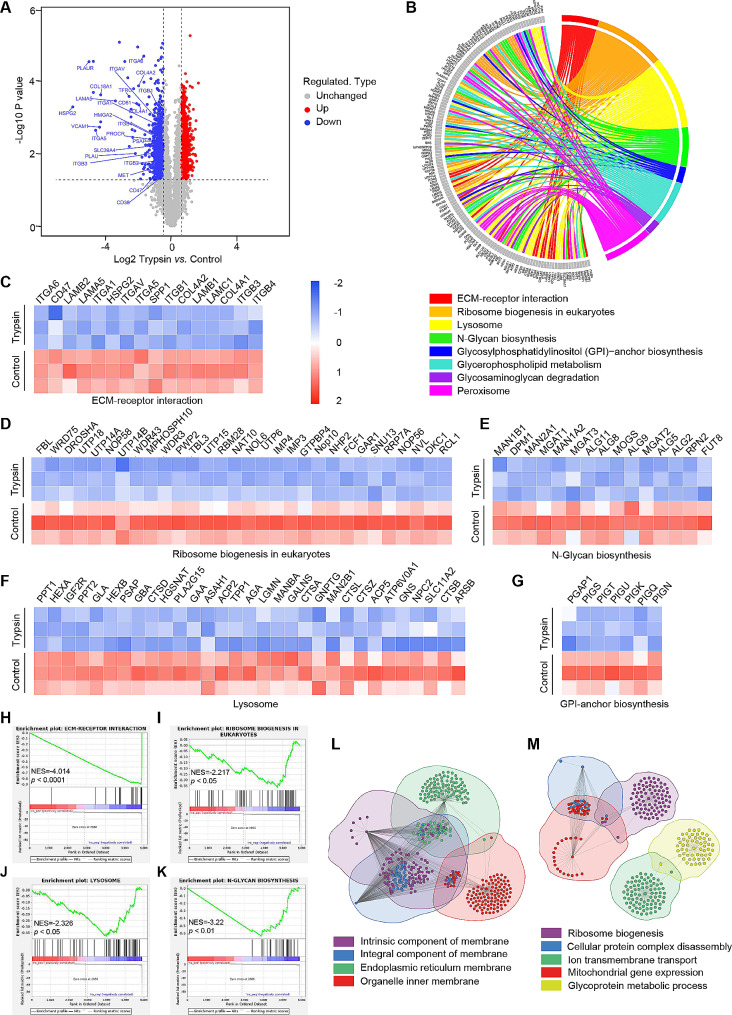
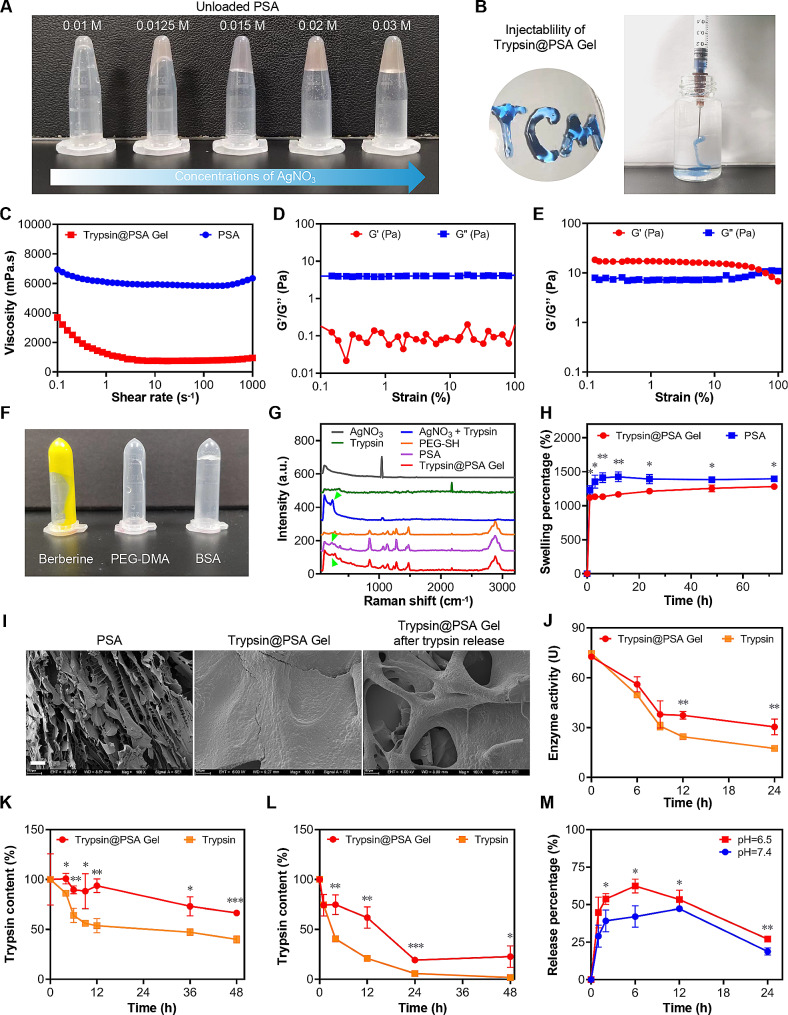
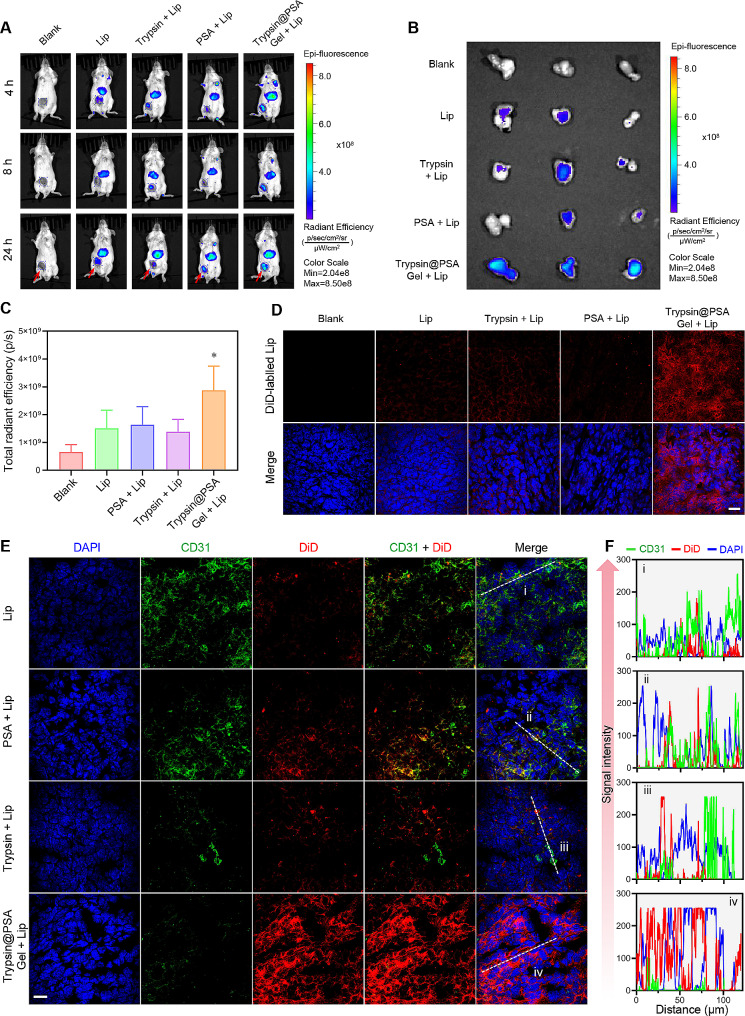
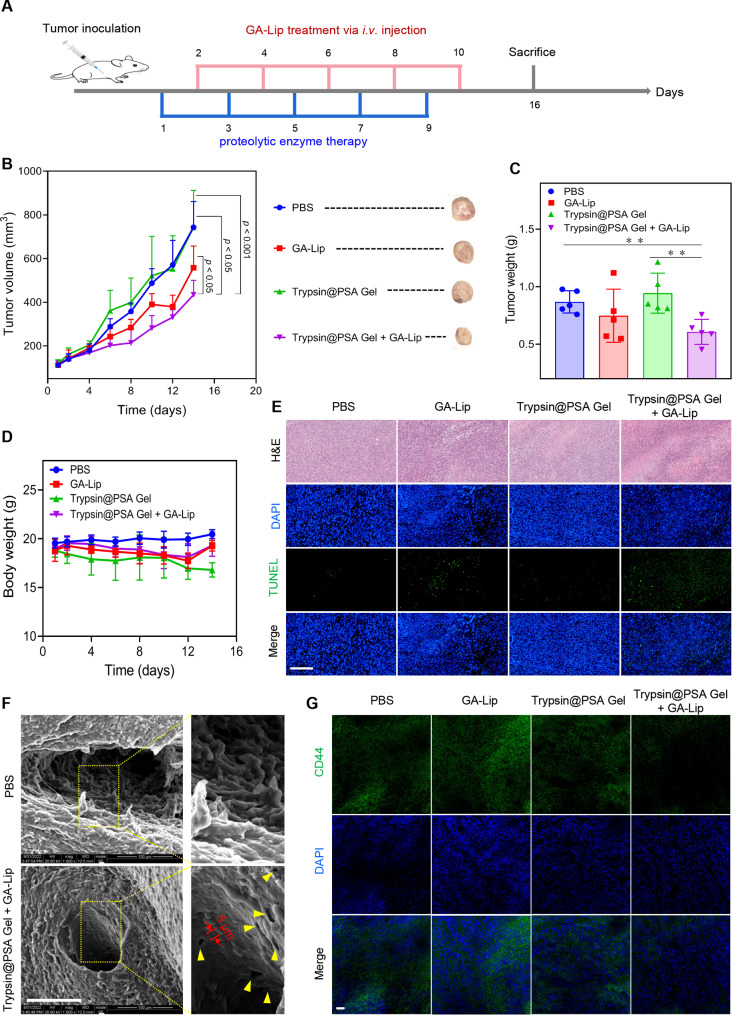
The enhanced permeability and retention (EPR) effect has become the guiding principle for nanomedicine against cancer for a long time. However, several biological barriers severely resist therapeutic agents' penetration and retention into the deep tumor tissues, resulting in poor EPR effect and high tumor mortality. Inspired by lava, we proposed a proteolytic enzyme therapy to improve the tumor distribution and penetration of nanomedicine. A trypsin-crosslinked hydrogel (Trypsin@PSA Gel) was developed to maintain trypsin's activity. The hydrogel postponed trypsin's self-degradation and sustained the release. Trypsin promoted the cellular uptake of nanoformulations in breast cancer cells, enhanced the penetration through endothelial cells, and degraded total and membrane proteins. Proteomic analysis reveals that trypsin affected ECM components and down-regulated multiple pathways associated with cancer progression. Intratumoral injection of Trypsin@PSA Gel significantly increased the distribution of liposomes in tumors and reduced tumor vasculature. Combination treatment with intravenous injection of gambogic acid-loaded liposomes and intratumoral injection of Trypsin@PSA Gel inhibited tumor growth. The current study provides one of the first investigations into the enhanced tumor distribution of liposomes induced by a novel proteolytic enzyme therapy.

Keywords: Enzyme-assisted crosslinking; Hydrogel; Proteolytic enzyme therapy; Tumor distribution of nanomedicine.


Conflict of interest statement

The authors declare no competing interests.

Figures

Scheme 1
Scheme 1
Schematic illustration of Trypsin@PSA Gel-mediated proteolytic enzyme therapy. (A) Lava-inspired proteolytic enzyme therapy with Trypsin@PSA Gel improved tumor distribution and penetration of liposomes. (B) Formation of Trypsin@PSA Gel. Trypsin facilitates the gelation of PEG-SH and AgNO3 based on Ag-S bonds. (C) Overall effects of trypsin on tumor cells and tissues include down-regulating ECM-receptor interaction, lysosome function, N-glycan biosynthesis, ribosome biogenesis, and improving antitumor immunity
Fig. 1
Fig. 1
Influence of short-time trypsin treatment on internalization of C6-labeled nanoformulations. (A-F) Representative confocal images (A-C) and flow cytometry results (D-F) of different nanoformulations’ cellular uptake by 4T1 cells, scale bar = 50 μm. (G-I) Schematic illustration showing the cellular uptake mechanisms of different nanoformulations. All statistical data are presented as mean ± SD, n = 3. *p < 0.05, **p < 0.01, ****p < 0.0001
Fig. 2
Fig. 2
Trypsin treatment permeabilizes 4T1 cell membranes by degradation of total and membrane proteins. (A) DiD-labeled cell membranes after trypsin treatment, scale bar = 50 μm (the white arrows indicate the damaged membrane). (B) Total protein levels after incubating with trypsin for 30 min. (C) Membrane protein levels after 0.5% trypsin treatment for 30 min. (D) Representative SEM images of cell membranes with 0.5% trypsin incubating for 30 min, scale bar = 10 μm (the red and cyan arrows indicate the damages on the surface of 4T1 cells). (E-F) Western blot analysis of (E) CD44 and (F) PD-L1 expression in total proteins after 0.5% trypsin digestion for 30 min. (G-H) Flow cytometry results of (G) CD44 and (H) PD-L1 positive cells after 0.5% trypsin digestion for 30 min. All statistical data are presented as mean ± SD, n = 3. ****p < 0.0001
Fig. 3
Fig. 3
Trypsin treatment enhances nanoformulations’ penetration through endothelial cells. (A) Schematic illustration of (B)-(D). (B-D) Cumulative leakage rate of different nanoformulations through bEnd.3 cells pre-treated with trypsin for 30 min in a Transwell® system. (E) Schematic illustration of (F) and (G). (F-G) Flow cytometry results of apoptosis after trypsin pre-treatment followed by GA nanoformulations administration in a Transwell® system. (H) Schematic illustration of (I). (I) Cell viability of 4T1 after trypsin and GA-Lip co-treated for 48 h in a Transwell® system. (J) Cell viability of 4T1 with trypsin treatment for 48 h. (K) SDS-PAGE results indicating membrane protein levels of bEnd.3 cells after 0.5% trypsin treatment for 30 min. All statistical data are presented as mean ± SD, n = 3. **p < 0.01, ***p < 0.001, ****p < 0.0001
Fig. 4
Fig. 4
Proteomics profiling of 4T1 after 0.5% trypsin treatment for 30 min. (A) Volcano plots showing the down-regulated proteins before and after trypsin treatment. (B) Circos plot depicting major KEGG enrichment pathways. (C-G) Expression profiles in significant down-regulated KEGG enrichment pathways (ECM-receptor interaction, ribosome biogenesis in eukaryotes, N-Glycan biosynthesis, lysosome, and GPI-anchor biosynthesis) relative to proteolytic enzyme therapy. (H-K) GSEA enrichment analysis identifying the major KEGG pathways relative to proteolytic enzyme therapy. (L-M) Gene ontology enrichment analysis indicating the down-regulated proteins in (L) cellular component and (M) biological processes after trypsin enzymolysis
Fig. 5
Fig. 5
Construction and characterizations of Trypsin@PSA Gel. (A) The influence of AgNO3’s concentration on the gelation of unloaded PSA. (B) Injectability of Trypsin@PSA Gel loaded with 15 mg/mL trypsin. (C) The relationship between the viscosity of PSA or Trypsin@PSA Gel and shear rates. (D-E) Elastic moduli of (D) PSA and (E) Trypsin@PSA Gel (G′ and G″ represent storage modulus and loss modulus, respectively). (F) The influence of disulfide bond on PSA gel formation. (G) Raman spectra of AgNO3, trypsin, PEG-SH, the mixture of AgNO3 and trypsin, PSA, and Trypsin@PSA Gel (the green arrows indicate Ag-S bound). (H) The swelling percentage of PSA and Trypsin@PSA Gel. (I) Representative SEM images of PSA, Trypsin@PSA Gel loaded with 15 mg/mL trypsin, and Trypsin@PSA Gel after trypsin release, scale bar = 100 µm. (J) Trypsin activity in free form and Trypsin@PSA Gel at 37 ℃. (K-L) Trypsin stability in free form and Trypsin@PSA Gel at pH 6.5 (K) and 7.4 (L) at 37°C. (M) The release profile of trypsin from Trypsin@PSA Gel at different pH values at 37°C. All statistical data are presented as mean ± SD, n = 3. *p < 0.05, **p < 0.01, ***p < 0.001
Fig. 6
Fig. 6
Proteolytic enzyme therapy facilitates the tumor distribution and penetration of liposomes. (A) Biodistribution of DiD-Lip in tumor-bearing mice with or without Trypsin@PSA Gel treatment (the red arrow indicates the implanted tumors). (B-C) Fluorescence images and total radiant efficiency of DiD in tumors at 48 h post-DiD-Lip injection. (D) Representative confocal images of tumor sections with or without Trypsin@PSA Gel treatment. (E) Representative confocal images showing CD31 expression and DiD-Lip location of tumor sections with or without Trypsin@PSA Gel treatment. (F) Quantification of the green (CD31) and red (DiD) fluorescence signals on the tumors as a function of distance (µm) marked by the white dotted lines in the confocal images in (E). All statistical data are presented as mean ± SD, n = 3. *p < 0.05, scale bar = 20 μm
Fig. 7
Fig. 7
In vivo antitumor efficacy achieved by combination treatment with GA-Lip chemotherapy and proteolytic enzyme therapy. (A) Schematic illustration of the subcutaneous breast cancer model establishment and treatment. (B) Tumor volume variations during and after treatments (Insets indicate representative images of tumors after different treatments). (C) Weights of tumor after different treatments. (D) Body weights of mice during treatments. (E) H&E and TUNEL staining of tumor sections, scale bar = 250 μm. (F) Representative SEM images of tumor blood vessels after PBS or Trypsin@PSA + GA-Lip treatment, scale bar = 100 μm (the dashed square frames represent the lumen of the blood vessel, and the yellow arrows indicate the new-generated pores in blood vessels after proteolytic enzyme therapy). (G) Representative confocal images of CD44-stained tumor sections, scale bar = 50 μm. All statistical data are presented as mean ± SD, n = 5. *p < 0.05, **p < 0.01

Similar articles

Cited by

References

    1. Zhao M, van Straten D, Broekman MLD, Préat V, Schiffelers RM. Nanocarrier-based drug combination therapy for glioblastoma. Theranostics. 2020;10:1355–72. doi: 10.7150/thno.38147. - DOI - PMC - PubMed
    1. Zhao M, Mi D, Ferdows BE, Li Y, Wang R, Li J, Patel D, Kong N, Shi S, Tao W. State-of-the-art nanotechnologies for the detection, recovery, analysis and elimination of liquid biopsy components in cancer. Nano Today. 2022;42:101361. doi: 10.1016/j.nantod.2021.101361. - DOI
    1. Zhao M, Wang R, Yang K, Jiang Y, Peng Y, Li Y, Zhang Z, Ding J, Shi S. Nucleic acid nanoassembly-enhanced RNA therapeutics and diagnosis. Acta Pharm Sin B. 2023;13:916–41. doi: 10.1016/j.apsb.2022.10.019. - DOI - PMC - PubMed
    1. Wong KH, Yang D, Chen S, He C, Chen M. Development of nanoscale drug delivery systems of dihydroartemisinin for cancer therapy: a review. Asian J Pharm Sci. 2022;17:475–90. doi: 10.1016/j.ajps.2022.04.005. - DOI - PMC - PubMed
    1. Dong S, Ma S, Chen H, Tang Z, Song W, Deng M. Nucleobase-crosslinked poly(2-oxazoline) nanoparticles as paclitaxel carriers with enhanced stability and ultra-high drug loading capacity for breast cancer therapy. Asian J Pharm Sci. 2022;17:571–82. doi: 10.1016/j.ajps.2022.04.006. - DOI - PMC - PubMed