

Comparative analysis of Cochrane and non-Cochrane reviews over three decades
- PMID: 38698429
- PMCID: PMC11064235
- DOI: 10.1186/s13643-024-02531-2
Comparative analysis of Cochrane and non-Cochrane reviews over three decades
Abstract
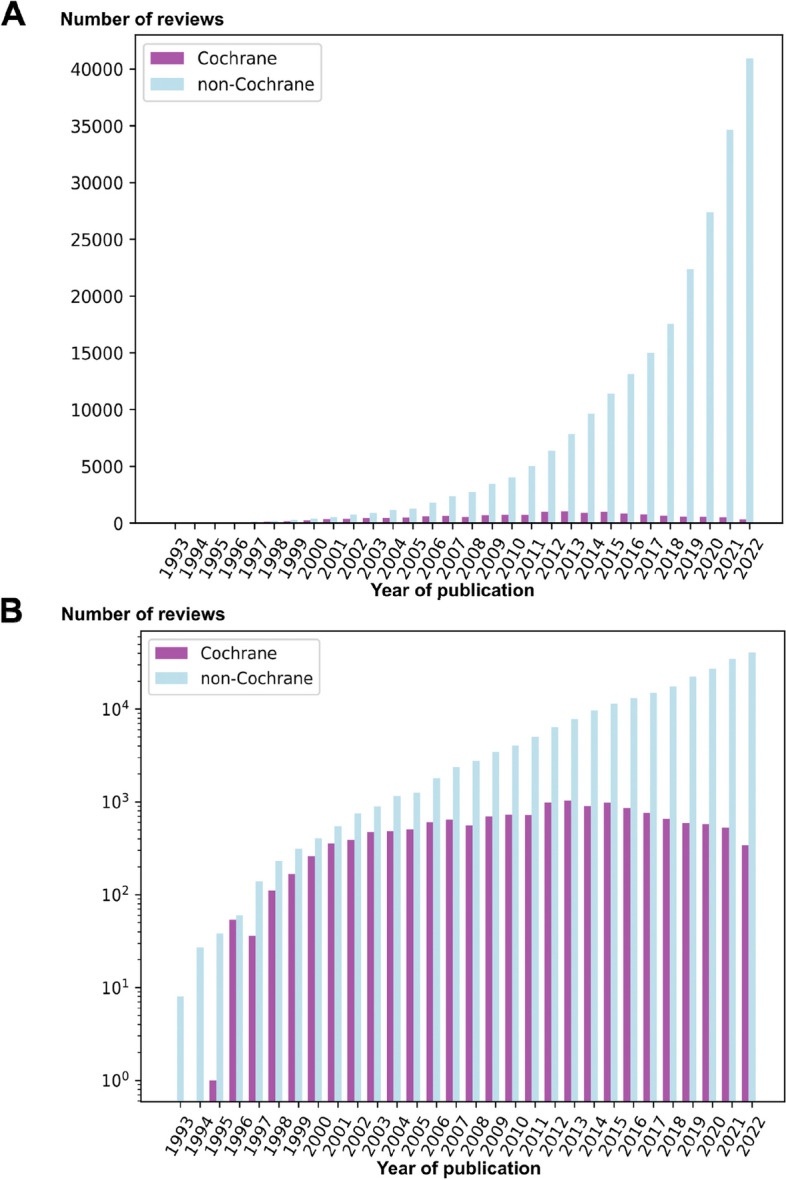
Background: Systematic reviews are viewed as the best study design to guide clinical decision-making as they are the least biased publications assuming they are well-conducted and include well-designed studies. Cochrane was initiated in 1993 with an aim of conducting high-quality systematic reviews. We aimed to examine the publication rates of non-Cochrane systematic reviews (henceforth referred to simply as "systematic reviews") and Cochrane reviews produced throughout Cochrane's existence and characterize changes throughout the period.
Methods: This observational study collected data on systematic reviews published between 1993 and 2022 in PubMed. Identified Cochrane reviews were linked to data from the Cochrane Database of Systematic Reviews via their Digital Object Identifier. Systematic reviews and Cochrane reviews were analyzed separately. Two authors screened a random sample of records to validate the overall sample, providing a precision of 98%.
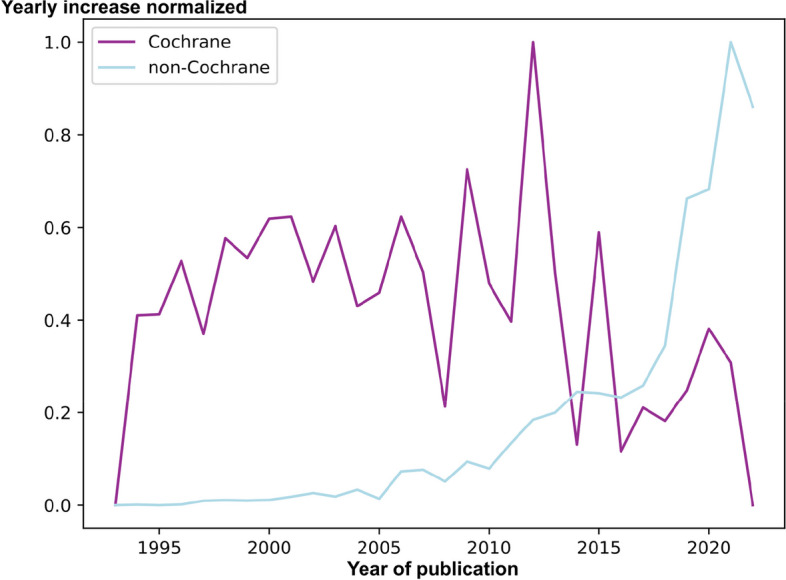
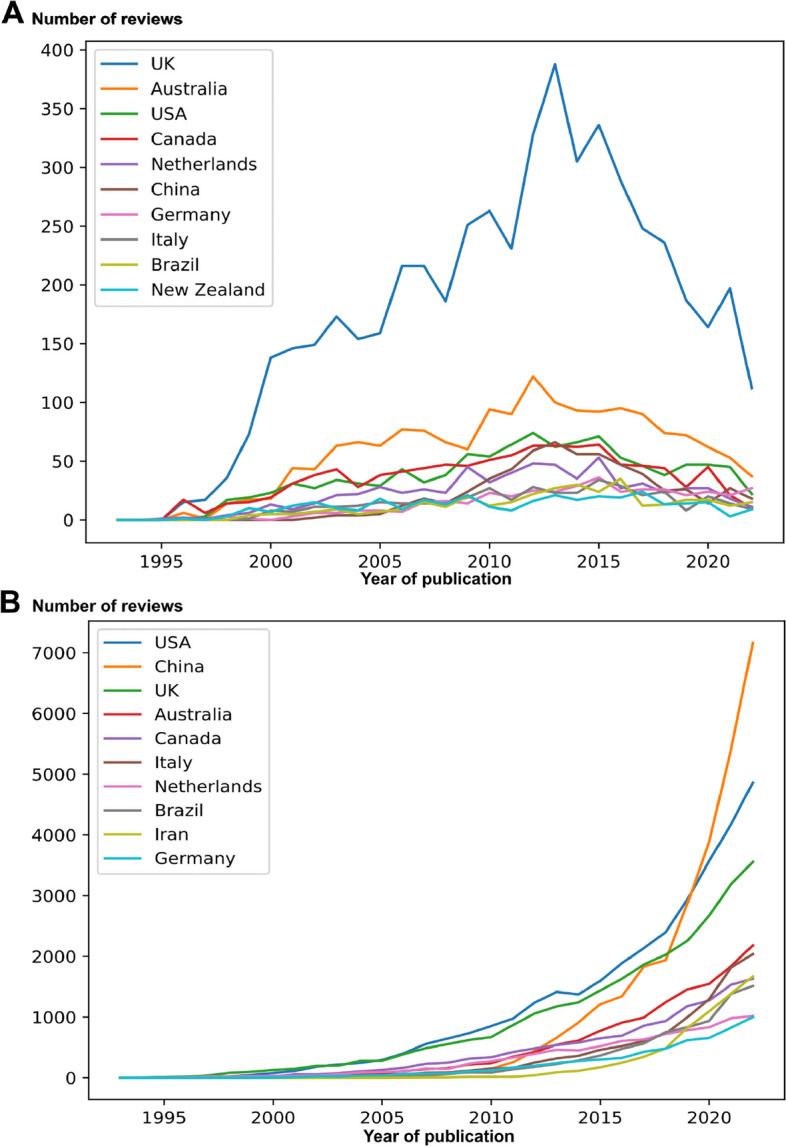
Results: We identified 231,602 (94%) systematic reviews and 15,038 (6%) Cochrane reviews. Publication of systematic reviews has continuously increased with a median yearly increase rate of 26%, while publication of Cochrane reviews has decreased since 2015. From 1993 to 2002, Cochrane reviews constituted 35% of all systematic reviews in PubMed compared with 3.5% in 2013-2022. Systematic reviews consistently had fewer authors than Cochrane reviews, but the number of authors increased over time for both. Chinese first authors conducted 15% and 4% of systematic reviews published from 2013-2022 and 2003-2012, respectively. Most Cochrane reviews had first authors from the UK (36%). The native English-speaking countries the USA, the UK, Canada, and Australia produced a large share of systematic reviews (42%) and Cochrane reviews (62%). The largest publishers of systematic reviews in the last 10 years were gold open access journals.
Conclusions: Publication of systematic reviews is increasing rapidly, while fewer Cochrane reviews have been published through the last decade. Native English-speaking countries produced a large proportion of both types of systematic reviews. Gold open access journals and Chinese first authors dominated the publication of systematic reviews for the past 10 years. More research is warranted examining why fewer Cochrane reviews are being published. Additionally, examining these systematic reviews for research waste metrics may provide a clearer picture of their utility.
Keywords: Bibliometrics; Cochrane; Evidence-based medicine; Information science; Systematic review.
© 2024. The Author(s).
Conflict of interest statement
Mikkel Zola Andersen reports a relationship with Cochrane Colorectal that includes: employment. Jacob Rosenberg reports a relationship with Cochrane Colorectal that includes: employment. Siv Fonnes reports a relationship with Cochrane Colorectal that includes: employment.
Figures
Similar articles
-
The future of Cochrane Neonatal.Early Hum Dev. 2020 Nov;150:105191. doi: 10.1016/j.earlhumdev.2020.105191. Epub 2020 Sep 12. Early Hum Dev. 2020. PMID: 33036834
-
Publication of reviews synthesizing child health evidence (PORSCHE): a survey of authors to identify factors associated with publication in Cochrane and non-Cochrane sources.Syst Rev. 2016 Jun 21;5(1):104. doi: 10.1186/s13643-016-0276-7. Syst Rev. 2016. PMID: 27328935 Free PMC article.
-
Cochrane systematic reviews and co-publication: dissemination of evidence on interventions for ophthalmic conditions.Syst Rev. 2015 Sep 22;4:118. doi: 10.1186/s13643-015-0104-5. Syst Rev. 2015. PMID: 26395078 Free PMC article.
-
Retrospective bibliometric review of rural health research: Australia's contribution and other trends.Rural Remote Health. 2007 Oct-Dec;7(4):767. Epub 2007 Nov 14. Rural Remote Health. 2007. PMID: 18041865 Review.
-
Full publication of results initially presented in abstracts.Cochrane Database Syst Rev. 2018 Nov 20;11(11):MR000005. doi: 10.1002/14651858.MR000005.pub4. Cochrane Database Syst Rev. 2018. PMID: 30480762 Free PMC article.
Cited by
-
Cochrane reviews of acupuncture are dated, do not account for the specific effects of sham controls and likely underestimate the efficacy of acupuncture therapy.Integr Med Res. 2025 Sep;14(3):101195. doi: 10.1016/j.imr.2025.101195. Epub 2025 Jun 21. Integr Med Res. 2025. PMID: 40689021 Free PMC article. Review.
-
Will AI speed up literature reviews or derail them entirely?Nature. 2025 Jul;643(8071):329-331. doi: 10.1038/d41586-025-02069-w. Nature. 2025. PMID: 40629125 No abstract available.
-
Publicly available continuously updated topic specific databases of randomised clinical trials: A scoping review.medRxiv [Preprint]. 2024 Nov 18:2024.11.18.24317477. doi: 10.1101/2024.11.18.24317477. medRxiv. 2024. PMID: 39606403 Free PMC article. Preprint.
-
An overview of reviews of breastfeeding barriers and facilitators: Analyzing global research trends and hotspots.Glob Epidemiol. 2025 Mar 6;9:100192. doi: 10.1016/j.gloepi.2025.100192. eCollection 2025 Jun. Glob Epidemiol. 2025. PMID: 40129756 Free PMC article. Review.
References
-
- Bornmann L, Haunschild R, Mutz R. Growth rates of modern science: a latent piecewise growth curve approach to model publication numbers from established and new literature databases. Humanit Soc Sci Commun. 2021;8:224. doi: 10.1057/s41599-021-00903-w. - DOI
Publication types
MeSH terms
LinkOut - more resources
Full Text Sources
Miscellaneous
