

Performance of health care service area definitions for capturing variation in inpatient care and social determinants of health
- PMID: 38698467
- PMCID: PMC11249811
- DOI: 10.1111/1475-6773.14312
Performance of health care service area definitions for capturing variation in inpatient care and social determinants of health
Abstract
Objective: To quantify the degree to which health care service area (HCSA) definitions captured hospitalizations and heterogeneity in social determinants of health (SDOH).
Data sources and study setting: Geospatial data from the Centers for Medicare and Medicaid Services, the Census Bureau, and the Dartmouth Institute. Drive-time isochrones from MapBox. Area Deprivation Index (ADI) data. 2017 inpatient discharge data from Arizona, Florida, Iowa, Maryland, Nebraska, New Jersey, New York, and Wisconsin, State Emergency Department Databases and State Inpatient Databases, Healthcare Cost and Utilization Project, Agency for Healthcare Research and Quality; and Fee-For-Service Medicare data in 48 states.
Study design: Cross-sectional, descriptive analysis.
Data collection/extraction methods: The capture rate was the percentage of inpatient discharges occurring in the same HCSA as the hospital. We compared capture rates for each HCSA definition for different populations and by hospital type. We measured SDOH heterogeneity using the coefficient of variation of the ADI among ZIP codes within each HCSA.
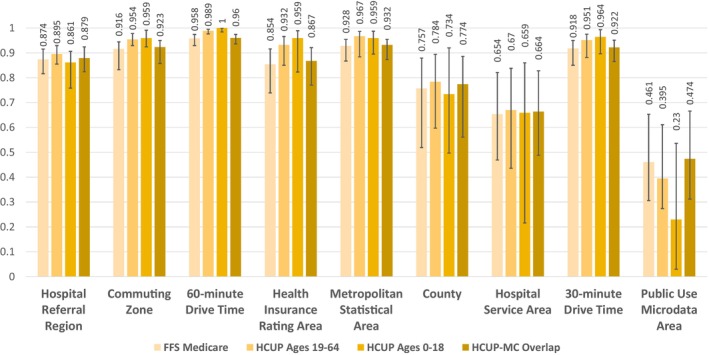
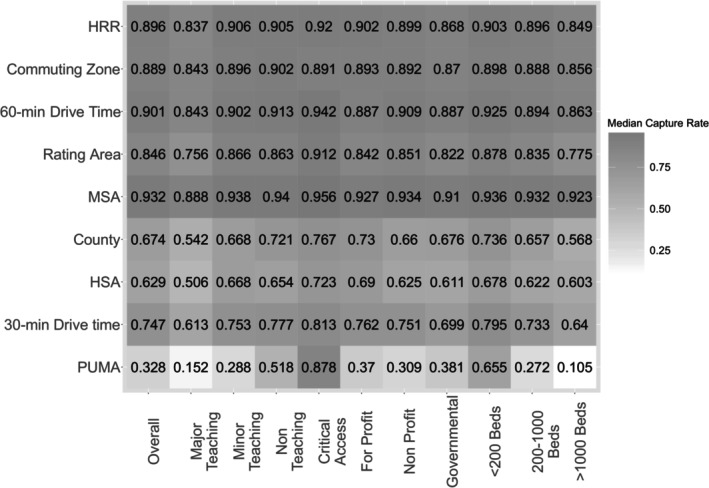
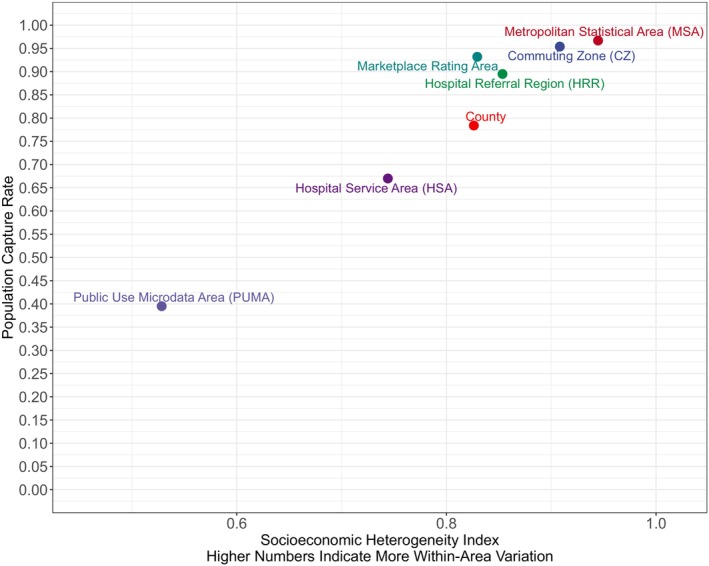
Principal findings: HCSA definitions captured a wide range of inpatient discharges, ranging from 20% to 50% for Public Use Microdata Areas (PUMAs) to 93%-97% for Metropolitan Statistical Areas (MSAs). Three-quarters of inpatient discharges were from facilities within the same county as the patient's residential ZIP code, while nearly two-thirds were within the same Hospital Service Area. From the hospital perspective, 74.7% of inpatient discharges originated from within a 30-min drive and 90.1% within a 60-min drive. Capture rates were the lowest for teaching hospitals. PUMAs and drive-time-based HCSAs encompassed more homogenous populations while MSAs, Commuting Zones, and Hospital Referral Regions captured the most variation.
Conclusions: The proportion of hospital discharges captured by each HCSA varied, with MSAs capturing the highest proportion of discharges and PUMAs capturing the lowest. Additionally, researchers face a trade-off between capture rate and population homogeneity when deciding which HCSA to use.
Keywords: access/demand/utilization of services; geographic/spatial factors/small‐area variations; hospitals; social determinants of health.
© 2024 The Authors. Health Services Research published by Wiley Periodicals LLC on behalf of Health Research and Educational Trust.
Figures
Similar articles
-
Sepsis Among Medicare Beneficiaries: 2. The Trajectories of Sepsis, 2012-2018.Crit Care Med. 2020 Mar;48(3):289-301. doi: 10.1097/CCM.0000000000004226. Crit Care Med. 2020. PMID: 32058367 Free PMC article.
-
Quantification of Neighborhood-Level Social Determinants of Health in the Continental United States.JAMA Netw Open. 2020 Jan 3;3(1):e1919928. doi: 10.1001/jamanetworkopen.2019.19928. JAMA Netw Open. 2020. PMID: 31995211 Free PMC article.
-
Assessment of Receipt of the First Home Health Care Visit After Hospital Discharge Among Older Adults.JAMA Netw Open. 2020 Sep 1;3(9):e2015470. doi: 10.1001/jamanetworkopen.2020.15470. JAMA Netw Open. 2020. PMID: 32876682 Free PMC article.
-
Social Determinants of Health and County Population Rates of Opioid-Related Inpatient Stays and Emergency Department Visits, 2016.2020 Jun 30. In: Healthcare Cost and Utilization Project (HCUP) Statistical Briefs [Internet]. Rockville (MD): Agency for Healthcare Research and Quality (US); 2006 Feb–. Statistical Brief #260. 2020 Jun 30. In: Healthcare Cost and Utilization Project (HCUP) Statistical Briefs [Internet]. Rockville (MD): Agency for Healthcare Research and Quality (US); 2006 Feb–. Statistical Brief #260. PMID: 32780580 Free Books & Documents. Review.
-
Geographic Variation in Inpatient Stays for Five Leading Mental Disorders, 2016–2018.2022 Feb 15. In: Healthcare Cost and Utilization Project (HCUP) Statistical Briefs [Internet]. Rockville (MD): Agency for Healthcare Research and Quality (US); 2006 Feb–. Statistical Brief #288. 2022 Feb 15. In: Healthcare Cost and Utilization Project (HCUP) Statistical Briefs [Internet]. Rockville (MD): Agency for Healthcare Research and Quality (US); 2006 Feb–. Statistical Brief #288. PMID: 35353470 Free Books & Documents. Review.
Cited by
-
Variation, Overlap, and Stability in Defining Safety Net Hospitals.JAMA Netw Open. 2025 Jul 1;8(7):e2523923. doi: 10.1001/jamanetworkopen.2025.23923. JAMA Netw Open. 2025. PMID: 40736736 Free PMC article.
References
-
- Market Rating Reforms|CMS. 2022. https://www.cms.gov/CCIIO/Programs-and-Initiatives/Health-Insurance-Mark...
-
- Pollitz K. Network Adequacy Standards and Enforcement. KFF; 2022. https://www.kff.org/health‐reform/issue‐brief/network‐adequacy‐standards.../
-
- Health Professional Shortage Area Physician Bonus Program. 2022. https://www.cms.gov/Outreach-and-Education/Medicare-Learning-Network-MLN...
-
- What Is Shortage Designation? 2023. https://bhw.hrsa.gov/workforce-shortage-areas/shortage-designation
-
- Medicare Managed Care Manual: Chapter 4 – Benefits and Beneficiary Protections. 2016. https://www.cms.gov/Regulations-and-Guidance/Guidance/Manuals/Downloads/...
Publication types
MeSH terms
Grants and funding
LinkOut - more resources
Full Text Sources
