

Bioluminescence Imaging of Potassium Ion Using a Sensory Luciferin and an Engineered Luciferase
- PMID: 38698549
- PMCID: PMC11100015
- DOI: 10.1021/jacs.4c02473
Bioluminescence Imaging of Potassium Ion Using a Sensory Luciferin and an Engineered Luciferase
Abstract
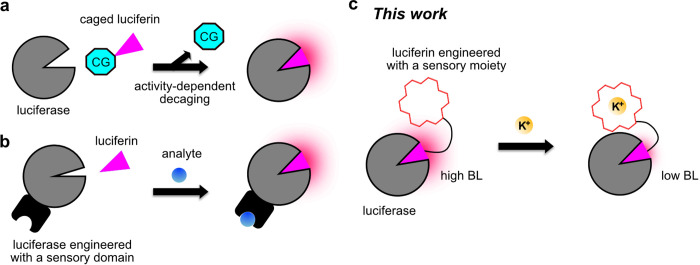
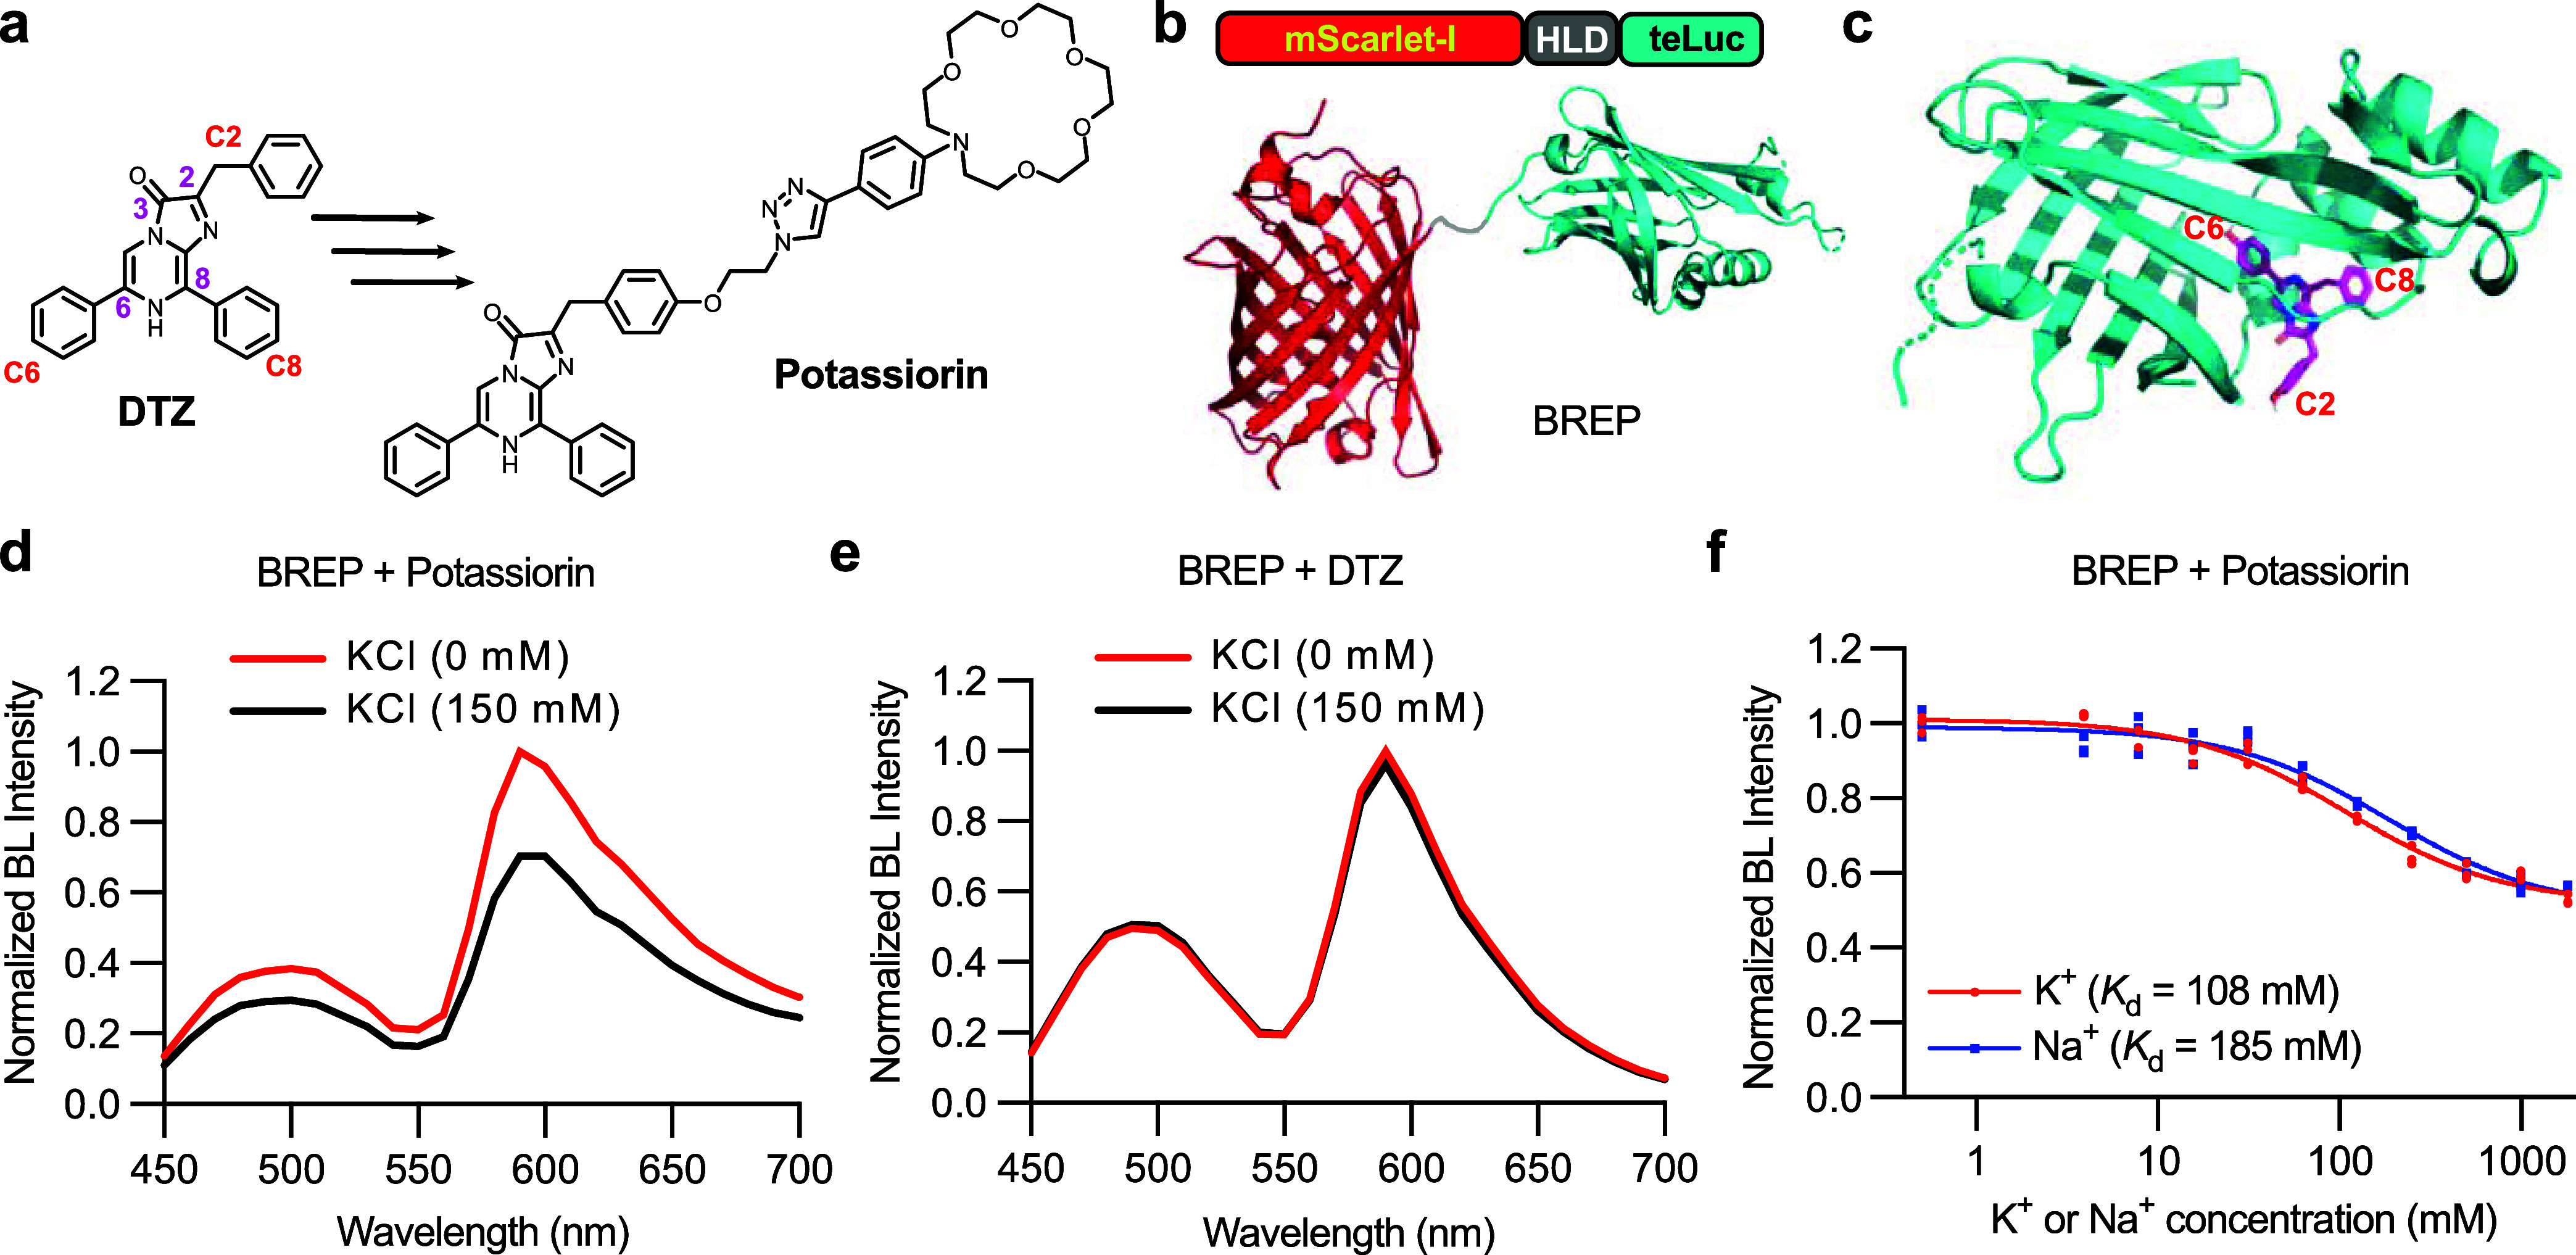
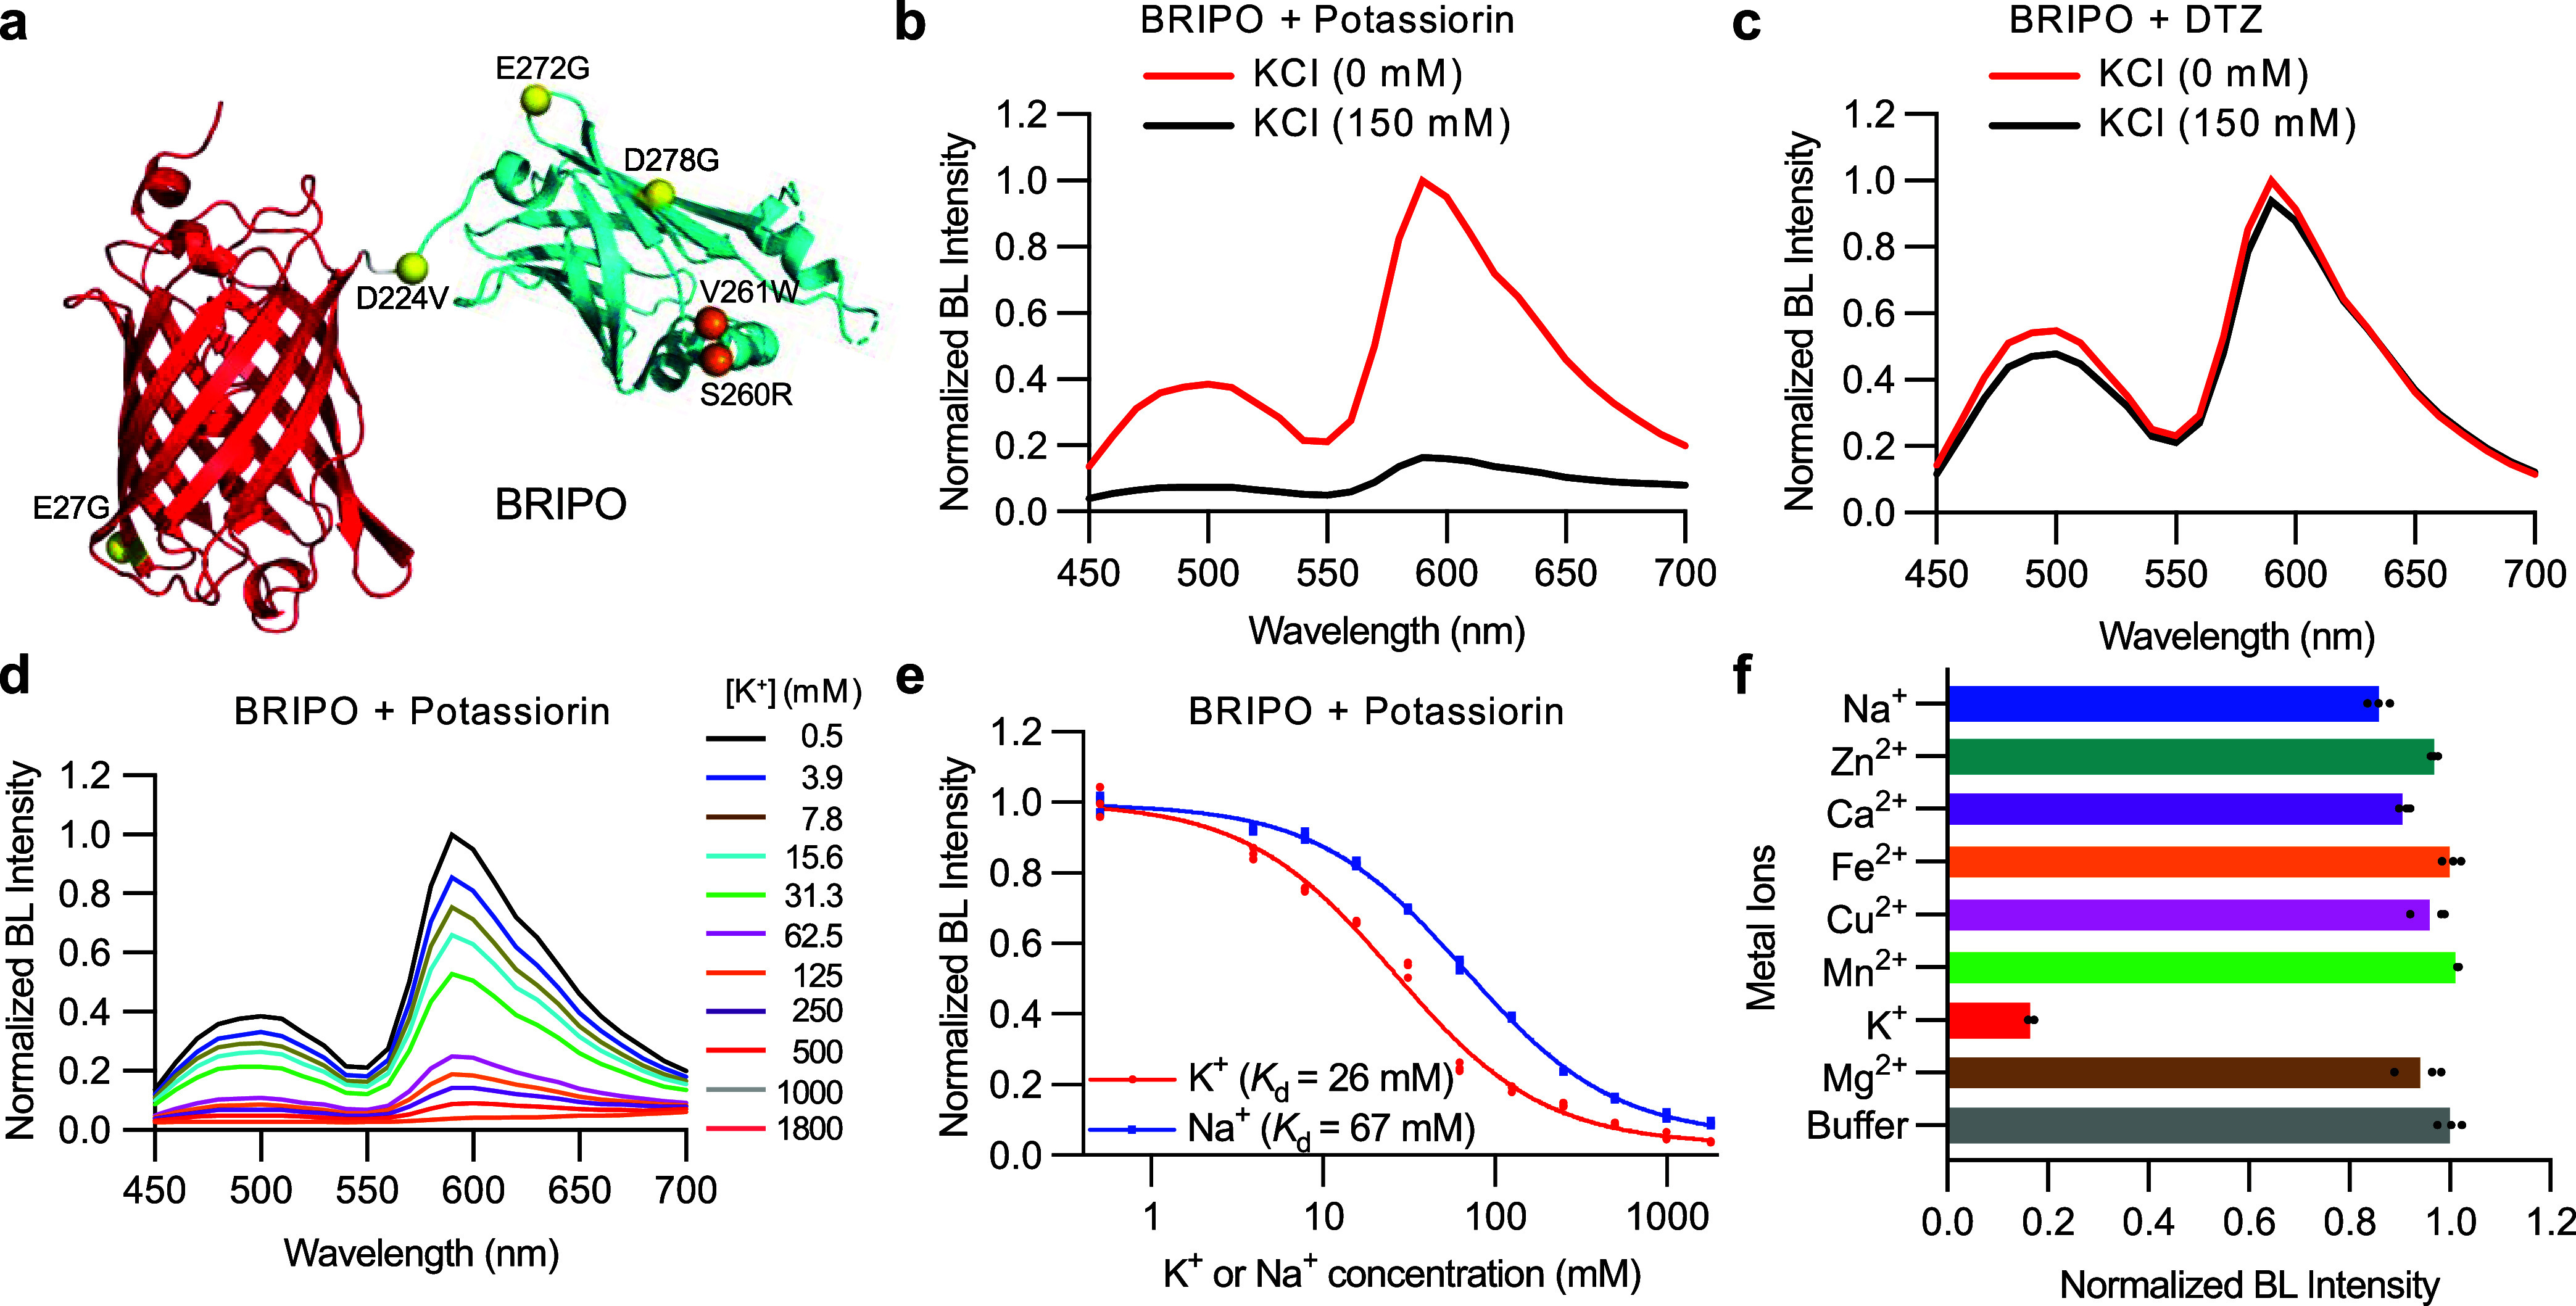
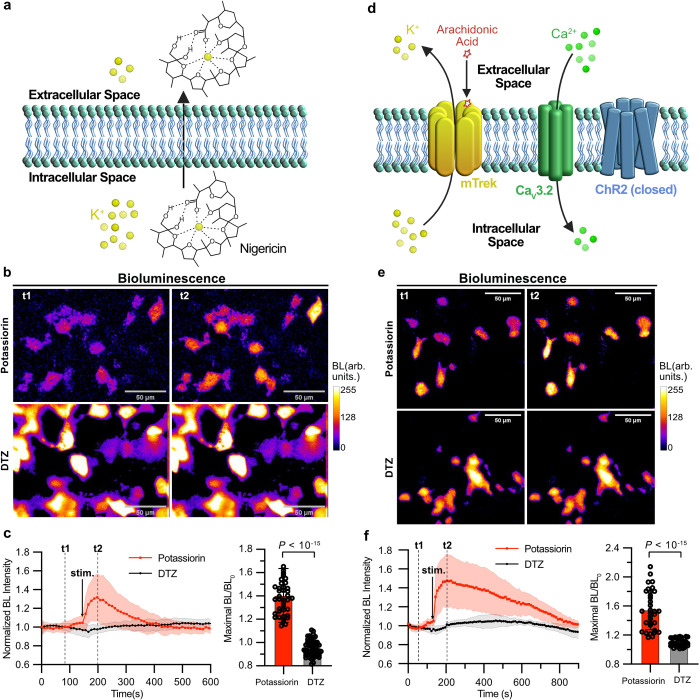
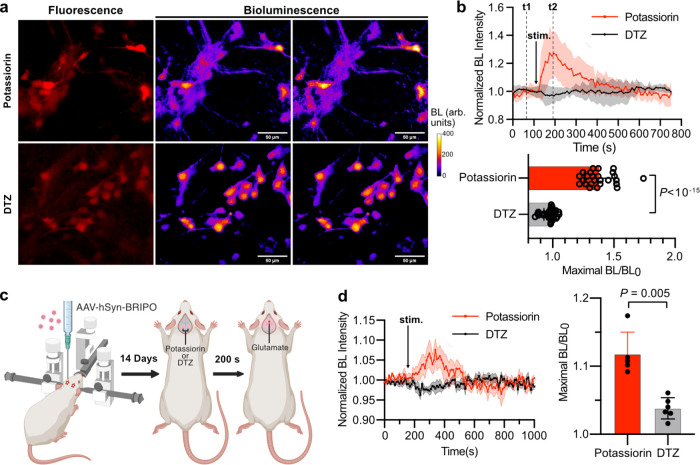
Bioluminescent indicators are power tools for studying dynamic biological processes. In this study, we present the generation of novel bioluminescent indicators by modifying the luciferin molecule with an analyte-binding moiety. Specifically, we have successfully developed the first bioluminescent indicator for potassium ions (K+), which are critical electrolytes in biological systems. Our approach involved the design and synthesis of a K+-binding luciferin named potassiorin. Additionally, we engineered a luciferase enzyme called BRIPO (bioluminescent red indicator for potassium) to work synergistically with potassiorin, resulting in optimized K+-dependent bioluminescence responses. Through extensive validation in cell lines, primary neurons, and live mice, we demonstrated the efficacy of this new tool for detecting K+. Our research demonstrates an innovative concept of incorporating sensory moieties into luciferins to modulate luciferase activity. This approach has great potential for developing a wide range of bioluminescent indicators, advancing bioluminescence imaging (BLI), and enabling the study of various analytes in biological systems.
Conflict of interest statement
The authors declare the following competing financial interest(s): While currently there is no plan to patent BRIPO and potassiorin, HA was an inventor of a patent (US Application # 15/694238) about DTZ and teLuc awarded to the University of California. Additionally, the University of Virginia filed a patent application (US Application # 17/434351) that covers BREP, with HA and YX listed as inventors. The remaining authors declare no competing interests.
Figures
Update of
-
Bioluminescence Imaging of Potassium Ion Using a Sensory Luciferin and an Engineered Luciferase.bioRxiv [Preprint]. 2024 Mar 14:2024.03.13.581057. doi: 10.1101/2024.03.13.581057. bioRxiv. 2024. Update in: J Am Chem Soc. 2024 May 15;146(19):13406-13416. doi: 10.1021/jacs.4c02473. PMID: 38559024 Free PMC article. Updated. Preprint.
Similar articles
-
Bioluminescence Imaging of Potassium Ion Using a Sensory Luciferin and an Engineered Luciferase.bioRxiv [Preprint]. 2024 Mar 14:2024.03.13.581057. doi: 10.1101/2024.03.13.581057. bioRxiv. 2024. Update in: J Am Chem Soc. 2024 May 15;146(19):13406-13416. doi: 10.1021/jacs.4c02473. PMID: 38559024 Free PMC article. Updated. Preprint.
-
Building Biological Flashlights: Orthogonal Luciferases and Luciferins for in Vivo Imaging.Acc Chem Res. 2019 Nov 19;52(11):3039-3050. doi: 10.1021/acs.accounts.9b00391. Epub 2019 Oct 8. Acc Chem Res. 2019. PMID: 31593431 Free PMC article. Review.
-
Multicomponent Bioluminescence Imaging with Naphthylamino Luciferins.Chembiochem. 2021 Aug 17;22(16):2650-2654. doi: 10.1002/cbic.202100202. Epub 2021 Jun 30. Chembiochem. 2021. PMID: 34139065 Free PMC article.
-
Cage the firefly luciferin! - a strategy for developing bioluminescent probes.Chem Soc Rev. 2013 Jan 21;42(2):662-76. doi: 10.1039/c2cs35249d. Chem Soc Rev. 2013. PMID: 23099531 Review.
-
Multicomponent Bioluminescence Imaging with a π-Extended Luciferin.J Am Chem Soc. 2020 Aug 19;142(33):14080-14089. doi: 10.1021/jacs.0c01064. Epub 2020 Aug 4. J Am Chem Soc. 2020. PMID: 32787261 Free PMC article.
Cited by
-
An Enhanced Red Bioluminescent Indicator for Responsive Detection of Physiological Calcium Dynamics in Cells and Mice.ACS Sens. 2025 Aug 22;10(8):5826-5833. doi: 10.1021/acssensors.5c01093. Epub 2025 Jul 29. ACS Sens. 2025. PMID: 40728872 Free PMC article.
-
Coelenterazine Analogs for Bioassays and Molecular Imaging.Sensors (Basel). 2025 Mar 7;25(6):1651. doi: 10.3390/s25061651. Sensors (Basel). 2025. PMID: 40292719 Free PMC article. Review.
-
Noninvasive Mapping of Extracellular Potassium in Breast Tumors via Multi-Wavelength Photoacoustic Imaging.Sensors (Basel). 2025 Jul 31;25(15):4724. doi: 10.3390/s25154724. Sensors (Basel). 2025. PMID: 40807890 Free PMC article.
-
PEGylated ATP-Independent Luciferins for Noninvasive High-Sensitivity High-Speed Bioluminescence Imaging.ACS Chem Biol. 2025 Jan 17;20(1):128-136. doi: 10.1021/acschembio.4c00601. Epub 2024 Dec 23. ACS Chem Biol. 2025. PMID: 39714242 Free PMC article.
References
Publication types
MeSH terms
Grants and funding
LinkOut - more resources
Full Text Sources
Medical
Research Materials
