. 2024 Jul;602(14):3375-3400.
doi: 10.1113/JP286069. Epub 2024 May 3.

Oxytocin and corticotropin-releasing hormone exaggerate nucleus tractus solitarii neuronal and synaptic activity following chronic intermittent hypoxia

Affiliations

Oxytocin and corticotropin-releasing hormone exaggerate nucleus tractus solitarii neuronal and synaptic activity following chronic intermittent hypoxia

Procopio Gama de Barcellos Filho et al. J Physiol. 2024 Jul.

Abstract

Chronic intermittent hypoxia (CIH) in rodents mimics the hypoxia-induced elevation of blood pressure seen in individuals experiencing episodic breathing. The brainstem nucleus tractus solitarii (nTS) is the first site of visceral sensory afferent integration, and thus is critical for cardiorespiratory homeostasis and its adaptation during a variety of stressors. In addition, the paraventricular nucleus of the hypothalamus (PVN), in part through its nTS projections that contain oxytocin (OT) and/or corticotropin-releasing hormone (CRH), contributes to cardiorespiratory regulation. Within the nTS, these PVN-derived neuropeptides alter nTS activity and the cardiorespiratory response to hypoxia. Nevertheless, their contribution to nTS activity after CIH is not fully understood. We hypothesized that OT and CRH would increase nTS activity to a greater extent following CIH, and co-activation of OT+CRH receptors would further magnify nTS activity. Our data show that compared to their normoxic controls, 10 days' CIH exaggerated nTS discharge, excitatory synaptic currents and Ca2+ influx in response to CRH, which were further enhanced by the addition of OT. CIH increased the tonic functional contribution of CRH receptors, which occurred with elevation of mRNA and protein. Together, our data demonstrate that intermittent hypoxia exaggerates the expression and function of neuropeptides on nTS activity. KEY POINTS: Episodic breathing and chronic intermittent hypoxia (CIH) are associated with autonomic dysregulation, including elevated sympathetic nervous system activity. Altered nucleus tractus solitarii (nTS) activity contributes to this response. Neurons originating in the paraventricular nucleus (PVN), including those containing oxytocin (OT) and corticotropin-releasing hormone (CRH), project to the nTS, and modulate the cardiorespiratory system. Their role in CIH is unknown. In this study, we focused on OT and CRH individually and together on nTS activity from rats exposed to either CIH or normoxia control. We show that after CIH, CRH alone and with OT increased to a greater extent overall nTS discharge, neuronal calcium influx, synaptic transmission to second-order nTS neurons, and OT and CRH receptor expression. These results provide insights into the underlying circuits and mechanisms contributing to autonomic dysfunction during periods of episodic breathing.

Keywords: autonomic nervous system; hypoxia; neuronal activity; synaptic transmission.


Conflict of interest statement

CONFLICT OF INTEREST.

The authors declare no competing financial interests.

Figures
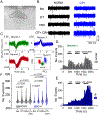
Figure 1.
Figure 1.. nTS activity is increased by OT and CRH after CIH.
(A) Representative image of the nTS slice placed on the multi-electrode array (MEA). (B) Representative traces from a normoxia and CIH nTS slice channel during baseline (Bsl) and application of OT, CRH and/or OT+CRH. (C) Isolated waveforms from NORM channel shown in B; each different neuron was detected based on its shape. (D, E) Single unit discharge rates across time in the NORM and CIH cell shown in B&C in response to OT, CRH and OT+CRH. (F) Violin plot with internal box-and-whisker plot showing 25–75% range and median of events recorded during each respective agonist for (N=2, n=968) and CIH (N=3, n=696). p values for Bsl versus respective agonist or group shown in figure. Two-way RM ANOVA, pdrug = <0.0001, pHypoxia =<0.0001, pdrug × hypoxia =<0.0001) based on cell “n”. LSD multiple comparison p-values shown in figure.
Figure 2.
Figure 2.. OT and CRH enhance cytosolic Ca2+ after CIH in dissociated nTS neurons.
(A) Example of dissociated nTS neurons under brightfield (top) and 340 nm fluorescence (bottom). Scale = 50 μm. (B) Raw traces of Fura-2 fluorescence illustrating increase in cytosolic Ca2+ to 3 min of OT, CRH, OT+CRH and high K+. Note greater responses with combined OT+CRH after CIH. (C) Increase in relative fluorescence from baseline in all neurons (NORM N=3, n=53; CIH N=4, n=49). Vehicle control/baseline =”1”. 2-way RM ANOVA, pdrug = <0.0001, pHypoxia =0.0001, pdrug × hypoxia =<0.0001. LSD multiple comparison NORM vs CIH p-values shown in figure. In panel C, compared to baseline in NORM: aBsl vs OT p=<0.0001, bBsl vs CRH p=<0.0001, cBsl vs OT+CRH p=<0.0001. Compared to baseline in CIH: eBsl vs OT p=<0.0001, fBsl vs CRH p=<0.0001, gBsl vs OT+CRH p=<0.0001). (D, E) In NORM neurons, in the presence of OTR or CRHR2 antagonists (block, “-x”), application of OT (D, N=3, n=24) or CRH (E, N=3, n=16), respectively, did not elevate intracellular Ca2+. In addition, the elevation of Ca2+ in response to of OT or CRH alone was greater than those in the presence of antagonist. 1-way ANOVA with LSD shown. Data bars shown as mean ± SD. All analysis performed on cell “n”.
Figure 3.
Figure 3.. Spontaneous (s) EPSC frequency and amplitude are not altered by OT and/or CRH following NORM or CIH.
(A) Representative recording of sEPSCs in second-order nTS neurons from normoxia (black) and CIH (blue) rats. Cells were held at −60 mV. Mean data of (B) frequency and (C) amplitude of sEPSCs. Data bars shown as mean ± SD for NORM (N=7, n=8) and CIH (N=6, n=7) exposed neurons. Also shown are individual neurons with connecting lines to denote the direction of response. Neuropeptide application did not alter frequency (2-way RM ANOVA, pdrug = 0.7807, pHypoxia = 0.5863, pdrug × hypoxia = 0.3017) nor amplitude (2-way RM ANOVA, pdrug = 0.1562, pHypoxia = 0.6909, pdrug × hypoxia = 0.2830) of sEPSCs based on cell “n”.
Figure 4.
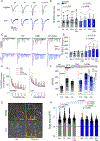
Figure 4.. CIH augments the afferent-evoked EPSC amplitude responses after CRH and OT+CRH.
(A) Example of TS-EPSCs evoked at 0.5 Hz in NORM (black) and CIH (blue)-exposed neurons. CRH alone and the co-application with OT enhance the evoked TS-EPSC amplitude after CIH. (B) Average data (mean ± SD) of TS-EPSC amplitude showing increase after CRH and its co-application with OT by CIH (NORM N=7, n= 9; CIH N=7, n=7). Also shown are individual neurons with connecting lines to denote the direction of response. 2-way RM ANOVA, pdrug = 0.0031, pHypoxia =0.9066, pdrug × hypoxia =0.8236). (C) Representative TS-EPSCs during 20 Hz stimulation in NORM and CIH-exposed rats. All events across the stimulus were summed and shown in (D). EPSCs increased with CRH & OT+CRH after CIH (2-way RM ANOVA, pdrug = 0.0269, pHypoxia =0.0998, pdrug × hypoxia =0.3440; NORM N=6, n=6; CIH N=6, n=7). Mean ± SD shown. Single cells and their connecting lines denote the direction of response are also shown. (E) Average data of TS-EPSC amplitude evoked for 10 stimuli at 20 Hz normalized to the first EPSC showing similar synaptic depression after neuropeptide agonists in NORM (2-way RM ANOVA, pdrug = 0.2109, pESPCno =0.0001, pdrug × ESPCno =0.3453) and CIH (2-way RM ANOVA, pdrug = 0.1128, pESPCno =0.0001, pdrug × ESPCno =0.1410). (F) Asynchronous events increase after CIH in presence of CRH and with application of OT+CRH. Top inset, example of spontaneous EPSCs before stimulus (Pre), synchronous 20 Hz TS-EPSCs, and asynchronous events following (peak and average) the stimuli. Within Pre-, Peak and Ave, each stacked bar represents an individual drug application. NORM, N=7, n=8, CIH, N=6, n=7. The height of each bar within each column represents the change in events during each drug. In normoxia (2-way RM ANOVA, pdrug = 0.7073, pAsync Phase =<0.0001, pdrug × Async Phase =0.5328; N=7, n=8) agonist did not alter the aEPSC. Yet, after CIH there was an increase in aEPSCs (2-way RM ANOVA, pdrug = 0.0129, pAsync Phase =0.0002, pdrug × Async Phase =0.3958; N=6, n=7). LSD multiple comparisons following a main significant effect are shown in each panel for the indicated comparisons. (G) Live-cell calcium imaging demonstrating individual GCaMP6m pre-labeled terminals in NORM and CIH slices before and during three TS stimulation at 20 Hz (example shown in yellow inset). Scale = 20 μm. (H) Average changes in fluorescence reported as ΔF/F of peak amplitude (2-way RM ANOVA, pdrug = <0.0001, pHypoxia =<0.0001, pdrug × hypoxia =0.0014; NORM N=2, n=240; CIH N=3, n=109). Analysis for all panels performed on cell “n”.
Figure 5.
Figure 5.. Neuropeptides promote spontaneous discharge after CIH.
(A) Resting membrane potential (RMP) of NORM and CIH second-order neurons were unaltered by OT, CRH, and OT+CRH (2-way RM ANOVA, pdrug = 0.2841, pHypoxia = 0.4164, pdrug × hypoxia=0.6956; NORM N=6, n=7; CIH N=6, n=7). Data bars shown as mean ± SD. Individual cells with connecting lines denote direction of response. (B) Representative membrane voltage (Vm) traces showing firing of spontaneous AP discharge (APd) via neuropeptide application after CIH. (C) Fisher’s exact test showing more spontaneous activity after CIH in the presence of OT, CRH and OT+CRH. Data across agonist are grouped together for NORM and CIH. (D) Representative traces of APd (+40 pA current injection) in a NORM and CIH-exposed second-order neuron. (E, F) Quantification of discharge triggered by each depolarizing current amplitude in NORM (E, N=6, n=7) and CIH (F, N=5, n=6). Normoxia (2-way RM ANOVA, pdrug = 0.0890, ppA = <0.0001, pdrug × pA=0.0.0091). Within OT, 50–100 pA current injection vs Bsl, p values ranged between 0.002–0.0064. Within CRH, 40–100 pA injection vs Bsl, p values were between 0.001–0.0352. OT+CRH at 100 pA vs Bsl, p= 0.0207. CIH (2-way RM ANOVA, pdrug = 0.9671, ppA = <0.0001, pdrug × pA=0.9993. All analysis performed on cell “n”.
Figure 6.
Figure 6.. OT fibers are reduced after CIH within the nTS.
(A) Representative images of PVN labeled with CRH (red), OT (green) and their merged image (scale= 200 μm/50 μm) in an intermediate PVN section. (B) The number of OT neurons was not altered after CIH. 2-way RM ANOVA, plevelPVN =< 0.0001, phypoxia = 0.4349, plevelPVN × hypoxia=0.0819; N= 5 each. (C) OT immunofluorescence density was also not altered after CIH. 2-way RM ANOVA, plevelPVN = 0.0006, phypoxia = 0.5591, plevelPVN × hypoxia=0.4045; N= 5 each. (D) The number of CRH neurons were similar between groups. 2-way RM ANOVA, plevelPVN = < 0.0001, phypoxia = 0.3469, plevelPVN × hypoxia=0.2855; N= 5 each. (E) CRH immunofluorescence density was comparable between NORM and CIH. 2-way RM ANOVA, plevelPVN = 0.0007, phypoxia = 0.0622, plevelPVN × hypoxia=0.2290; N= 5 each. (F) Example of CRH and OT fiber immunoreactivity in the NORM and CIH nTS. CIH appeared to reduce overall OT immunoreactivity. Of note, the same animals for the PVN were used for the nTS fibers expression (one PVN series was lost). Yellow arrows indicate co-localization of OT and CRH fibers. Scale = 100 μm/50 μm zoom. (G) Quantification of fiber immunoreactivity in the caudal-rostral nTS showing a decrease in OT staining after CIH. 2-way RM ANOVA, plevelnTS = 0.9671, phypoxia = 0.0476, plevelnTS × hypoxia=0.8938; N= 6). (H) CRH immunoreactivity was not altered by CIH. 2-way RM ANOVA, plevelnTS = 0.1731, phypoxia = 0.6509, plevelnTS × hypoxia=0.3404; N= 6). Main hypoxic p-value shown in figure. All analysis performed on rat “N”.
Figure 7.
Figure 7.. OTR and CRHR2 expression increase after CIH.
(A) RNAscope demonstrating otr (green) and crhr2 (red) mRNA expression within nTS rat after normoxia or CIH (scale bars = left, 100μm; right, 50μm). Quantification of RNAscope signal of otr (B) and crhr2 (C) in normoxia and CIH rats. (N=4 each, unpaired t-test). (D, E) Representative bands of OTR (MW ~ 43 kDa) and CRHR2 (MW ~ 48 kDa) protein. Immunoblot quantification of OTR (D) and CRHR2 (E) protein expression normalized to total protein (N=4 each, unpaired t-test), and normoxia expression. All analysis performed on rat “N”.
Figure 8.
Figure 8.. Minimal tonic influence by OT and CRH on EPSCs.
(A) Example of sEPSCs from NORM (black) and CIH (purple) rats during receptor block (“-x”). Currents were unaltered by neuropeptide. Mean sEPSC (B) frequency (2-way RM ANOVA, pdrug = 0.3834, pHypoxia =0.8477, pdrug × hypoxia =0.4318) and (C) amplitude (2-way RM ANOVA, pdrug = 0.0546, pHypoxia =0.7542, pdrug × hypoxia =0.6680; NORM N=8, n=8; CIH N=8, n=8). When examined only within CIH, OT and CRH receptor block reduced sEPSC amplitude. Shown are the LSD multiple comparison p-values. (D) Example TS-EPSCs (0.5 Hz) in response to neuropeptide receptor block. Note currents are not altered. (E) Average data of TS-EPSC amplitude in presence of OTR + CRHR2 block showing no difference in presence of the antagonist (2-way RM ANOVA, pdrug =0.8225, pHypoxia =0.4896, pdrug × hypoxia =0.9688). (F) Representative TS-EPSCs during 20 Hz stimulation in normoxia and CIH. All events were summed and shown in (G) to illustrate not change (2-way RM ANOVA, pdrug =0.4695, pHypoxia =0.8232, pdrug × hypoxia =0.6665; NORM N= 8n=8; CIH N=7, n=7). Data bars show mean ± SD. Also shown are individual neurons with connecting lines to denote the direction of response. All analysis performed on cell “n”.

Similar articles

Cited by

  • Cardiac vagal motor neurons.
    Wang YB, Saunders SE, Campbell JN, Boychuk CR. Wang YB, et al. Curr Opin Neurobiol. 2025 Aug;93:103068. doi: 10.1016/j.conb.2025.103068. Epub 2025 Jun 25. Curr Opin Neurobiol. 2025. PMID: 40570503 Review.

References

    1. Accorsi-Mendonca D, da Silva MP, Souza GM, Lima-Silveira L, Karlen-Amarante M, Amorim MR, Almado CE, Moraes DJ & Machado BH. (2016). Pacemaking Property of RVLM Presympathetic Neurons. Front Physiol 7, 424. - PMC - PubMed
    1. Affleck VS, Coote JH & Pyner S. (2012). The projection and synaptic organisation of NTS afferent connections with presympathetic neurons, GABA and nNOS neurons in the paraventricular nucleus of the hypothalamus. Neuroscience 219, 48–61. - PMC - PubMed
    1. Almado CE, Machado BH & Leao RM. (2012). Chronic intermittent hypoxia depresses afferent neurotransmission in NTS neurons by a reduction in the number of active synapses. J Neurosci 32, 16736–16746. - PMC - PubMed
    1. Barberis C, Audigier S, Durroux T, Elands J, Schmidt A & Jard S. (1992). Pharmacology of oxytocin and vasopressin receptors in the central and peripheral nervous system. Ann N Y Acad Sci 652, 39–45. - PubMed
    1. Basting T, Xu J, Mukerjee S, Epling J, Fuchs R, Sriramula S & Lazartigues E. (2018). Glutamatergic neurons of the paraventricular nucleus are critical contributors to the development of neurogenic hypertension. J Physiol 596, 6235–6248. - PMC - PubMed

MeSH terms

Substances