. 2024 Jul;6(7):429-439.
doi: 10.1002/acr2.11671. Epub 2024 May 3.

A PD-1highCD4+ T Cell Population With a Cytotoxic Phenotype is Associated With Interstitial Lung Disease in Systemic Sclerosis

Affiliations

A PD-1highCD4+ T Cell Population With a Cytotoxic Phenotype is Associated With Interstitial Lung Disease in Systemic Sclerosis

Mehreen Elahee et al. ACR Open Rheumatol. 2024 Jul.

Abstract

Objective: T cells contribute to tissue injury in systemic sclerosis (SSc), yet the specific T cell subsets expanded in patients with SSc remain incompletely defined. Here we evaluated specific phenotypes and functions of peripheral helper T (Tph) and follicular helper T (Tfh) cells, which have been implicated in autoantibody production, and assessed their associations with clinical features in a well-characterized cohort of patients with SSc.

Methods: Mass cytometry of T cells from peripheral blood mononuclear cells of patients with SSc and controls were evaluated using t-distributed stochastic neighbor embedding visualization, biaxial gating, and marker expression levels. Findings were validated with flow cytometry and in vitro assays.

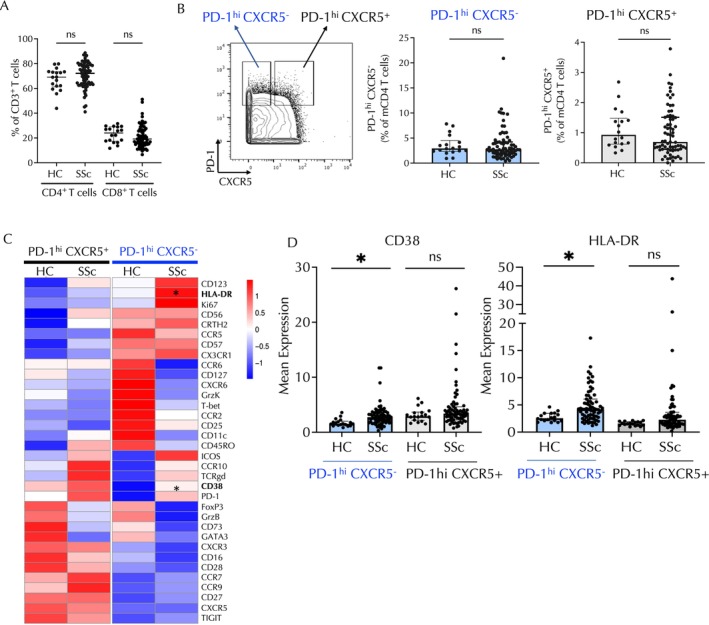
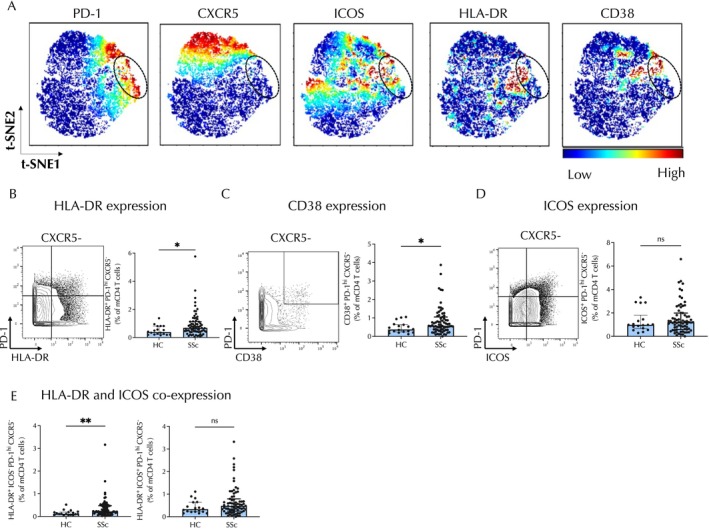
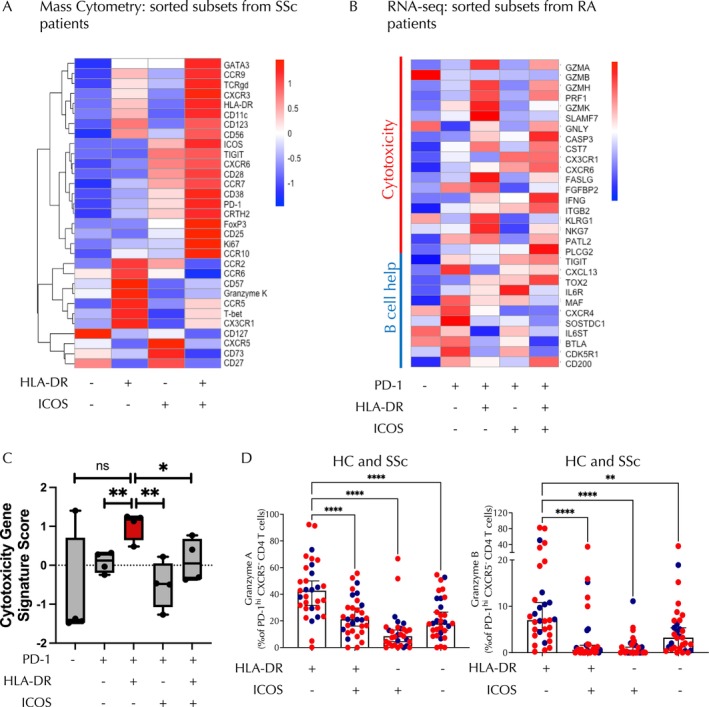
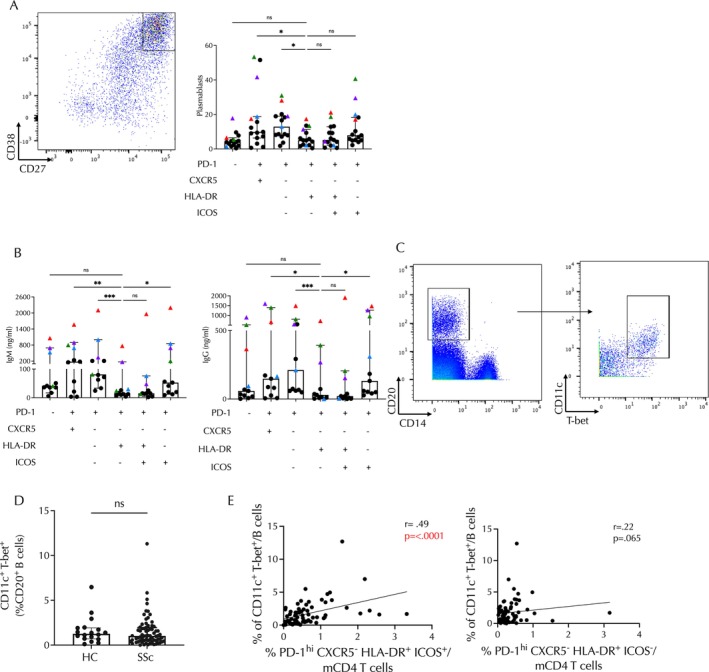
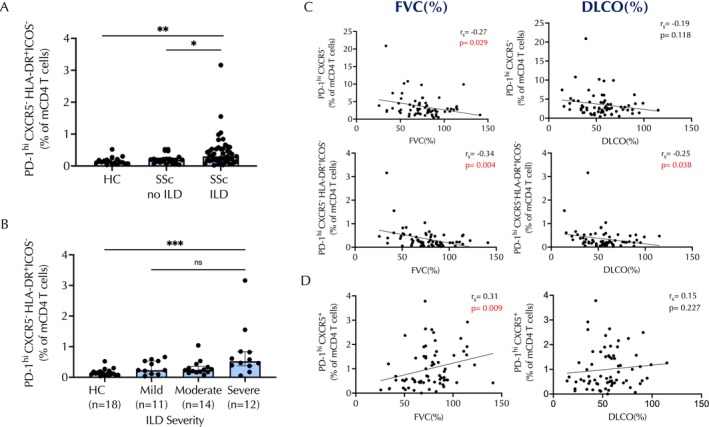
Results: The frequencies of PD-1highCXCR5+ Tfh cells and PD-1highCXCR5- Tph cells were similar in patients with SSc and controls. t-distributed stochastic neighbor embedding visualization (tSNE) revealed distinct populations within the PD-1highCXCR5- cells distinguished by expression of HLA-DR and inducible costimulator (ICOS). Among PD-1highCXCR5- cells, only the HLA-DR+ICOS- cell population was expanded in patients with SSc. Cytometric and RNA sequencing analyses indicated that these cells expressed cytotoxic rather than B cell helper features. HLA-DR+ICOS- PD-1highCXCR5- cells were less potent in inducing B cell plasmablast differentiation and antibody production than comparator T helper cell populations. HLA-DR+ICOS-PD-1highCXCR5- cells were significantly associated with the presence and severity of interstitial lung disease among patients with SSc.

Conclusion: Among PD-1highCXCR5- T cells, a subset of HLA-DR+ICOS- cells with cytotoxic features is specifically expanded in patients with SSc and is significantly associated with interstitial lung disease severity. This potential cytotoxicity appearing in the CD4 T cell population can be evaluated as a prognostic disease biomarker in patients with SSc.


Figures

Figure 1
Figure 1
In patients with SSc, the PD‐1highCXCR5CD4 T cell subset shows enrichment for CD38 and HLA–DR expression. (A) Quantification of CD4+ and CD8+ T cells in patients with SSc compared with HCs using mass cytometry data. (B) Example of gating of PD‐1highCXCR5 and PD‐1highCXCR5+ CD4 T cell subsets. Frequency of PD‐1highCXCR5 and PD‐1highCXCR5+ CD4 T cells in patients with SSc and HCs. (C) Heatmap of row‐normalized expression of the selected markers from the mass cytometry panel. Expression of the markers is shown in PD‐1highCXCR5CD4 and PD‐1highCXCR5+CD4 T cells in patients with SSc compared with HCs. HLA–DR and CD38 are significantly differentially expressed in PD‐1highCXCR5 cells in patients with SSc compared to HCs. (D) Quantification of expression of CD38 and HLA–DR in PD‐1highCXCR5 and PD‐1highCXCR5+ CD4 T cells. Comparisons were made using the Mann‐Whitney U‐test. Bonferroni correction was applied in panel C. *P < 0.05; **P < 0.01; ***P < 0.001. HC, healthy control; ns, nonsignificant; SSc, systemic sclerosis.
Figure 2
Figure 2
PD‐1highCXCR5HLA–DR+CD4 T cells are expanded in the circulation of patients with SSc. (A) tSNE plots of memory CD4+ T cells in patients with SSc indicating expression of PD‐1, CXCR5, ICOS, HLA–DR, and CD38. The circle denotes the subpopulation of PD‐1highCXCR5CD4 T cells. Color indicates level of marker expression. (B–D) Representative biaxial gating and expression of (B) HLA–DR, (C) CD38, and (D) ICOS on CXCR5PD‐1high cells. (E) Frequencies of CXCR5PD‐1high cells with positive expression of HLA–DR and negative ICOS expression (left) or with coexpression of the two markers (right). Error bars depict median ± interquartile range. Comparisons were made using Mann‐Whitney U‐tests. *P < 0.05; **P < 0.01. HC, healthy control; ns, nonsignificant; SSc, systemic sclerosis; tSNE, t‐distributed stochastic neighbor embedding.
Figure 3
Figure 3
PD‐1highCXCR5HLA–DR+ICOSCD4 T cells exhibit a cytotoxic phenotype rather than a follicular helper T–like B cell helper phenotype. (A) Row‐normalized heatmap depicting mean expression of mass cytometry markers on PD‐1highCXCR5CD4+ T cells divided into four subsets based on expression of HLA–DR and ICOS as indicated. (B) Heatmap showing mean expression of genes associated with cytotoxicity and B cell help derived from bulk RNA sequencing data of CXCR5CD4 T cell subsets from patients with RA. Subsets are defined by expression of PD‐1, HLA–DR, and ICOS as noted. (C) The cytotoxicity gene signature score is depicted for the CD4 T cell subsets derived from bulk RNA sequencing data of CXCR5CD4 T cell subsets in patients with RA as depicted in panel B. (D) Quantification of granzyme A expression on PD‐1highCXCR5CD4 T cells from HCs and patients with SSc from each subset based on expression of HLA–DR and ICOS as indicated. Quantification of granzyme B on PD‐1highCXCR5CD4 T cells from HC and patients with SSc. Blue dots represent HCs, and red dots represent patients with SSc. Subsets are defined by expression of PD‐1, HLA–DR, and ICOS as noted. Paired t‐test comparisons were made using Friedman's test and Dunn's multiple comparison test. *P < 0.05; **P < 0.01; **P < 0.01; ****P < 0.0001. HC, healthy control; ns, nonsignificant; RA, rheumatoid arthritis; SSc, systemic sclerosis.
Figure 4
Figure 4
Functional studies and B cell correlative analyses suggest that PD‐1highCXCR5HLA–DR+ICOS cells do not behave as B cell helpers. (A) Frequencies of CD38highCD27+ plasmablasts derived from B cell differentiation assays in which memory B cells were cocultured with the indicated subset of CD4 T helper cells. The representative flow plot of plasmablast gating is shown on the left, and frequencies are depicted on the right. (B) Quantification of IgM and IgG in supernatant from T cell–B cell cocultures using the Friedman test. (C) Representative flow cytometry gating for isolation of ABCs defined by CD11c+T‐bet+. (D) Frequencies of ABCs in patients with SSc compared to HCs. (E) Correlation of frequencies of ABCs with PD‐1highCXCR5CD4 T cells with HLA–DR+ICOS+ expression (n = 71; P < 0.0001, rs = 0.49) (left) or HLA–DR+ICOS expression (n = 71; P = 0.065, rs = 0.22) (right). In panels A and B, black circles represent T cell subsets derived from collars, whereas colored circles represent individual patient samples. Spearman correlation statistics are shown. *P < 0.05; ***P < 0.001. Comparisons in A and B were made using Friedman's test. **P < 0.01; ****P < 0.0001. ABC, age‐associated B cell; HC, healthy control; ns, nonsignificant; SSc, systemic sclerosis.
Figure 5
Figure 5
Increased numbers of PD‐1highCXCR5HLA–DR+ICOSCD4 T cells correspond with ILD and pulmonary function parameters in patients with SSc. (A) Frequencies of PD‐1highCXCR5HLA–DR+ICOSCD4 T cells in HCs, patients with SSc without ILD, and patients with SSc and ILD. (B) Frequencies of PD‐1highCXCR5HLA–DR+ICOS CD4 T cells in HCs and patients with SSc subdivided into mild, moderate, or severe ILD severity categories. (C) Frequencies of total PD‐1highCXCR5CD4 T cells or the PD‐1highCXCR5HLA–DR+ICOS subset correlated with FVC or DLco as indicated (PD‐1highCXCR5/FVC: n = 71, P = 0.029, rs = −0.27; PD‐1highCXCR5/DLco: n = 71, P = 0.118, rs = −0.19; PD‐1highCXCR5HLA–DR+ICOS/FVC: n = 71, P = 0.004, rs = −0.34; PD‐1highCXCR5HLA–DR+ICOS/DLco: n = 71, P = 0.038, rs = −0.25). (D) Frequencies of PD‐1highCXCR5+ T cells with respect to FVC (n = 71; P = 0.009, rs = 0.31) or DLco (n = 71; P = 0.227, rs = 0.15) as indicated. *P < 0.05; **P < 0.01; ***P < 0.001. DLco, diffusing capacity for carbon monoxide; FVC, forced vital capacity; HC, healthy control; ILD, interstitial lung disease; ns, nonsignificant; SSc, systemic sclerosis.

References

    1. Perelas A, Silver RM, Arrossi AV, et al. Systemic sclerosis‐associated interstitial lung disease. Lancet Respir Med 2020;8(3):304–320. - PubMed
    1. O'Reilly S, Hügle T, van Laar JM. T cells in systemic sclerosis: a reappraisal. Rheumatology (Oxford) 2012;51(9):1540–1549. - PubMed
    1. Frieri M, Angadi C, Paolano A, et al. Altered T cell subpopulations and lymphocytes expressing natural killer cell phenotypes in patients with progressive systemic sclerosis. J Allergy Clin Immunol 1991;87(4):773–779. - PubMed
    1. Gaydosik AM, Tabib T, Domsic R, et al. Single‐cell transcriptome analysis identifies skin‐specific T‐cell responses in systemic sclerosis. Ann Rheum Dis 2021;80(11):1453–1460. - PMC - PubMed
    1. Kalogerou A, Gelou E, Mountantonakis S, et al. Early T cell activation in the skin from patients with systemic sclerosis. Ann Rheum Dis 2005;64(8):1233–1235. - PMC - PubMed