. 2024 Apr 18:15:1390615.
doi: 10.3389/fphar.2024.1390615. eCollection 2024.

The prognostic and immunological role of MCM3 in pan-cancer and validation of prognosis in a clinical lower-grade glioma cohort

Affiliations

The prognostic and immunological role of MCM3 in pan-cancer and validation of prognosis in a clinical lower-grade glioma cohort

Qian-Rong Huang et al. Front Pharmacol. .

Abstract

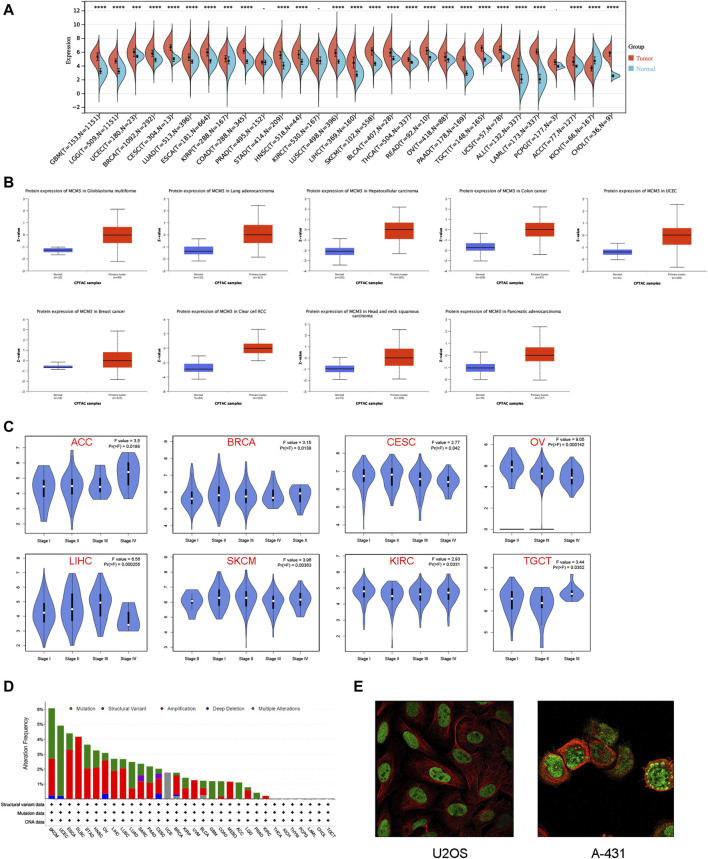
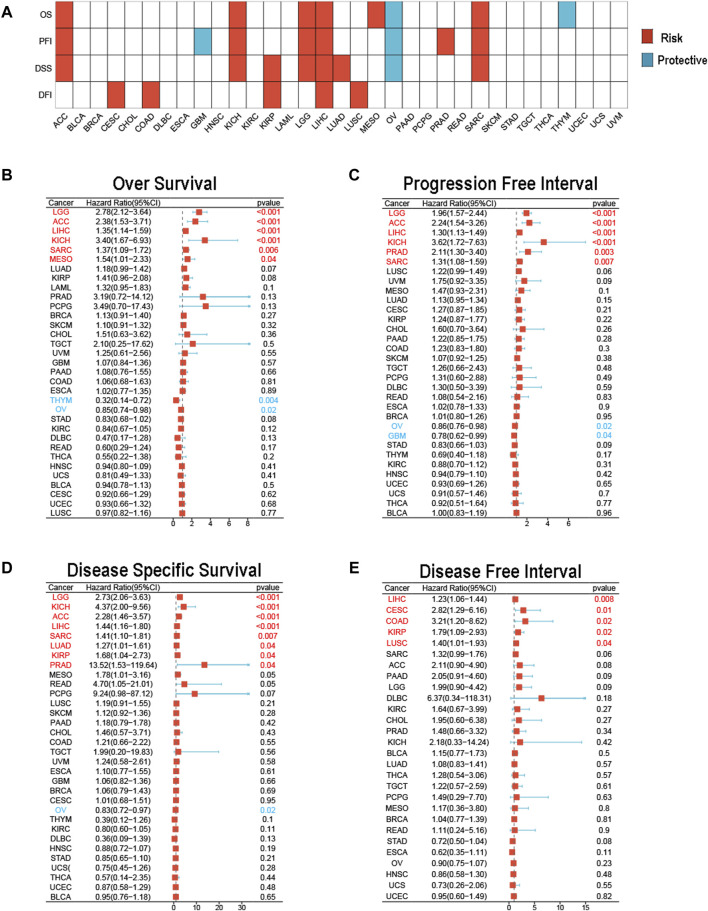
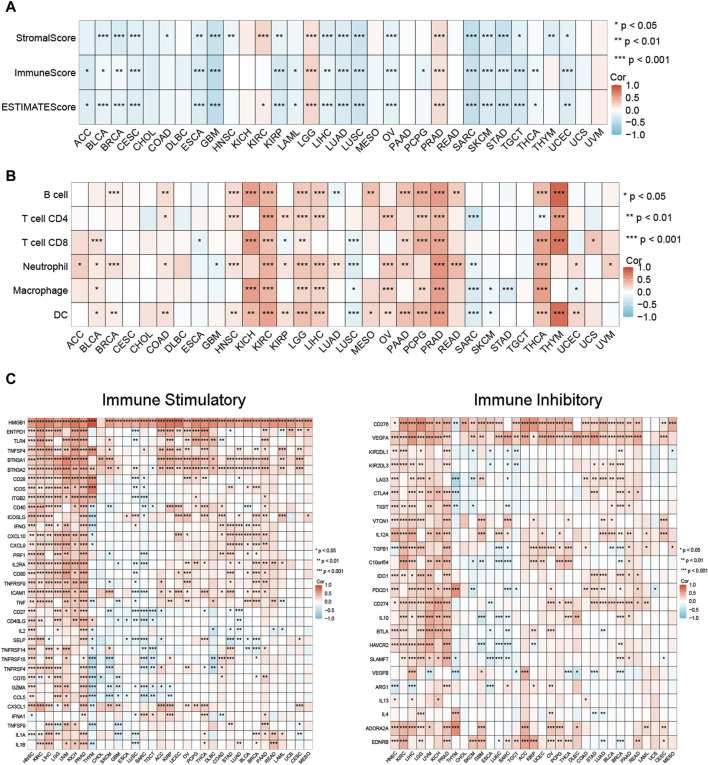
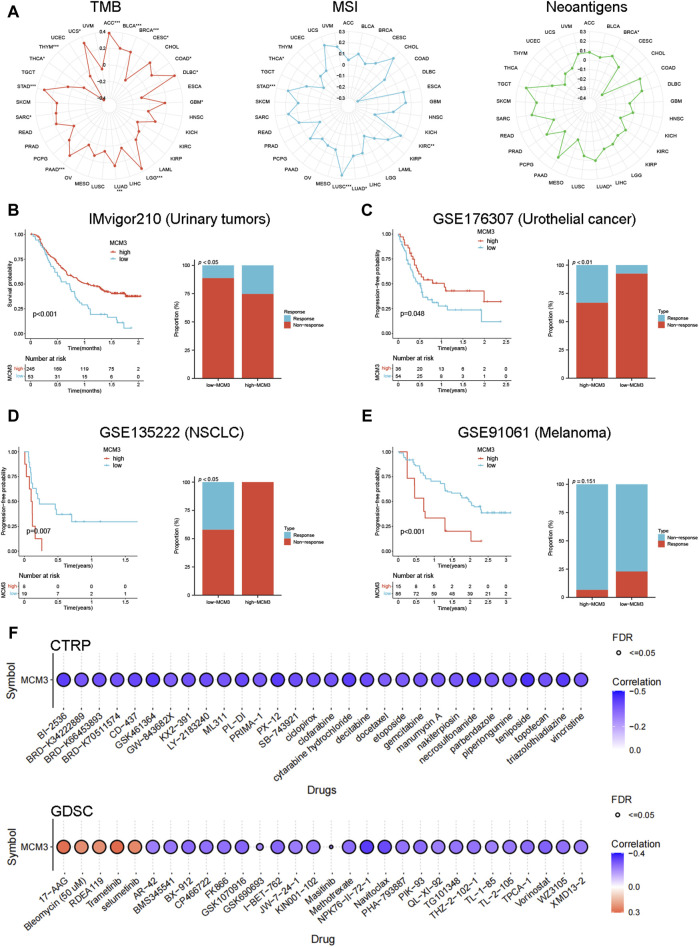
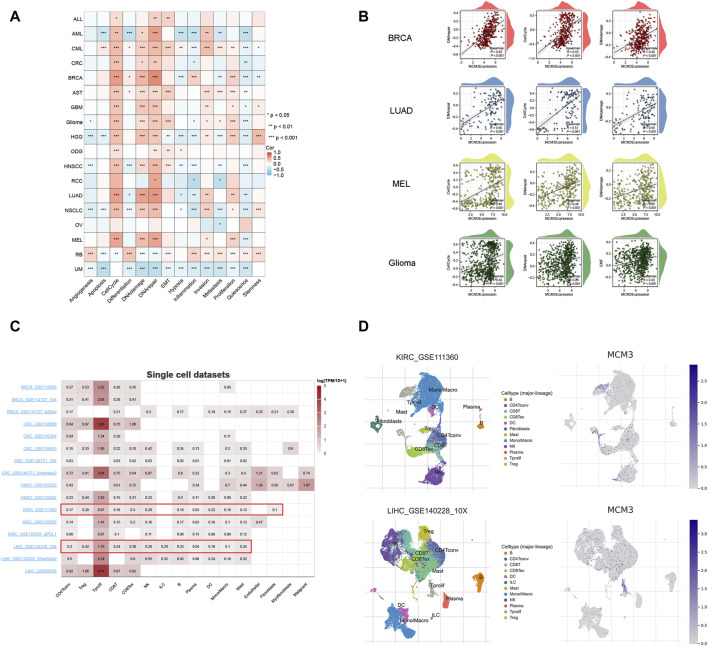
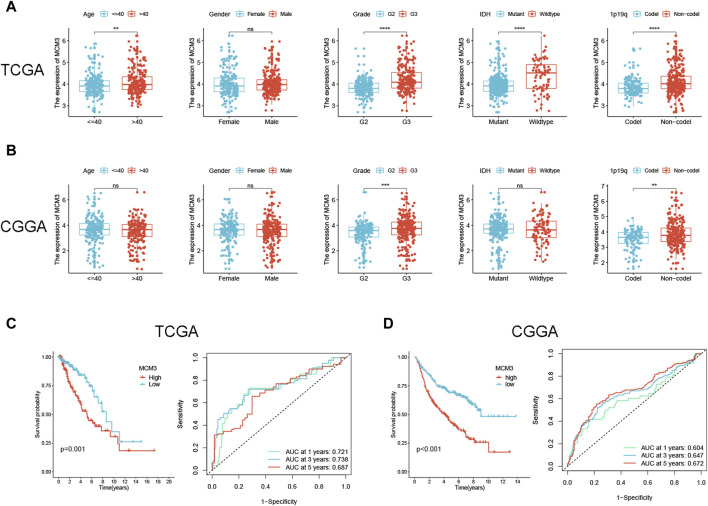
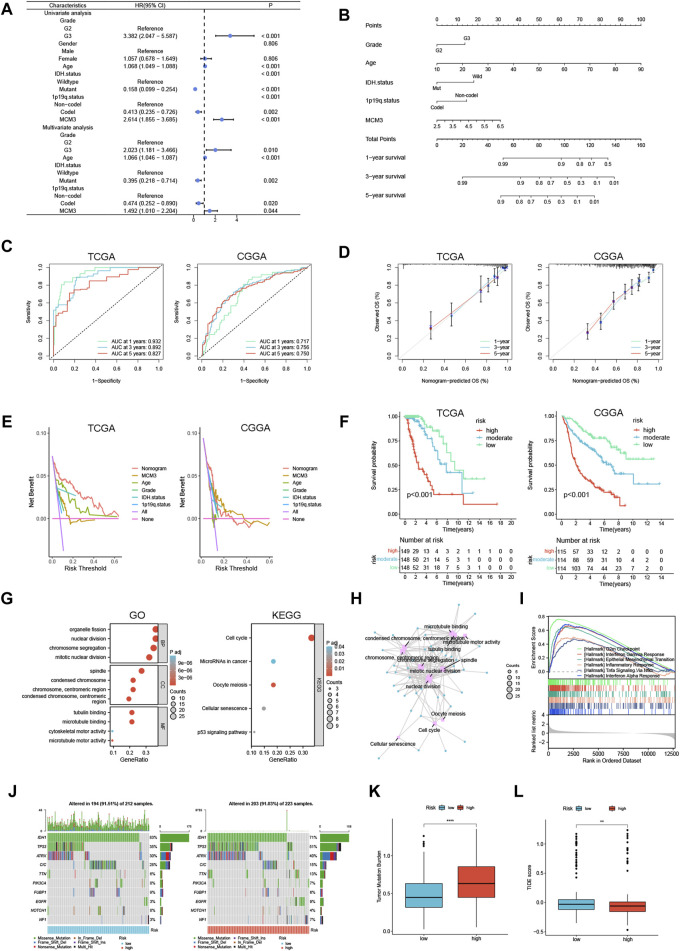
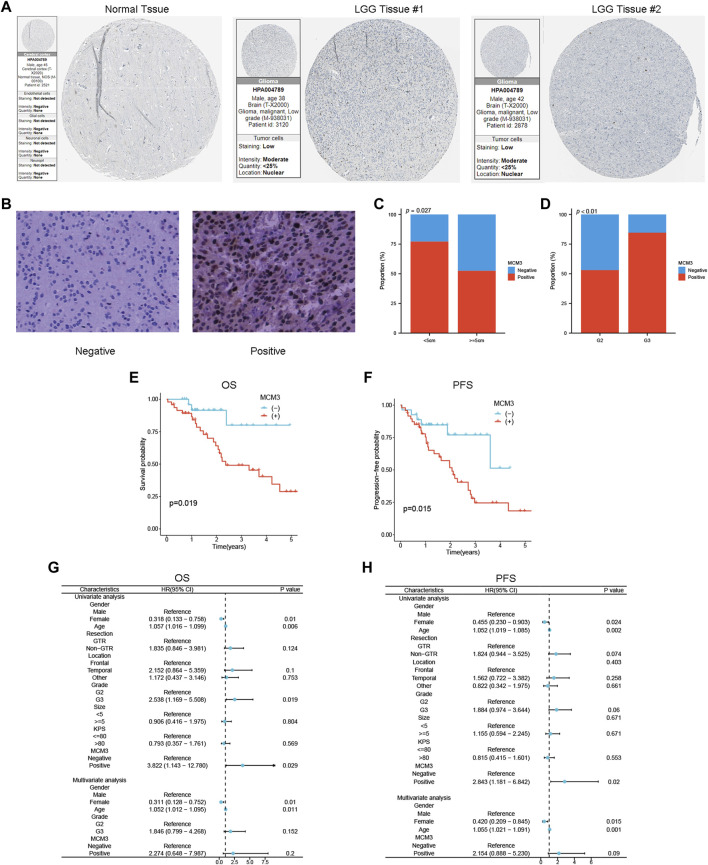
Background: Previous studies have shown that MCM3 plays a key role in initiating DNA replication. However, the mechanism of MCM3 function in most cancers is still unknown. The aim of our study was to explore the expression, prognostic role, and immunological characteristics of MCM3 across cancers. Methods: We explored the expression pattern of MCM3 across cancers. We subsequently explored the prognostic value of MCM3 expression by using univariate Cox regression analysis. Spearman correlation analysis was performed to determine the correlations between MCM3 and immune-related characteristics, mismatching repair (MMR) signatures, RNA modulator genes, cancer stemness, programmed cell death (PCD) gene expression, tumour mutation burden (TMB), microsatellite instability (MSI), and neoantigen levels. The role of MCM3 in predicting the response to immune checkpoint blockade (ICB) therapy was further evaluated in four immunotherapy cohorts. Single-cell data from CancerSEA were analysed to assess the biological functions associated with MCM3 in 14 cancers. The clinical correlation and independent prognostic significance of MCM3 were further analysed in the TCGA and CGGA lower-grade glioma (LGG) cohorts, and a prognostic nomogram was constructed. Immunohistochemistry in a clinical cohort was utilized to validate the prognostic utility of MCM3 expression in LGG. Results: MCM3 expression was upregulated in most tumours and strongly associated with patient outcomes in many cancers. Correlation analyses demonstrated that MCM3 expression was closely linked to immune cell infiltration, immune checkpoints, MMR genes, RNA modulator genes, cancer stemness, PCD genes and the TMB in most tumours. There was an obvious difference in outcomes between patients with high MCM3 expression and those with low MCM3 expression in the 4 ICB treatment cohorts. Single-cell analysis indicated that MCM3 was mainly linked to the cell cycle, DNA damage and DNA repair. The expression of MCM3 was associated with the clinical features of LGG patients and was an independent prognostic indicator. Finally, the prognostic significance of MCM3 in LGG was validated in a clinical cohort. Conclusion: Our study suggested that MCM3 can be used as a potential prognostic marker for cancers and may be associated with tumour immunity. In addition, MCM3 is a promising predictor of immunotherapy responses.

Keywords: immunotherapy; lower-grade glioma; minichromosome maintenance complex component 3 (MCM3); pan-cancer; prognosis.


Conflict of interest statement

The authors declare that the research was conducted in the absence of any commercial or financial relationships that could be construed as a potential conflict of interest.

Figures

FIGURE 1
FIGURE 1
Expression patterns of MCM3 in pan-cancer. (A) Differences in MCM3 between tumor and normal tissues based on TCGA and GETx data. (B) Comparison of protein levels based on CPTAC data. (C) Clinical correlation analysis based on GEPIA database. (D) The genomic alteration of MCM3 in pan-cancer. (E) Immunofluorescence results showed the localization of MCM3 in cell lines. ****p < 0.0001.
FIGURE 2
FIGURE 2
Prognostic value of MCM3 in pan-cancer. (A) The heatmap shows results of univariate Cox regression analysis. (B) Forest plot of MCM3 expression and OS across cancers. (C) Forest plot of MCM3 expression and PFI across cancers. (D) Forest plot of MCM3 expression and DSS across cancers. (E) Forest plot of MCM3 expression and DFI across cancers.
FIGURE 3
FIGURE 3
Relationship between MCM expression and immune-related features in pan-cancer. (A) MCM3 expression and tumor microenvironment relate parameters. (B) MCM3 expression and immune cell infiltration. (C) MCM3 expression and immune checkpoints. *p < 0.05, **p < 0.01, ***p < 0.001.
FIGURE 4
FIGURE 4
Immunotherapy and drug sensitivity analysis. (A) Relationship between MCM3 expression and TMB, MSI, and neoantigens. (B–E) Prognostic significance of MCM3 and proportion of immunotherapy response between high- and low-MCM3 groups in four cohorts receiving ICB therapy. (F) Drug sensitivity analysis of MCM3 based on CTPR and GDSC data. *p < 0.05, **p < 0.01, ***p < 0.001.
FIGURE 5
FIGURE 5
Single-cell analysis of MCM3. (A) Correlation between MCM3 and 14 biological functions. (B) The top three functions in BRCA, LUAD, MEL and glioma. (C) Datasets of single-cell expression of MCM3 from TISCH website. (D) Distribution of MCM3 among cell types in the GSE111360 and GSE140228 datasets. *p < 0.05, **p < 0.01, ***p < 0.001.
FIGURE 6
FIGURE 6
Correlation between MCM3 expression and clinical features and prognosis of LGG. (A, B) Relationship between MCM3 and clinical features in TCGA and CGGA cohorts. (C, D) Evaluation of the ability of MCM3 expression to predict prognosis in TCGA and CGGA cohorts. ns: no significance, **p < 0.01, ***p < 0.001, ****p < 0.0001.
FIGURE 7
FIGURE 7
Construction of a prognostic nomogram and analysis of MCM3 related functions in LGG. (A) Univariate/multivariate Cox analysis was performed based on TCGA cohort. (B) Establishment of a prognostic nomogram based on multivariate analysis results. (C–F) Nomogram model evaluation, including timeROC, calibration, DCA and KM curves. (G) GO and KEGG analyses based on differentially expressed genes in TCGA. (H) An interaction network between GO and KEGG. (I) The GSEA analysis in TCGA cohort. (J) The waterfall map shows the top 10 genes with the highest mutation probability. (K, L) TMB and TIDE score were compared between the two groups. **p < 0.01, ****p < 0.0001.
FIGURE 8
FIGURE 8
Validation of the association between MCM3 and clinical features and prognosis of LGG. (A) MCM3 protein expression in normal and tumor tissues from HPA database. (B) Representative plots of negative and positive immunohistochemical results. (C, D) Relationship between MCM3 expression and tumor size and grade. (E, F) Survival curves for OS and PFS in clinical cohort. (G, H) Univariate and multivariate Cox regression analysis for OS and PFS.

Similar articles

Cited by

References

    1. Abad E., Graifer D., Lyakhovich A. (2020). DNA damage response and resistance of cancer stem cells. Cancer Lett. 474, 106–117. 10.1016/j.canlet.2020.01.008 - DOI - PubMed
    1. Ahmadzadeh M., Johnson L., Heemskerk B., Wunderlich J., Dudley M., White D., et al. (2009). Tumor antigen-specific CD8 T cells infiltrating the tumor express high levels of PD-1 and are functionally impaired. Blood 114 (8), 1537–1544. 10.1182/blood-2008-12-195792 - DOI - PMC - PubMed
    1. Aporowicz M., Czopnik P., Kubicka E., Piotrowska A., Dziegiel P., Bolanowski M., et al. (2019). Minichromosome maintenance proteins MCM-3, MCM-5, MCM-7, and ki-67 as proliferative markers in adrenocortical tumors. Anticancer Res. 39 (3), 1151–1159. 10.21873/anticanres.13224 - DOI - PubMed
    1. Ben-David U., Amon A. (2020). Context is everything: aneuploidy in cancer. Nat. Rev. Genet. 21 (1), 44–62. 10.1038/s41576-019-0171-x - DOI - PubMed
    1. Borst J., Ahrends T., Bąbała N., Melief C., Kastenmüller W. J. N. r. I. (2018). CD4+ T cell help in cancer immunology and immunotherapy. Nat. Rev. Immunol. 18 (10), 635–647. 10.1038/s41577-018-0044-0 - DOI - PubMed

LinkOut - more resources