. 2024 Apr 18:15:1368572.
doi: 10.3389/fimmu.2024.1368572. eCollection 2024.

Aberrant CD8+T cells drive reproductive dysfunction in female mice with elevated IFN-γ levels

Affiliations

Aberrant CD8+T cells drive reproductive dysfunction in female mice with elevated IFN-γ levels

Enitome E Bafor et al. Front Immunol. .

Abstract

Introduction: Interferon-gamma (IFN-γ) is pivotal in orchestrating immune responses during healthy pregnancy. However, its dysregulation, often due to autoimmunity, infections, or chronic inflammatory conditions, is implicated in adverse reproductive outcomes such as pregnancy failure or infertility. Additionally, the underlying immunological mechanisms remain elusive.

Methods: Here, we explore the impact of systemic IFN-γ elevation on cytotoxic T cell responses in female reproduction utilizing a systemic lupus-prone mouse model with impaired IFN-γ degradation.

Results: Our findings reveal that heightened IFN-γ levels triggered the infiltration of CD8+T cells in the pituitary gland and female reproductive tract (FRT), resulting in prolactin deficiency and subsequent infertility. Furthermore, we demonstrate that chronic IFN-γ elevation increases effector memory CD8+T cells in the murine ovary and uterus.

Discussion: These insights broaden our understanding of the role of elevated IFN-γ in female reproductive dysfunction and suggest CD8+T cells as potential immunotherapeutic targets in female reproductive disorders associated with chronic systemic IFN-γ elevation.

Keywords: CD8+ T cells; hypophysitis; implantation failure; interferon-gamma (IFN-γ); luteinization defect; pregnancy; prolactin deficiency; tissue-resident memory.


Conflict of interest statement

The authors declare that the research was conducted in the absence of any commercial or financial relationships that could be construed as a potential conflict of interest. The author(s) declared that they were an editorial board member of Frontiers, at the time of submission. This had no impact on the peer review process and the final decision.

Figures
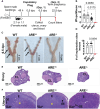
Figure 1
Figure 1
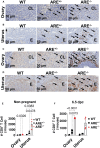
ARE-/- female mice are infertile. (A) Schematic depicting the pairing and timing of tissue collection for fertility outcome experiments. dpc, days post-coitum; Grp, Group. (B) The average number of pups delivered per litter per group (n = 7–8). (C) Representative whole-mount 6.5 dpc uteri showing the implantation sites (black arrows) of pregnant wild-type (WT) and ARE+/- female mice. ARE-/- mice that were plugged but not pregnant displayed no implantation sites at 6.5 dpc, demonstrating complete implantation failure. (D) ARE+/- female mice show comparable implantation sites at 6.5 dpc with WT controls (n = 4–5). Representative WT, ARE+/-, and ARE-/- mice histology sections at 6.5 dpc of the (E) ovary and (F) uterus (n = 4–5). CL, corpus luteum; E, endometrium; GE, glandular epithelium. The yellow asterisk (*) indicates decidualization. All experiments were performed two independent times. Statistical significance: one-way ANOVA with Kruskal–Wallis test was performed in all cases. Data represent mean ± SEM, and n denotes animals per group.
Figure 2
Figure 2
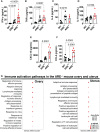
ARE-/- mice displayed elevated immune activation profiles. Circulating plasma levels of (A) IFN-γ (n = 8–12), (B) TNF-α (n = 6–8), (C) IL-6 (n = 5), (D) IL-10 (n = 7–8), (E) CXCL10 (n = 6–8), and (F) CCL4 (n = 5–7) in non-pregnant wild-type (WT) ARE+/- and ARE-/- mice at diestrus. Statistical significance: one-way ANOVA with Kruskal–Wallis test (data from two independent experiments). Data represent mean ± SEM. (G) Functional enrichment analysis of the top 10 GO BP terms enriched in genes identified by DESeq2 LRT analysis as being upregulated in non-pregnant ARE-/- mouse ovaries and uteri and downregulated in WT cohorts (n = 3, false discovery rate <5%). n denotes animals per group in all cases.
Figure 3
Figure 3
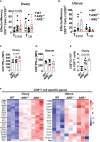
CD8+ T cells infiltrated ARE-/- mouse ovary and uterus. (A, B) Heat map of normalized gene expression related to T cell activation in non-pregnant ovary and uterus (n = 3). (C, D) RT-PCR of Ifng gene expression relative to Hprt in the ovary and uterus (n = 4–5). The experiments were performed two independent times (n = 3-4). (EH) Flow cytometry analysis of the ovary and uterus showing (E, F) increased CD8+ T cell frequencies and (G, H) absolute numbers (n = 6–11). The experiments were performed three independent times. Statistical significance: one-way ANOVA with Kruskal–Wallis test was performed in all cases. Data represent mean ± SEM, and n denotes animals per group.
Figure 4
Figure 4
Immunohistochemistry (IHC) supported CD8+T cell infiltration of the ARE-/- mouse ovary and uterus. Representative IHC images showing the distribution of CD8a-positive cells (black arrows) in (A, B) non-pregnant ovary and uterus and in (C, D) 6.5-dpc ovary and uterus. CL, corpus luteum; E, endometrium. Black arrows = CD8a+ T cells. (E, F) Number of CD8a+ T cells within the ovary (two ovary sections per mouse) and uterus (per mm2) in (E) non-pregnant and (F) 6.5-dpc mice (n = 4). All experiments were performed two independent times. Statistical significance: two-way ANOVA with Tukey’s multiple-comparison test. Data represent mean ± SEM, and n denotes animals per group.
Figure 5
Figure 5
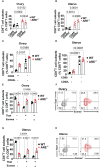
Increased effector CD8+ T cells in ARE-/- mouse ovary and uterus. Flow cytometry analysis showing (A, B) frequencies of effector/effector memory (TE/EM) and central memory (TCM) CD8+ T cells in the ovary and uterus (n = 5–9). (C, D) Mean fluorescence intensity of IFN-γ spontaneously released by CD8+T cells in the ovary and uterus (n = 4–6). (E) Frequency of CD8+CD178+ cells in the ovary (n = 3–6). All experiments were performed three independent times. Statistical significance: one- or two-way ANOVA with Kruskal–Wallis or Tukey’s test, respectively. Data represent mean ± SEM. (F) Heat maps of the normalized gene expression of CD8+T cell-specific genes in the ovary (left) and uterus (right) (n = 3). n denotes animals per group in all cases.
Figure 6
Figure 6
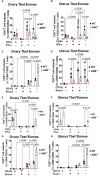
Increased CD8+TEM cells in the ARE-/- mouse ovary and uterus. (A, B) CD69 and CD49a expression on CD8+T cells in the ovary and uterus (n = 3–5). (C, D) CD8+CD62L+/- T cells in the ovary and uterus (n = 3–4). (E–H) Bar graphs and representative flow cytometry density plots of Tbet and Eomes expression on CD8+T cells in the (E, F) ovary and (G, H) uterus, respectively (n = 3). All experiments were performed two independent times. Statistical significance: two-way ANOVA with Tukey’s test. Data represent mean ± SEM, and n denotes animals per group.
Figure 7
Figure 7
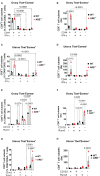
Effector and resident memory status of the dominant CD8+CD69-CD62L- in the ovary and uterus based on Tbet, Eomes, CD44, IFN-γ, CD103, and Runx3 expression. (A, B) Frequencies of CD44 and IFN-γ expression and (C, D) CD103 and Runx3 expression on CD8+CD69-CD62L-Tbet-Eomes- T cells in the ovary and uterus (n = 3). (E, F) Frequencies of CD44 and IFN-γ expression and (G, H) CD103 and Runx3 expression on CD8+CD69-CD62L-Tbet+Eomes- T cells in the ovary and uterus (n = 3). All experiments were performed three independent times. Statistical significance: two-way ANOVA with Tukey’s test. Data represent mean ± SEM, and n denotes animals per group.
Figure 8
Figure 8
Analysis of TEM and TRM subsets of CD8+T cells in the ovary and uterus based on Tbet+Eomes+ expression. (A–D) CD44 expression increased in Tbet+Eomes+CD8+T cells in the ARE-/- mouse ovary and uterus (n = 3). (E–H) CD103 and Runx3 expression increased in Tbet+Eomes+CD8+T cells in the ARE-/- mouse ovary and uterus (n = 3). All experiments were performed two independent times. Statistical significance: two-way ANOVA with Tukey’s test. Data represent mean ± SEM, and n denotes animals per group.
Figure 9
Figure 9
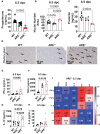
ARE-/- mice exhibited prolactin deficiency in the presence of hypophysitis. (A) Circulating progesterone at 6.5 dpc (n = 6–8). (B) Average nuclei count per defined corpora lutea (CL) area at 6.5 dpc (n = 4–5). Each data point corresponds to one CL. (C) Circulating prolactin at 6.5 dpc (n = 4–7). (D) Representative immunohistochemistry of pituitary gland sections showing qualitative CD8+T cell infiltration (black arrows) of the anterior lobe (n = 4). Plasma levels of (E) IFN-γ (n = 4–5), (F) TNF-α (n = 3–5), (G), IL-10 (n = 4–5), and (H) IL-6 (n = 3–4). (I) Spearman correlation analysis of IFN-γ, TNF-α, IL-6, Prl, and P4 in ARE-/- mice at 6.5 dpc (n = 4), * = p < 0.05; ns, not significant. All experiments were performed two independent times. Statistical significance: one-way ANOVA with Kruskal–Wallis test was used except where otherwise indicated. Data represent mean ± SEM, and n denotes animals per group.
Figure 10
Figure 10
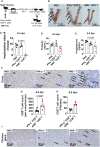
ARE-/- mouse CD8+ T cells targeted the ovary and pituitary. (A) Protocol illustration for the adoptive transfer and mating of CD8+T cell recipient and PBS-control Rag1 -/- female mice. sync, synchronize; EU, euthanize. (B) Representative whole-mount 6.5-dpc uteri showed several implantation sites (black arrows) in pregnant PBS-control and IFN-γ-/- CD8+T cell recipient Rag1 -/- mice, while the ARE-/- CD8+T cell recipient group showed decreased implantation sites (n = 4). (C) ARE-/- CD8+T cell recipient Rag1-/- female mice had decreased implantation sites at 6.5 dpc compared to IFN-γ-/- CD8+T cell recipients and PBS-controls (n = 4). (D) Circulating prolactin (n = 4) and (E) progesterone (n = 4) in CD8+T cell recipient and PBS-control Rag1 -/- female mice. (F) Representative immunohistochemistry (IHC) images showing the distribution of CD8a-positive cells (black arrows) in the ovary of Rag1 -/- female mice (n = 4). (G) IHC CD8a+T cell counts in the ovary and (H) pituitary glands (n = 3). (I) Representative IHC images showing the distribution of CD8a-positive cells (black arrows) in the pituitary of Rag1 -/- female mice (n = 4). IFN-γ-/- CD8+T or IFN-γ-/- T, recipient of IFN-γ-/- CD8+T cells; ARE-/- CD8+T or ARE-/- T, recipient of ARE-/- CD8+T cells. All experiments were performed two independent times. Statistical significance: one-way ANOVA with Kruskal–Wallis test or two-tailed Student’s t-test with Mann–Whitney analysis was used. Data represent mean ± SEM, and n denotes animals per group.

References

    1. Aplin JD, Ruane PT. Embryo-epithelium interactions during implantation at a glance. J Cell Sci. (2017) 130:15–22. doi: 10.1242/jcs.175943 - DOI - PubMed
    1. Li ZY, Song ZH, Meng CY, Yang DD, Yang Y, Peng JP. IFN-gamma modulates Ly-49 receptors on NK cells in IFN-gamma-induced pregnancy failure. Sci Rep. (2015) 5:18159. doi: 10.1038/srep18159 - DOI - PMC - PubMed
    1. Li ZY, Chao HH, Liu HY, Song ZH, Li LL, Zhang YJ, et al. . IFN-gamma induces aberrant CD49b(+) NK cell recruitment through regulating CX3CL1: a novel mechanism by which IFN-gamma provokes pregnancy failure. Cell Death Dis. (2014) 5:e1512. doi: 10.1038/cddis.2014.470 - DOI - PMC - PubMed
    1. Chaouat G, Menu E, Clark DA, Dy M, Minkowski M, Wegmann TG. Control of fetal survival in CBA × DBA/2 mice by lymphokine therapy. Reproduction. (1990) 89:447–58. doi: 10.1530/jrf.0.0890447 - DOI - PubMed
    1. Chaturvedi V, Ertelt JM, Jiang TT, Kinder JM, Xin L, Owens KJ, et al. . CXCR3 blockade protects against Listeria monocytogenes infection-induced fetal wastage. J Clin Invest. (2015) 125:1713–25. doi: 10.1172/JCI78578 - DOI - PMC - PubMed

Publication types