. 2024 Apr 18:26:101064.
doi: 10.1016/j.mtbio.2024.101064. eCollection 2024 Jun.

Conductive and alignment-optimized porous fiber conduits with electrical stimulation for peripheral nerve regeneration

Affiliations

Conductive and alignment-optimized porous fiber conduits with electrical stimulation for peripheral nerve regeneration

Kai Liu et al. Mater Today Bio. .

Abstract

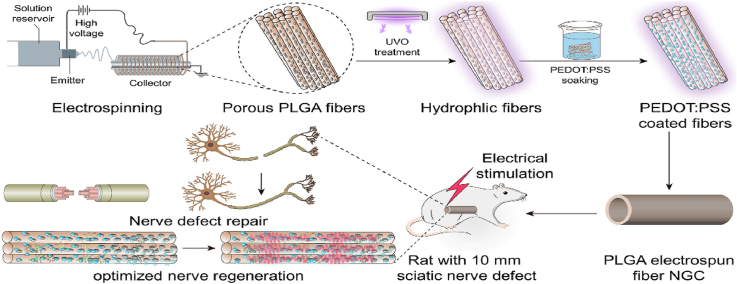
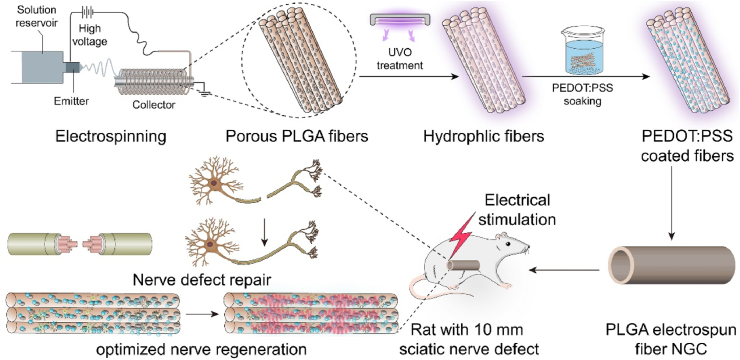
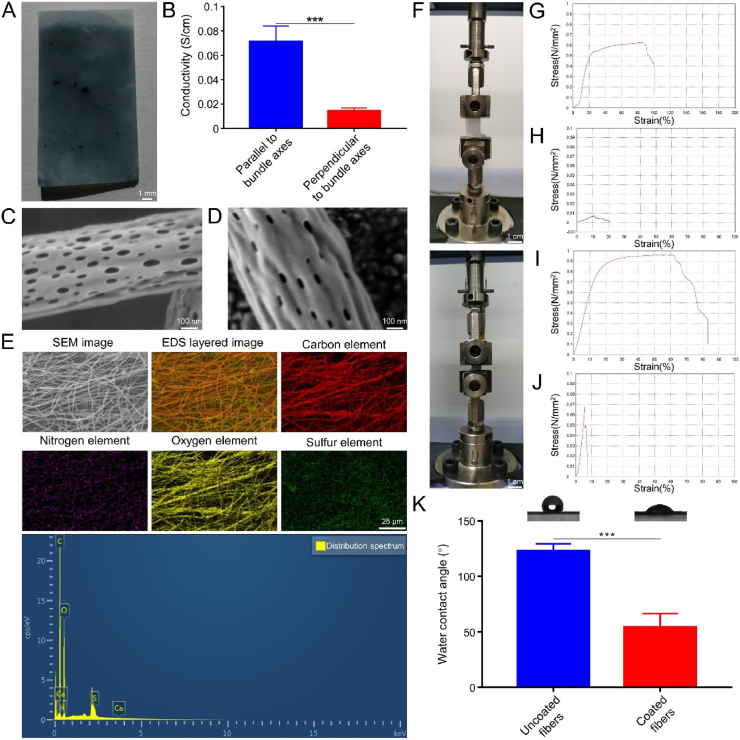
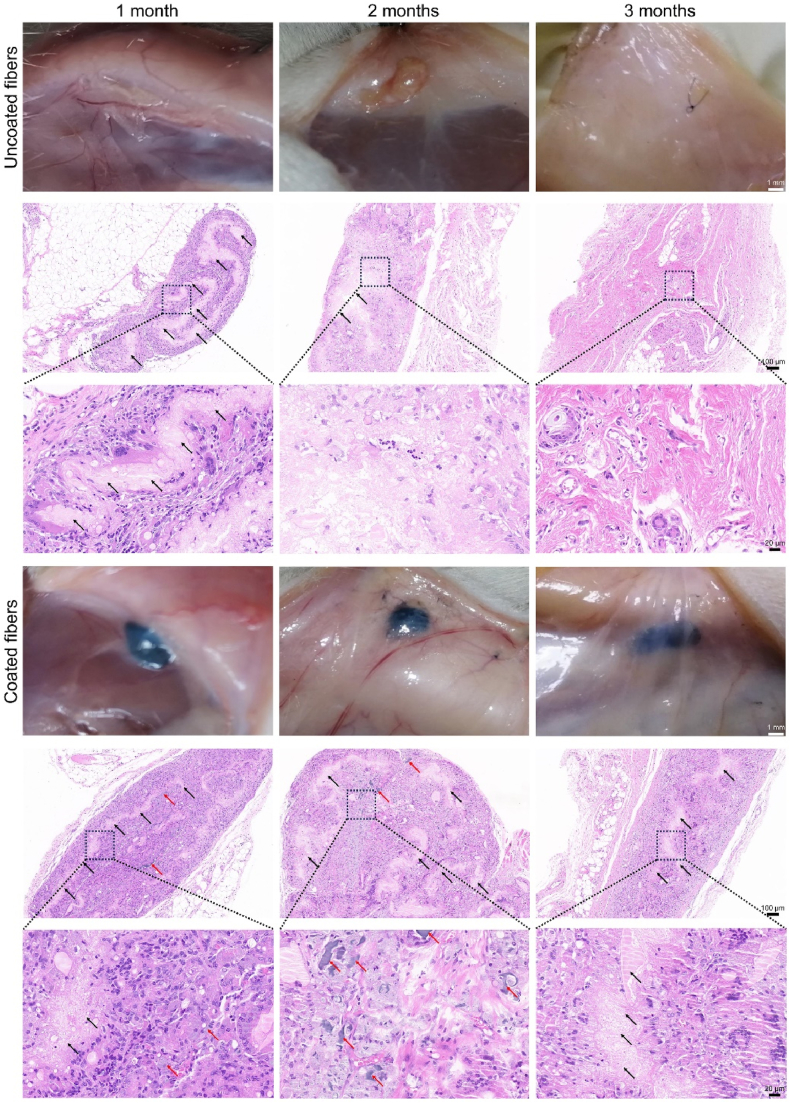
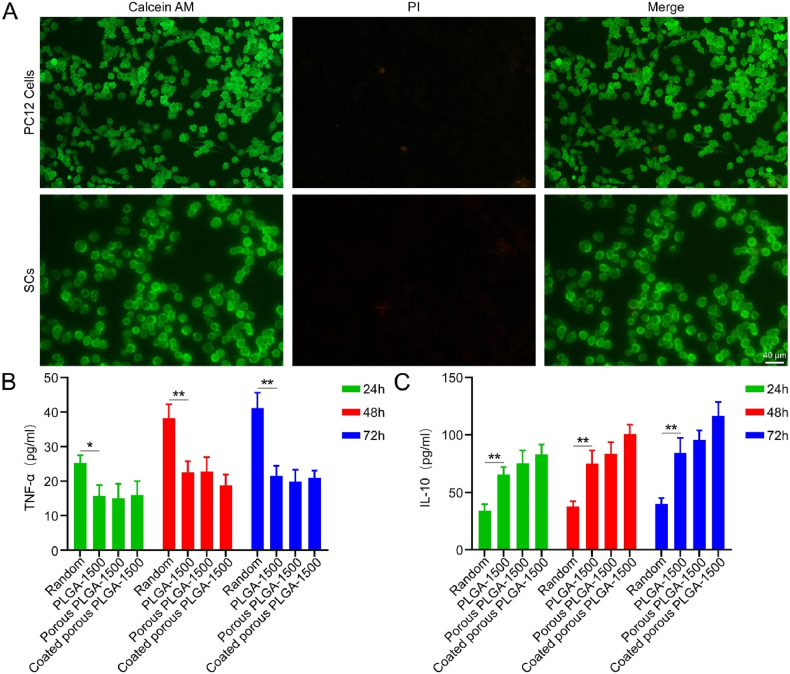
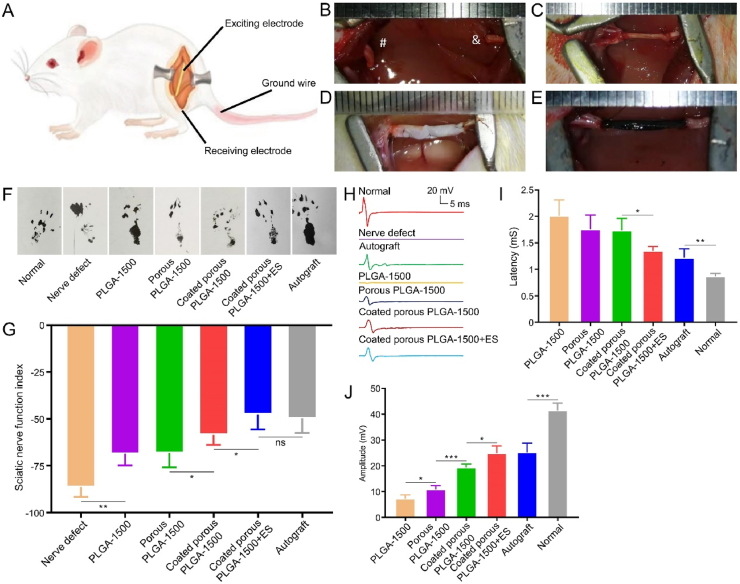
Autologous nerve transplantation (ANT) is currently considered the gold standard for treating long-distance peripheral nerve defects. However, several challenges associated with ANT, such as limited availability of donors, donor site injury, mismatched nerve diameters, and local neuroma formation, remain unresolved. To address these issues comprehensively, we have developed porous poly(lactic-co-glycolic acid) (PLGA) electrospinning fiber nerve guide conduits (NGCs) that are optimized in terms of alignment and conductive coating to facilitate peripheral nerve regeneration (PNR) under electrical stimulation (ES). The physicochemical and biological properties of aligned porous PLGA fibers and poly(3,4-ethylenedioxythiophene):polystyrene sodium sulfonate (PEDOT:PSS) coatings were characterized through assessments of electrical conductivity, surface morphology, mechanical properties, hydrophilicity, and cell proliferation. Material degradation experiments demonstrated the biocompatibility in vivo of electrospinning fiber films with conductive coatings. The conductive NGCs combined with ES effectively facilitated nerve regeneration. The designed porous aligned NGCs with conductive coatings exhibited suitable physicochemical properties and excellent biocompatibility, thereby significantly enhancing PNR when combined with ES. This combination of porous aligned NGCs with conductive coatings and ES holds great promise for applications in the field of PNR.

Keywords: Conductive coating; Electrical stimulation; Electrospinning fibers; Nerve guide conduit; Peripheral nerve defect.


Conflict of interest statement

The authors declare that they have no known competing financial interests or personal relationships that could have appeared to influence the work reported in this paper.

Figures

Image 1
Graphical abstract
Scheme 1
Scheme 1
Schematic illustration of porous aligned PEDOT:PSS-coated PLGA electrospinning NGC for promoting nerve regeneration under ES.
Fig. 1
Fig. 1
Preparation of aligned porous electrospinning fibers and their physical properties. (A) SEM images depict PLGA fibers at various roller speeds. (B) The alignment of PLGA fibers is quantified at different rotational speeds (n = 100, n represents the number of electrospinning fibers for each speed). (C) SEM images display PLGA electrospinning fibers prepared using different volume ratios of DCM/DMF polymer solutions. (D) and (E) The hydrophilicity of PLGA fiber films with different alignments is evaluated (n = 7, n indicates the number of samples tested in each group). (F) Fiber diameter measurements are conducted on PLGA fiber films at different roller speeds to assess their size distribution and uniformity (n = 100, n represents the number of electrospinning fibers for each rotational speed; * indicates P < 0.05 compared with PLGA-0 group). (G) External phase, (H) density, (I) porosity, and (J) water absorption of different PLGA fiber films (n = 3, n indicates the number of samples tested in each group). All statistical data are represented as mean ± SD.
Fig. 2
Fig. 2
The impact of gradient dilution of the PEDOT:PSS solution on cell proliferation. (A) The external phase of the gradient dilution of the PEDOT:PSS solution. (B) The impact of gradient dilution of the PEDOT:PSS solution on the proliferation of PC-12 and SC cells (n = 5, n represents the number of experimental replicates at each coating concentration). All statistical data are represented as mean ± SD (* indicates P < 0.05, ** indicates P < 0.01, *** indicates P < 0.001).
Fig. 3
Fig. 3
External phase and characterization of porous PLGA electrospinning fibrous films coated with the optimal concentration of PEDOT:PSS. (A) The external phase of the coated porous PLGA electrospinning fiber film. (B) The electrical conductivity of coated porous PLGA electrospinning fiber films (n = 9, n represents the number of samples tested in each group). The surface morphology of (C) uncoated and (D) coated porous PLGA fiber films. (E) The mapping and EDX results of porous PLGA fiber films coated with optimal concentrations of PEDOT:PSS (n = 3, n indicates the number of samples tested in each group). (F) The mechanical properties of PLGA fiber films were tested. Stress-strain curves were obtained for uncoated PLGA fiber films in both parallel (G) and perpendicular (H) directions to the fiber alignment (n = 3, n indicates the number of samples tested in each group). Stress-strain curves were obtained for coated PLGA fiber films in both parallel (I) and perpendicular (J) directions to the fiber alignment (n = 3, n indicates the number of samples tested in each group). (K) The in vitro hydrophilicity of coated and uncoated PLGA fiber films (n = 10, n indicates the number of samples tested in each group). All statistical data are represented as mean ± SD (*** indicates P < 0.001).
Fig. 4
Fig. 4
The external phase of in vivo degradation and H&E staining were performed on PLGA fiber films at various time points. No evident edema, oozing, or inflammation was observed in the implanted area of the fiber film during the external phase evaluation. Additionally, H&E staining revealed no significant aggregation of inflammatory cells within both the PLGA fiber film and its coating area, indicating excellent biocompatibility of the implanted material. The magnified area is indicated by a black square, while PLGA fiber films are denoted by black arrows and PEDOT:PSS coating by red arrows (n = 3, n indicates the number of samples tested in each group). (For interpretation of the references to colour in this figure legend, the reader is referred to the Web version of this article.)
Fig. 5
Fig. 5
The impact of electrospinning fiber alignment, surface morphology, and conductive coating on cellular response. (A) The results of double staining for living and dead cells in PEDOT:PSS solution at the optimal concentration (the left column is calcein AM staining, the middle column is PI staining, and the right column is merged photos) (n = 3, n indicates the number of experimental replicates). The secretion of TNF-α (B) and IL-10 (C) by macrophages cultured on various electrospinning fibers was quantified using the ELISA assay (n = 3, n indicates the number of experimental replicates). All statistical data are represented as mean ± SD (* indicates P < 0.05, ** indicates P < 0.01).
Fig. 6
Fig. 6
Animal experimental procedures and the recovery of motor function and neurophysiology in the lower extremities of rats were evaluated after a 3-month treatment period. (A) Schematic diagrams illustrating the positions of ES and electrophysiological testing electrodes. (B) Nerve defect model, in which (&) and (#) represent the proximal and distal ends of the nerve defect, respectively (n = 10, n indicates the number of experimental animals in each group). (C) Autograft group (n = 10, n indicates the number of experimental animals in each group). (D) Uncoated NGC group (n = 10, n indicates the number of experimental animals in each group). (E) Coated NGC group (n = 10, n indicates the number of experimental animals in each group). (F) The photographs of rat footprints in each experimental group. (G) The SFI index of rats in each experimental group (n = 5, n indicates the number of experimental animals in each group). The neurophysiological analysis includes the waveform (H), latency (I), and amplitude (J) of CMAPs for each group at the 3-month detection after treatment (n = 4, n indicates the number of experimental animals in each group). All statistical data are represented as mean ± SD (* indicates P < 0.05, ** indicates P < 0.01, *** indicates P < 0.001).
Fig. 7
Fig. 7
Analysis of GM 3 months post-treatment. (A) Photographs of GM in each experimental group (left muscles were the experimental GM and right muscles were the contralateral normal GM) and Masson staining of GM. (B) The weight ratio of GM on the experimental side to that on the normal side (n = 5, n indicates the number of experimental animals in each group). (C) The mean diameter of GM fibers on the experimental side (n = 50, n indicates the number of muscle fibers in each group). All statistical data are represented as mean ± SD (* indicates P < 0.05, ** indicates P < 0.01, *** indicates P < 0.001).
Fig. 8
Fig. 8
Histologic examination of regenerated nerves at the 3-month post-treatment time point. (A) The regenerated nerves in each group were evaluated at 3 months after treatment using H&E staining and TEM images (n = 5, n indicates the number of samples tested in each group). (B) The diameter of myelinated axons (n = 20, n indicates the number of myelinated axons in each group) and (C) the thickness of myelin sheath (n = 20, n indicates the number of myelin sheaths in each group) in each group at 3 months after treatment. All statistical data are represented as mean ± SD (* indicates P < 0.05, ** indicates P < 0.01, *** indicates P < 0.001).
Fig. 9
Fig. 9
Immunofluorescence analysis was performed on regenerated sciatic nerves 3 months post-treatment. (A) The triple immunofluorescent staining of GFAP and Tuj-1 (red, GFAP; green, Tuj-1). (B) The triple immunofluorescent staining of NF200 and MBP (red, NF200; green, MBP). (C) The fluorescence density of GFAP, Tuj-1, NF200, and MBP was quantified using a semiquantitative approach (n = 3, n indicates the number of samples tested in each group). All statistical data are represented as mean ± SD (* indicates P < 0.05, ** indicates P < 0.01). (For interpretation of the references to colour in this figure legend, the reader is referred to the Web version of this article.)
Fig. 10
Fig. 10
Transcriptomic profiles of regenerated sciatic nerves. (A) A volcano plot illustrating the DEGs between the coated porous PLGA-1500 + ES group and the coated porous PLGA-1500 group is presented. The significantly up-regulated DEGs are represented by red dots, while the down-regulated DEGs are indicated by green dots. Furthermore, GO enrichment analysis and KEGG pathway enrichment analysis were conducted to compare the differences between the coated porous PLGA-1500 + ES and coated porous PLGA-1500 groups (n = 3, n indicates the number of samples tested in each group). (B) A volcano plot was generated to compare the DEGs between the coated porous PLGA-1500 + ES group and the autograph group. The significantly up-regulated DEGs are represented by red dots, while the down-regulated DEGs are indicated by green dots. Additionally, GO enrichment analysis and KEGG pathway enrichment analysis were performed to explore the functional annotations and pathways associated with these two groups (n = 3, n indicates the number of samples tested in each group). (C) A volcano plot was generated to compare the DEGs between the coated porous PLGA-1500 group and the autograph group. The significantly up-regulated DEGs are represented by red dots, while the down-regulated DEGs are indicated by green dots. Additionally, GO enrichment analysis and KEGG pathway enrichment analysis were performed to explore the functional annotations and pathways associated with these two groups (n = 3, n indicates the number of samples tested in each group). (For interpretation of the references to colour in this figure legend, the reader is referred to the Web version of this article.)

Similar articles

Cited by

References

    1. Yang Y., Rao C., Yin T., Wang S., Shi H., Yan X., et al. Application and underlying mechanism of acupuncture for the nerve repair after peripheral nerve injury: remodeling of nerve system. Front. Cell. Neurosci. 2023;17 doi: 10.3389/fncel.2023.1253438. - DOI - PMC - PubMed
    1. Contreras E., Traserra S., Bolívar S., Nieto-Nicolau N., Jaramillo J., Forés J., et al. Decellularized graft for repairing severe peripheral nerve injuries in Sheep. Neurosurgery. 2023;93(6):1296–1304. doi: 10.1227/neu.0000000000002572. - DOI - PubMed
    1. Shah H.R., Bertelli J.A. Long-term donor-site morbidity following entire sural nerve harvest for grafting. The Journal of hand surgery. 2023;48(11) doi: 10.1016/j.jhsa.2023.03.009. 1173.e1-.e7. - DOI - PubMed
    1. Panagopoulos G.N., Megaloikonomos P.D., Mavrogenis A.F. The present and future for peripheral nerve regeneration. Orthopedics. 2017;40(1):e141–e156. doi: 10.3928/01477447-20161019-01. - DOI - PubMed
    1. Castro V.O., Merlini C. Aligned electrospun nerve conduits with electrical activity as a strategy for peripheral nerve regeneration. Artif. Organs. 2021;45(8):813–818. doi: 10.1111/aor.13942. - DOI - PubMed

LinkOut - more resources