

Surface-phonon-polariton-enhanced photoinduced dipole force for nanoscale infrared imaging
- PMID: 38698902
- PMCID: PMC11065349
- DOI: 10.1093/nsr/nwae101
Surface-phonon-polariton-enhanced photoinduced dipole force for nanoscale infrared imaging
Abstract
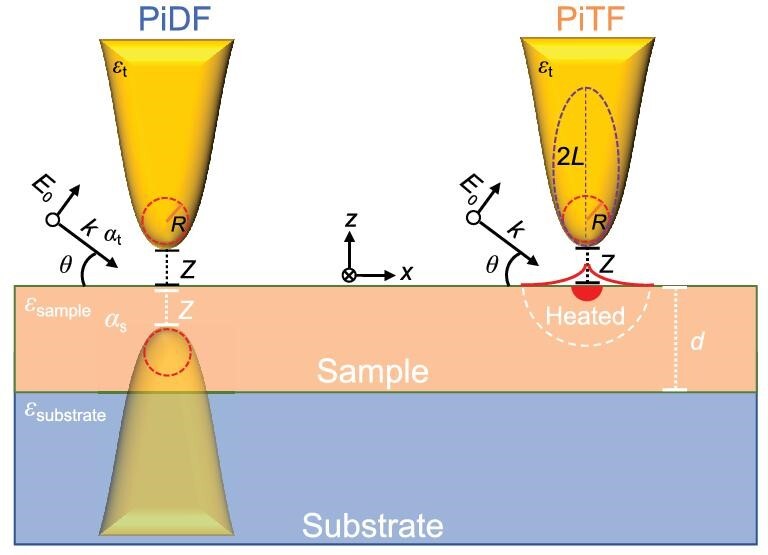
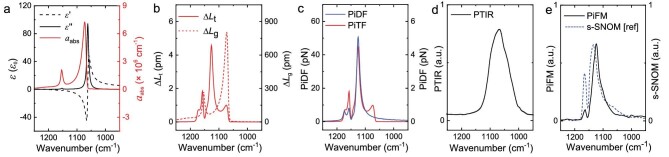
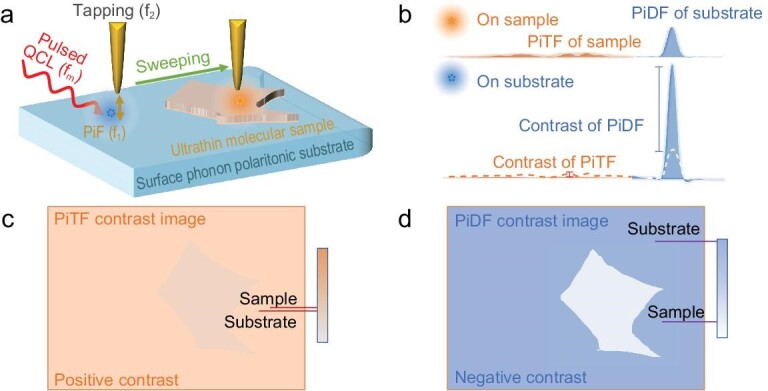
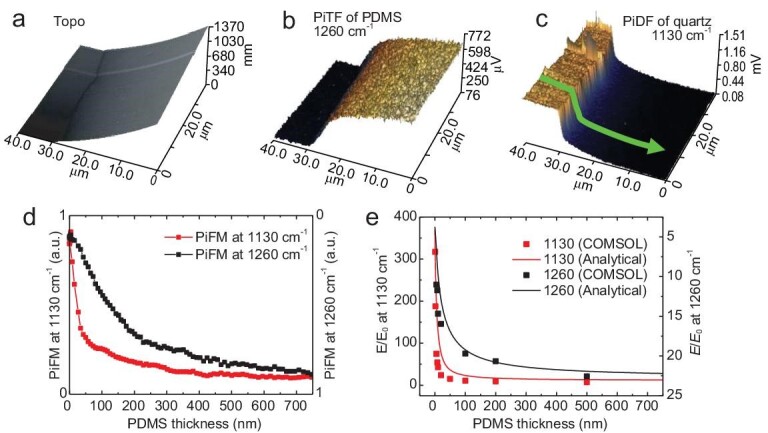
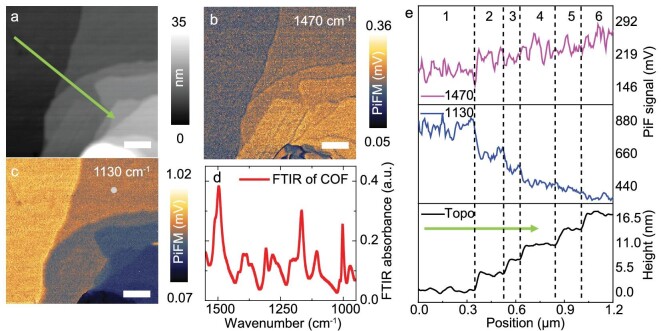
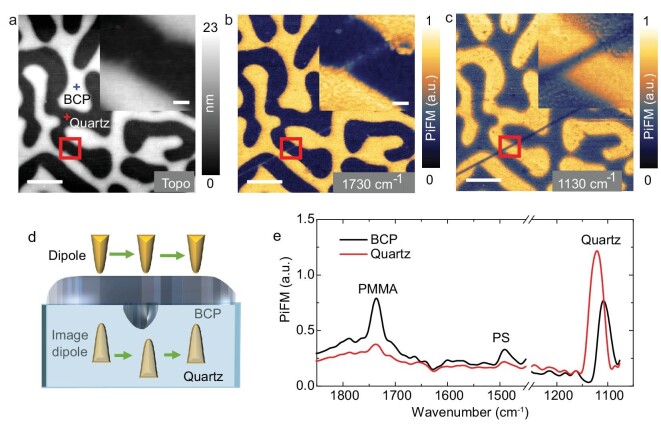
The photoinduced dipole force (PiDF) is an attractive force arising from the Coulombic interaction between the light-induced dipoles on the illuminated tip and the sample. It shows extreme sample-tip distance and refractive index dependence, which is promising for nanoscale infrared (IR) imaging of ultrathin samples. However, the existence of PiDF in the mid-IR region has not been experimentally demonstrated due to the coexistence of photoinduced thermal force (PiTF), typically one to two orders of magnitude higher than PiDF. In this study, we demonstrate that, with the assistance of surface phonon polaritons, the PiDF of c-quartz can be enhanced to surpass its PiTF, enabling a clear observation of PiDF spectra reflecting the properties of the real part of permittivity. Leveraging the detection of the PiDF of phonon polaritonic substrate, we propose a strategy to enhance the sensitivity and contrast of photoinduced force responses in transmission images, facilitating the precise differentiation of the heterogeneous distribution of ultrathin samples.
Keywords: nanoscale infrared imaging; photoinduced dipole force; surface phonon polariton; ultrathin sample.
© The Author(s) 2024. Published by Oxford University Press on behalf of China Science Publishing & Media Ltd.
Figures
Similar articles
-
Advances and challenges in dynamic photo-induced force microscopy.Discov Nano. 2024 Nov 21;19(1):190. doi: 10.1186/s11671-024-04150-1. Discov Nano. 2024. PMID: 39572421 Free PMC article. Review.
-
Substructure imaging of heterogeneous nanomaterials with enhanced refractive index contrast by using a functionalized tip in photoinduced force microscopy.Light Sci Appl. 2018 Oct 10;7:73. doi: 10.1038/s41377-018-0069-y. eCollection 2018. Light Sci Appl. 2018. PMID: 30323925 Free PMC article.
-
Nanoscale spectroscopic origins of photoinduced tip-sample force in the midinfrared.Proc Natl Acad Sci U S A. 2019 Dec 26;116(52):26359-26366. doi: 10.1073/pnas.1913729116. Epub 2019 Dec 11. Proc Natl Acad Sci U S A. 2019. PMID: 31826953 Free PMC article.
-
Substrate Matters: Surface-Polariton Enhanced Infrared Nanospectroscopy of Molecular Vibrations.Nano Lett. 2019 Nov 13;19(11):8066-8073. doi: 10.1021/acs.nanolett.9b03257. Epub 2019 Oct 8. Nano Lett. 2019. PMID: 31574225
-
Mid-infrared polaritonic coupling between boron nitride nanotubes and graphene.ACS Nano. 2014 Nov 25;8(11):11305-12. doi: 10.1021/nn504093g. Epub 2014 Nov 3. ACS Nano. 2014. PMID: 25365544
Cited by
-
Advances and challenges in dynamic photo-induced force microscopy.Discov Nano. 2024 Nov 21;19(1):190. doi: 10.1186/s11671-024-04150-1. Discov Nano. 2024. PMID: 39572421 Free PMC article. Review.
-
Force Volume Atomic Force Microscopy-Infrared for Simultaneous Nanoscale Chemical and Mechanical Spectromicroscopy.ACS Nano. 2025 May 20;19(19):18791-18803. doi: 10.1021/acsnano.5c04015. Epub 2025 May 11. ACS Nano. 2025. PMID: 40350657 Free PMC article.
-
Sensing nanoscale electromagnetic forces when the heat is on.Natl Sci Rev. 2024 May 27;11(7):nwae184. doi: 10.1093/nsr/nwae184. eCollection 2024 Jul. Natl Sci Rev. 2024. PMID: 38978614 Free PMC article. No abstract available.
References
-
- Li J, Pang J, Yan Z-d et al. Antenna enhanced infrared photoinduced force imaging in aqueous environment with super-resolution and hypersensitivity. CCS Chem 2022; 4: 2738–47.10.31635/ccschem.021.202101341 - DOI
LinkOut - more resources
Full Text Sources