Using external morphology as a proxy for stomach size in Hemigrapsus sanguineus
- PMID: 38698925
- PMCID: PMC11063776
- DOI: 10.1002/ece3.11344
Using external morphology as a proxy for stomach size in Hemigrapsus sanguineus
Abstract
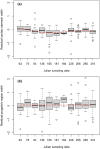
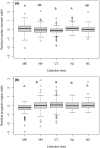
Stomach morphology can provide insights into an organism's diet. Gut size or length is typically inversely related to diet quality in most taxa, and has been used to assess diet quality in a variety of systems. However, it requires animal sacrifice and time-consuming dissections. Measures of external morphology associated with diet may be a simpler, more cost-effective solution. At the species level, external measures of the progastric region of the carapace in brachyuran crabs can predict stomach size and diet quality, with some suggestion that this approach may also work to examine individual diet preferences and specialization at the individual level; if so, the size of the progastric region could be used to predict trends in diet quality and consumption for individuals, which would streamline diet studies in crabs. Here, we tested whether external progastric region size predicts internal stomach size across latitude and time of year for individuals of the invasive Asian shore crab Hemigrapsus sanguineus. We found that the width of the progastric region increased at a faster rate with body size than stomach width. In addition, the width of the progastric region followed different trends across sites and over time compared to stomach width. Our results therefore suggest that the progastric region may not be used as a proxy for stomach size variation across individuals.
Keywords: Hemigrapsus sanguineus; diet quality; gut morphology; individual variation; progastric carapace region.
© 2024 The Authors. Ecology and Evolution published by John Wiley & Sons Ltd.
Conflict of interest statement
None declared.
Figures


References
-
- Bas, C. , Lancia, J. P. , Luppi, T. , Méndez‐Casariego, A. , Kittlein, M. , & Spivak, E. (2014). Influence of tidal regime, diurnal phase, habitat and season on feeding of an intertidal crab. Marine Ecology, 35(3), 319–331.
-
- Bolnick, D. I. , Yang, L. H. , Fordyce, J. A. , Davis, J. M. , & Svanbäck, R. (2002). Measuring individual‐level resource specialization. Ecology, 83(10), 2936–2941.
-
- Boudreau, S. A. , & Worm, B. (2012). Ecological role of large benthic decapods in marine ecosystems: A review. Marine Ecology Progress Series, 469, 195–213.
-
- Bourdeau, P. E. , & O'Connor, N. J. (2003). Predation by the nonindigenous Asian shore crab Hemigrapsus sanguineus on macroalgae and molluscs. Northeastern Naturalist, 10(3), 319–334.
-
- Brousseau, D. J. , & Baglivo, J. A. (2005). Laboratory investigations of food selection by the Asian shore crab, Hemigrapsus sanguineus: Algal versus animal preference. Journal of Crustacean Biology, 25(1), 130–134.
Associated data
LinkOut - more resources
Full Text Sources

