. 2024 Jan-Mar;16(1):14-29.
doi: 10.32607/actanaturae.27323.

Ultrastructural 3D Microscopy for Biomedicine: Principles, Applications, and Perspectives

Affiliations

Ultrastructural 3D Microscopy for Biomedicine: Principles, Applications, and Perspectives

K E Mochalov et al. Acta Naturae. 2024 Jan-Mar.

Abstract

Modern biomedical research often requires a three-dimensional microscopic analysis of the ultrastructure of biological objects and materials. Conceptual technical and methodological solutions for three-dimensional structure reconstruction are needed to improve the conventional optical, electron, and probe microscopy methods, which to begin with allow one to obtain two-dimensional images and data. This review discusses the principles and potential applications of such techniques as serial section transmission electron microscopy; techniques based on scanning electron microscopy (SEM) (array tomography, focused ion beam SEM, and serial block-face SEM). 3D analysis techniques based on modern super-resolution optical microscopy methods are described (stochastic optical reconstruction microscopy and stimulated emission depletion microscopy), as well as ultrastructural 3D microscopy methods based on scanning probe microscopy and the feasibility of combining them with optical techniques. A comparative analysis of the advantages and shortcomings of the discussed approaches is performed.

Keywords: biomedical research; electron microscopy; scanning probe microscopy; super-resolution optical microscopy; tomography; ultrastructural 3D microscopy.


Figures

Fig. 1
Fig. 1
The fundamental principle applied in obtaining three-dimensional images
Fig. 2
Fig. 2
Methods for obtaining three-dimensional images using TEM and SEM. Regardless of the type of microscopy, the first step is specimen preparation, which involves using polymer media to immobilize the specimen and then cut it into sections. Among specimen immobilization methods, the most popular techniques include fixation using methacrylate [8], cryofixation, freeze-fixation, and Tokuyasu cryosectioning [9]. The next step involves accumulating an array of 2D images using TEM or SEM. The recorded images should be aligned with the XY axes and potential rotation should be eliminated, being especially important for systems that study individual sections (ssTEM and array tomography). Next, the area that will be shown in the final image is selected from the resulting array. The final step is creating a full-fledged 3D image from the recorded 2D segments using specialized software
Fig. 3
Fig. 3
An ssTEM image of Golgi stacks in the mouse lung cell AE1. (A) One of the EM microphotographs of the series with color manual segmentation. (B) A 3D model of Golgi stacks obtained in TEM based on nine consecutive sections with manually segmented tanks of both stacks. Scale range: 500 nm. The figure was taken from ref. [6]
Fig. 4
Fig. 4
An AT image of an AE2 cell in the fibrotic parenchyma of the mouse lung. (AD) Sequential magnification of the SEM image from one of the sections of the tape (A). The asterisk on (D) corresponds to one AE2 cell in the fibrotic tissue area. Scale bar: 5 μm. (E) 3D reconstruction of the AE2 cell. Three separate cross-sectional planes from the sequence of recorded images are shown. (F) 3D reconstruction of the AE2 cell at different tilts. The figure was borrowed from ref. [6]
Fig. 5
Fig. 5
3D reconstructions obtained using serial block-face scanning electron microscopy (SBF-SEM), SEM with layer- by-layer etching with a focused ion beam (FIB-SEM), and electron tomography (ET). (A) 3D reconstruction of human alveolar epithelial type 1 cells (AE1) (yellow, gold, and blue) and the alveolar capillary network (white) based on the SBFSEM dataset. Arrows indicate the position of the nuclei of AE1 cells. (B) 3D reconstruction of virtually the entire human alveolar epithelial type 2 (AE2) cell (pink) with portions of adjacent AE1 cell domains (blue and yellow) and an additional AE2 cell (green) based on the FIB-SEM dataset. (C) 3D reconstruction of the lamellar body (top) and the autophagosome (bottom) inside an AE2 cell (mouse lung) based on the ET dataset. Separate lipid membranes are distinguishable, which in this case is indicative of a connection of two organelles (a red circle). The figure was taken from ref. [6]
Fig. 6
Fig. 6
The principle of the 3D STORM technique. (A) An optical scheme for determining the axial coordinate of a radiating object by analyzing the ellipticity of its image. The right panel shows images of the radiating object in the X and Y planes depending on its axial position. (B) Examples of the dependence of the ellipticity of the image of the emitting object (Alexa 647) for X and Y coordinates on focusing along the Z axis. (C) An example of the 3D distribution of single emitting objects and the corresponding histograms of the distribution in the X, Y, and Z directions. The figure was taken from ref. [45]
Fig. 7
Fig. 7
Results obtained using the 3D STORM technique. (A) A widefield fluorescent image of microtubules in a BS-C-1 cell. (B) An image obtained in the 3D STORM mode of the same section of the BSC-1 cell as that shown in panel (A). Data on the axial coordinates of the occurrence are presented in the pseudo-color scale. (C–E) The cross sections corresponding to the five microtubule strands in the X-Y, X-Z, and Y-Z directions in the BS-C-1 cell area are shown with a white rectangle in (B). (F) Z-profile histogram of two microtubules intersecting in the X-Y projection, plotted in the area indicated with a white arrow in panel (B). The figure was taken from ref. [45]
Fig. 8
Fig. 8
Schematic diagram of the setup for implementing the 3D-STED technique using a supercontinuum laser. The figure was borrowed from ref. [61]
Fig. 9
Fig. 9
Narrowing of the effective radiation area due to STED suppression of peripheral radiation. 1 – diffractionlimited fluorescent PSF. 2 – the torus-shaped STED beam narrows the diameter of the fluorescent PSF. 3 – fluorescent PSF in the case of 3D-STED
Fig. 10
Fig. 10
The results obtained using the 3D-STED technique. (A) Spatial resolution of fluorescent nanoparticles 44 nm in diameter: 52 nm in the X-direction and 110 nm in the axial (Z) direction. (B) A 3D image of fluorescently labeled microtubules: visualization of the isosurface (top) and projection of maximum intensity along the Y axis (bottom) – 30 sections. The inset shows the intensity profile at the specified location. (C) Sections obtained at a 100 nm increment in the Z direction. The figure was taken from ref. [61]
Fig. 11
Fig. 11
Tomographic reconstruction of a section of human bone, 256 × 256 × 19 voxels, step-by-step chemical etching of 80 nm. The color scale is the value of the phase shift of the SPM probe oscillations normalized to unity. The figure is borrowed from ref. [70]
Fig. 12
Fig. 12
A setup for implementing the SPM-UMT procedure: Ntegra Tomo unification methodology (NT-MDT, Russia). The left panel is the working position for carrying out SPM measurements; the right panel – the SPM head is reserved for performing the UMT cut. (1) SPM probe holder; (2) test specimen; (3) UMT knife holder; (4) SPM-head supports; (5) SPM-head support platform; (6) SPM-head motorized supply system; (7) micrometer screws of the SPM-head positioner; (8) polycorundum support plates; (9) SPM-head hinge fastening system; (10) the system of motorized removal of the SPM-head to bring it to the position of the UMT-cut; and (11) The restrictive support of the UMT console. The figure was taken from ref. [73]
Fig. 13
Fig. 13
3D SPNT reconstruction of a cardiomyocyte enveloping nanofibers. (A) One of the topographic SPM images (phase contrast) used for 3D reconstruction. Insert: a zoomed-in area, shown with a rectangle, including fibers and a membrane fold; (B, C) 3D models of a cardiomyocyte enveloping nanofibers (16.0 × 16.0 × 6.5 μm, 54 sections, 120 nm section thickness). The selected plane in (B) corresponds to the position of the SPM image in (A). The dimensional bar is 1 μm. The figure was taken from ref. [83]
Fig. 14
Fig. 14
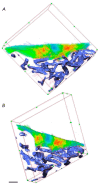
Visualization of the 3D SPNT reconstruction of a fibroblast fragment (shown with green and red) and surrounding polyurethane fibers (blue), 23 sections 150 nm thick, reconstructed volume 32.0 × 32.0 × 3.3 μm, scale bar is 3 μm. The reconstructed fibroblast fragment is shown in two views (A and B). The measurements were carried out in the phase contrast mode under normal atmospheric conditions at room temperature. The figure was taken from ref. [84]
Fig. 15
Fig. 15
Cryo-SPNT reconstruction of a single microparticle of the rat liver extracellular matrix on the surface of an alginate microcarrier performed at –120°C: (A) optical microscopy, Coomassie Brilliant Blue R-250 staining; (B) 3D cryo-SPM reconstruction of a single rat liver extracellular matrix microparticle obtained from 13 sequential cryo-SPM images of the microparticle surface on a spherical alginate microcarrier after successive 80-nm thick cryosections. The reconstructed volume is 5.0 × 5.0 × 1.1 μm. The resolution of each 2D SPM scan is 400 × 400 pixels. The pseudocolor palette corresponds to the phase shift of the SPM probe oscillations normalized to unity. The figure was taken from ref. [87]
Fig. 16
Fig. 16
Analysis of human breast adenocarcinoma MCF-7 cell samples with doxorubicin. (A) An SPM image of the topography of the cut surface of the MCF-7 cell, scan size 13.8 × 9.5 μm; height variation range, 33.5 nm; (B) fluorescent image of a cut of the same area of the MCF-7 cell; (C) 3D reconstruction of doxorubicin distribution in the volume of the MCF-7 cell sample, 22.5 × 18.7 × 2.4 μm; section thickness, 120 nm; the dimensional segment, 5 μm; visualization is presented in two views. The figure was taken from ref. [92]

Similar articles

References

    1. Franken L.E., Grünewald K., Boekema E.J., Stuart M.C.A.. Small. 2020;16(14):e1906198. - PubMed
    1. Northover A.S., Keatley S., Elliot A.D., Hobbs R.P., Yang R., Lymbery A.J., Godfrey S.S., Wayne A.F., Thompson R.C.A.. Syst. Parasitol. 2019;96(7):553–563. - PubMed
    1. Bian K., Gerber C., Heinrich A., Müller D., Scheuring S., Jiang Y., Nat. Rev. Meth. Primers. 2021;1(1):1–36.:10.1038/s43586-021-00033-2.
    1. Rust M.J., Bates M., Zhuang X., Nat. Meth. 2006;3(10):793–795. - PMC - PubMed
    1. Hell S.W., Wichmann J.. Opt. Lett. 1994;19(11):780–782. - PubMed

LinkOut - more resources