. 2024 Apr 22;10(9):e30014.
doi: 10.1016/j.heliyon.2024.e30014. eCollection 2024 May 15.

Electroacupuncture intervention alleviates depressive-like behaviors and regulates gut microbiome in a mouse model of depression

Affiliations

Electroacupuncture intervention alleviates depressive-like behaviors and regulates gut microbiome in a mouse model of depression

Jia-Quan Wei et al. Heliyon. .

Abstract

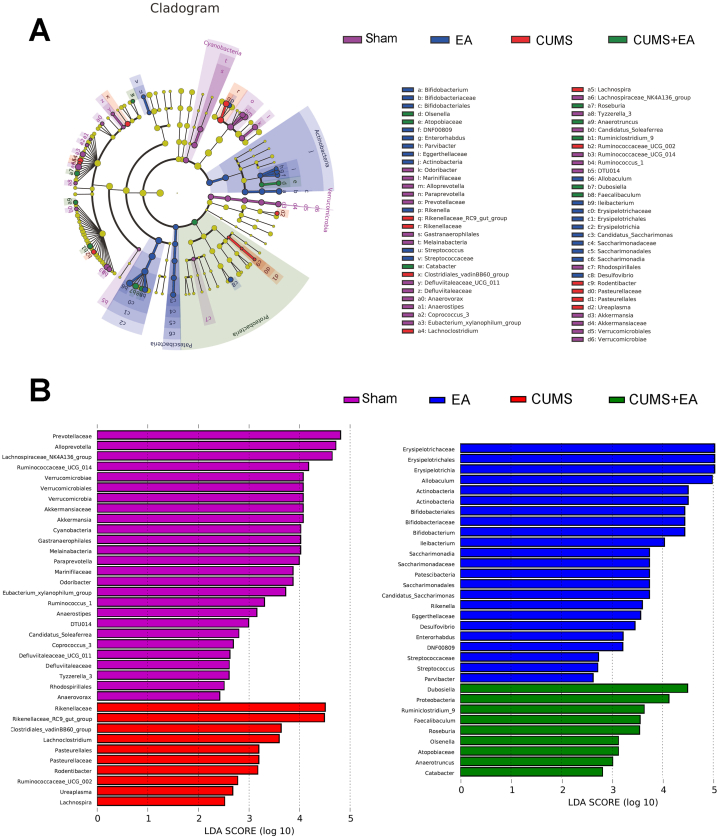
Electroacupuncture (EA) is a neuroregulatory therapy for depression. Nonetheless, the effects of EA on the gut microbiome in mice models of depression are not well established. Here, using a chronic unpredictable mild stress (CUMS) model in mice, we evaluated the antidepressant effects of EA and changes in gut microbiota with behavioral tests and 16S rRNA gene sequencing. The results found that EA increased the time spent in the center area of the open-field test and the percentage of sucrose preference and reduced the immobility time in the tail suspension test in CUMS-treated mice. Furthermore, the genus Lachnoclostridium, Ruminococcaceae_UCG-002 and Rikenellaceae_RC9_gut_group were enriched in the CUMS group, which was positively correlated with depressive-like behaviors. Whereas phylum Actinobacteria and genus Allobaculum, Bifidobacterium, Dubosiella, Rikenella and Ileibacterium were enriched in the EA and CUMS + EA groups, all of which were negatively correlated with depressive-like behaviors. This study characterizes gut microbiota under EA treatment and provides new insights into the association of anti-depressive-like effects of EA and gut microbiota.

Keywords: Chronic unpredictable mild stress; Depression; Electroacupuncture; Gut microbiota.


Conflict of interest statement

The authors declare the following financial interests/personal relationships which may be considered as potential competing interests:Fen Xue reports financial support was provided by 10.13039/501100001809National Natural Science Foundation of China. If there are other authors, they declare that they have no known competing financial interests or personal relationships that could have appeared to influence the work reported in this paper.

Figures

Fig. 1
Fig. 1
EA ameliorates depressive-like behaviours in CUMS-treated mice. (A) Schematic diagram of CUMS exposure. (B) Representative open field movement traces. (C) The total distance traveled in the OFT. (D) Time spent in the center of the OFT. (E) Percentages of sucrose consumption in the SPT. (F) Immobility in the TST. The data are presented as means ± SEM (n = 10 mice/group). The circle represents one value from individual mice (C–F). P-values were determined by one-way analysis of variance with the Bonferroni post-hoc test to compare the means of different groups.
Fig. 2
Fig. 2
Comparison of α and β diversity analysis between each group. (A–D) α diversity including the (A) Ace, (B) Chao, (C) Shannon and (D) Simpson index. (E–G) A clear separation among each group by principal co-ordinate analysis (PCoA) based on bray-curtis (E), weighted UniFrac (F) and unweighted UniFrac (G) distance index on OTU level. The circle represents one value from individual mice.
Fig. 3
Fig. 3
Taxonomic cladogram generated based on LEfSe and LDA scores among Sham, EA, CUMS, and CUMS + EA groups. (A) Bacterial taxa enriched in the Sham (purple dots), EA (blue dots), CUMS (red dots), and CUMS + EA group (green dots). (B) LDA scores indicate taxa enriched in the Sham (purple), EA (blue), CUMS (red), and CUMS + EA group (green), respectively. (For interpretation of the references to color in this figure legend, the reader is referred to the Web version of this article.)
Fig. 4
Fig. 4
Taxonomic cladogram and LDA scores between the Sham and EA group. (A) Bacterial taxa enriched in the EA group (red dots) and Sham (green dots). (B) LDA scores indicated taxa enriched in the Sham or EA group, with a positive LDA score (green) and negative LDA score (red), respectively. (For interpretation of the references to color in this figure legend, the reader is referred to the Web version of this article.)
Fig. 5
Fig. 5
Taxonomic cladogram and LDA scores between the CUMS and CUMS + EA groups. (A) Bacterial taxa enriched in the CUMS + EA (green dots) and CUMS group (red dots). (B) LDA scores indicated taxa enriched in the CUMS + EA or CUMS group, with a positive LDA score (green) and negative LDA score (red), respectively. (For interpretation of the references to color in this figure legend, the reader is referred to the Web version of this article.)
Fig. 6
Fig. 6
The network of OTUs is differentially enriched in the four groups. Nodes indicate OTUs enriched in the Sham (purple), EA (blue), CUMS (red), and CUMS + EA group (green), and node sizes reflect the mean abundance of significant OTUs. The width of the line represents the absolute value of the correlation coefficient, and only the line with the absolute value of the correlation coefficient greater than 0.7 is shown. The color of the line represents positive and negative correlation: pink is a positive correlation and gray is a negative correlation. (For interpretation of the references to color in this figure legend, the reader is referred to the Web version of this article.)
Fig. 7
Fig. 7
Associations of behavioral parameters and gut microbiota. The heat map shows the correlation coefficients between depressive-like behaviors and bacterial taxa at the genus level. Blue and red squares indicate negative and positive correlations, and the intensities of the colors are proportional to the degree of correlation. *P < 0.05; **P < 0.01; ***P < 0.001. (For interpretation of the references to color in this figure legend, the reader is referred to the Web version of this article.)

Similar articles

Cited by

References

    1. Greenberg P.E., Fournier A.A., Sisitsky T., Pike C.T., Kessler R.C. The economic burden of adults with major depressive disorder in the United States (2005 and 2010) J. Clin. Psychiatry. 2015;76(2):155–162. doi: 10.4088/JCP.14m09298. - DOI - PubMed
    1. Okereke O.I., Reynolds C.F., 3rd, Mischoulon D., Chang G., Vyas C.M., Cook N.R., Weinberg A., Bubes V., Copeland T., Friedenberg G., Lee I.M., Buring J.E., Manson J.E. Effect of long-term Vitamin D3 Supplementation vs Placebo on risk of depression or clinically relevant depressive symptoms and on change in Mood scores: a randomized clinical trial. JAMA. 2020;324(5):471–480. doi: 10.1001/jama.2020.10224. - DOI - PMC - PubMed
    1. Malhi G.S., Mann J.J. Depression. Lancet. 2018;392(10161):2299–2312. doi: 10.1016/S0140-6736(18)31948-2. - DOI - PubMed
    1. Ribeiro J.D., Huang X., Fox K.R., Franklin J.C. Depression and hopelessness as risk factors for suicide ideation, attempts and death: meta-analysis of longitudinal studies. Br. J. Psychiatry. 2018;212(5):279–286. doi: 10.1192/bjp.2018.27. - DOI - PubMed
    1. Vuorilehto M., Valtonen H.M., Melartin T., Sokero P., Suominen K., Isometsa E.T. Method of assessment determines prevalence of suicidal ideation among patients with depression. Eur. Psychiatr. 2014;29(6):338–344. doi: 10.1016/j.eurpsy.2013.08.005. - DOI - PubMed

LinkOut - more resources