. 2024 Apr 18:15:1248276.
doi: 10.3389/fphys.2024.1248276. eCollection 2024.

Proteomic and phosphoproteomic characterization of cardiovascular tissues after long term exposure to simulated space radiation

Affiliations

Proteomic and phosphoproteomic characterization of cardiovascular tissues after long term exposure to simulated space radiation

Yared H Kidane et al. Front Physiol. .

Abstract

Introduction: It may take decades to develop cardiovascular dysfunction following exposure to high doses of ionizing radiation from medical therapy or from nuclear accidents. Since astronauts may be exposed continually to a complex space radiation environment unlike that experienced on Earth, it is unresolved whether there is a risk to cardiovascular health during long-term space exploration missions. Previously, we have described that mice exposed to a single dose of simplified Galactic Cosmic Ray (GCR5-ion) develop cardiovascular dysfunction by 12 months post-radiation. Methods: To investigate the biological basis of this dysfunction, here we performed a quantitative mass spectrometry-based proteomics analysis of heart tissue (proteome and phosphoproteome) and plasma (proteome only) from these mice at 8 months post-radiation. Results: Differentially expressed proteins (DEPs) for irradiated versus sham irradiated samples (fold-change ≥1.2 and an adjusted p-value of ≤0.05) were identified for each proteomics data set. For the heart proteome, there were 87 significant DEPs (11 upregulated and 76 downregulated); for the heart phosphoproteome, there were 60 significant differentially phosphorylated peptides (17 upregulated and 43 downregulated); and for the plasma proteome, there was only one upregulated protein. A Gene Set Enrichment Analysis (GSEA) technique that assesses canonical pathways from BIOCARTA, KEGG, PID, REACTOME, and WikiPathways revealed significant perturbation in pathways in each data set. For the heart proteome, 166 pathways were significantly altered (36 upregulated and 130 downregulated); for the plasma proteome, there were 73 pathways significantly altered (25 upregulated and 48 downregulated); and for the phosphoproteome, there were 223 pathways significantly affected at 0.1 adjusted p-value cutoff. Pathways related to inflammation were the most highly perturbed in the heart and plasma. In line with sustained inflammation, neutrophil extracellular traps (NETs) were demonstrated to be increased in GCR5-ion irradiated hearts at 12-month post irradiation. NETs play a fundamental role in combating bacterial pathogens, modulating inflammatory responses, inflicting damage on healthy tissues, and escalating vascular thrombosis. Discussion: These findings suggest that a single exposure to GCR5-ion results in long-lasting changes in the proteome and that these proteomic changes can potentiate acute and chronic health issues for astronauts, such as what we have previously described with late cardiac dysfunction in these mice.

Keywords: cardiovascular degeneration; cardiovascular disease; galactic cosmic ray; ionizing radiation; mass spectrometry; phosphoproteomics; proteomics; space radiation.


Conflict of interest statement

The authors declare that the research was conducted in the absence of any commercial or financial relationships that could be construed as a potential conflict of interest.

Figures

FIGURE 1
FIGURE 1
Overview of sample preparation, processing, and bioinformatics analysis pipeline.
FIGURE 2
FIGURE 2
Visualization of proteome and phosphoproteome data sets Principal component analysis (PCA) plots of heart proteome (A); plasma proteome (B); and phosphoproteome (C). Heatmap clustering plot of heart proteome (D); plasma proteome (E); and phosphoproteome (F). Clustering of top 20 proteins in each data set. Proteins are selected based on fold-change difference between GCR5-ion vs. control samples.
FIGURE 3
FIGURE 3
Differential expression analysis of proteins in proteome and phosphoproteome data sets Volcano plot representing the overall perturbation significance of proteins based on p-values and fold-change criteria for heart proteome (A); plasma proteomc (B); and phosphoproteome (C). Each dot represents one protein. Log2FC indicates the mean expression level for each protein. Black dots represent non-significant proteins; green dots represent proteins that have a FC ≥ 1.2; blue dots represent proteins that have a p-value ≤0.05; and orange dots represent those proteins with a p-value of ≤0.05 and FC ≥ 1.2. Bar graph showing the number of significantly up- and downregulated proteins for heart proteome (D); plasma proteome (E); and phosphoproteomc (F).
FIGURE 4
FIGURE 4
Pathway enrichment maps for proteome data sets. Pathway interaction plots for upregulated [(A); red] and downregulated [(C); blue] pathways in heart proteome data. Pathway interaction plots for upregulated [(B); red] and downregulated [(D); blue] pathways in plasma proteome data. Each rectangle represents a pathway. The size of the rectangle is proportional to the number of proteins annotated with the pathway. Two interacting pathways are connected by a line. The thickness of the line is proportional to the number of proteins shared between interacting pathways. Pathways are annotated with the source database as Biocarta (BIC), Kyoto Encyclopedia of Genes and Genomes (KEGG), WikiPathways (WP), Reactome (RECT), and the Pathway Interaction Database (PID).
FIGURE 5
FIGURE 5
Enrichment maps for inflammation-related pathways in heart and plasma proteome data sets (A) Lollipop plot showing top ten significantly modulated inflammation pathways in the heart and (C) plasma proteome. (B) Pathway enrichment map showing inflammation pathways that are perturbed in common in the heart and plasma proteome data sets. Each rectangle represents a pathway. The rectangle is split in two. The upper portion of the rectangle represents the heart data and lower half represents the plasma data. The size of the rectangle is proportional to the number of proteins annotated with the pathway. Two interacting pathways are connected by a line. The thickness of the line is proportional to the number of proteins shared between interacting pathways. Pathways are annotated with the source database as Biocarta (BIC), Kyoto Encyclopedia of Genes and Genomes (KEGG), WikiPathways (WP), Reactome (RECT), and the Pathway Interaction Database (PID).
FIGURE 6
FIGURE 6
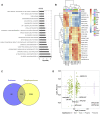
Pathway enrichment and kinome maps for phosphoproteome data (A) Significantly perturbed pathways in GCR irradiated samples compared to control. Top 20 over-represented pathways from the Kyoto Encyclopedia of Genes and Genomes (KEGG). (B) Heatmap of kinase-substrate interaction (kinome map). (C) Venn diagram showing overlap of differentially expressed proteins among heart proteome and phosphoproteome. (D) Plot of log fold change (FC) of proteome versus log FC of phosphoproteome for 121 overlapping proteins in the two data sets.
FIGURE 7
FIGURE 7
The presence of neutrophil extracellular traps (NETs) within the myocardial tissue was observed in a mouse model exposed to GCR5-ion. Immunofluorescence staining was performed to assess the presence of NETs in the hearts of mice exposed to 150 mGy of GCR5-ion at 12 months post radiation, as compared to sham irradiated control mice hearts. (A) A robust and extensive distribution of NETs was observed in the myocardium of mice exposed to GCR5-ion (upper panel), while no NETs were detected in the control mice hearts (lower panel). (B) The representative images of NETs structure in the hearts of mice exposed to GCR were obtained. The colocalization of extracellular DNA structure (DAPI), MPO, and elastase further confirmed the presence of NET structures (B). The scale bar represents 50 μm.

References

    1. Amino M., Yoshioka K., Fujibayashi D., Hashida T., Furusawa Y., Zareba W., et al. (2010). Year-long upregulation of connexin43 in rabbit hearts by heavy ion irradiation. Am. J. Physiol. Heart Circ. Physiol. 298 (3), H1014–H1021. Epub 2010 Jan 8. PMID: 20061548. 10.1152/ajpheart.00160.2009 - DOI - PubMed
    1. Auñón-Chancellor S. M., Pattarini J. M., Moll S., Sargsyan A. (2020). Venous thrombosis during spaceflight. N. Engl. J. Med. 382 (1), 89–90. 10.1056/NEJMc1905875 - DOI - PubMed
    1. Azimzadeh O., Moertl S., Ramadan R., Baselet B., Laiakis E. C., Sebastian S., et al. (2022). Application of radiation omics in the development of adverse outcome pathway networks: an example of radiation induced cardiovascular disease. Int. J. Radiat. Biol. 98 (12), 1722–1751. 10.1080/09553002.2022.2110325 - DOI - PubMed
    1. Bai B., Yang W., Fu Y., Foon H. L., Tay W. T., Yang K., et al. (2019). Seipin knockout mice develop heart failure with preserved ejection fraction. JACC Basic Transl. Sci. 4 (8), 924–937. PMID: 31909301; PMCID: PMC6939002. 10.1016/j.jacbts.2019.07.008 - DOI - PMC - PubMed
    1. Beghi S., Furmanik M., Jaminon A., Veltrop R., Rapp N., Wichapong K., et al. (2022). Calcium signalling in heart and vessels: role of calmodulin and downstream calmodulin-dependent protein kinases. Int. J. Mol. Sci. 23 (24), 16139. PMID: 36555778; PMCID: PMC9783221. 10.3390/ijms232416139 - DOI - PMC - PubMed

LinkOut - more resources