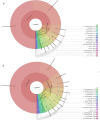
Bacterial community profiles within the water samples of leptospirosis outbreak areas
- PMID: 38699181
- PMCID: PMC11064854
- DOI: 10.7717/peerj.17096
Bacterial community profiles within the water samples of leptospirosis outbreak areas
Abstract
Background: Leptospirosis is a water-related zoonotic disease. The disease is primarily transmitted from animals to humans through pathogenic Leptospira bacteria in contaminated water and soil. Rivers have a critical role in Leptospira transmissions, while co-infection potentials with other waterborne bacteria might increase the severity and death risk of the disease.
Methods: The water samples evaluated in this study were collected from four recreational forest rivers, Sungai Congkak, Sungai Lopo, Hulu Perdik, and Gunung Nuang. The samples were subjected to next-generation sequencing (NGS) for the 16S rRNA and in-depth metagenomic analysis of the bacterial communities.
Results: The water samples recorded various bacterial diversity. The samples from the Hulu Perdik and Sungai Lopo downstream sampling sites had a more significant diversity, followed by Sungai Congkak. Conversely, the upstream samples from Gunung Nuang exhibited the lowest bacterial diversity. Proteobacteria, Firmicutes, and Acidobacteria were the dominant phyla detected in downstream areas. Potential pathogenic bacteria belonging to the genera Burkholderiales and Serratia were also identified, raising concerns about co-infection possibilities. Nevertheless, Leptospira pathogenic bacteria were absent from all sites, which is attributable to its limited persistence. The bacteria might also be washed to other locations, contributing to the reduced environmental bacterial load.
Conclusion: The present study established the presence of pathogenic bacteria in the river ecosystems assessed. The findings offer valuable insights for designing strategies for preventing pathogenic bacteria environmental contamination and managing leptospirosis co-infections with other human diseases. Furthermore, closely monitoring water sample compositions with diverse approaches, including sentinel programs, wastewater-based epidemiology, and clinical surveillance, enables disease transmission and outbreak early detections. The data also provides valuable information for suitable treatments and long-term strategies for combating infectious diseases.
Keywords: Bacterial community; Leptospira; Leptospirosis; Next generation sequencing; Pathogenic; Public health; Water recreational.
© 2024 Md Lasim et al.
Conflict of interest statement
The authors declare that they have no competing interests.
Figures


Similar articles
-
Leptospira in river and soil in a highly endemic area of Ecuador.BMC Microbiol. 2021 Jan 7;21(1):17. doi: 10.1186/s12866-020-02069-y. BMC Microbiol. 2021. PMID: 33413126 Free PMC article.
-
An outbreak of leptospirosis among reserve military recruits, Hulu Perdik, Malaysia.Eur J Clin Microbiol Infect Dis. 2019 Mar;38(3):523-528. doi: 10.1007/s10096-018-03450-6. Epub 2019 Jan 24. Eur J Clin Microbiol Infect Dis. 2019. PMID: 30680558
-
Quantification of pathogenic Leptospira in the soils of a Brazilian urban slum.PLoS Negl Trop Dis. 2018 Apr 6;12(4):e0006415. doi: 10.1371/journal.pntd.0006415. eCollection 2018 Apr. PLoS Negl Trop Dis. 2018. PMID: 29624576 Free PMC article.
-
Critical Knowledge Gaps in Our Understanding of Environmental Cycling and Transmission of Leptospira spp.Appl Environ Microbiol. 2017 Sep 15;83(19):e01190-17. doi: 10.1128/AEM.01190-17. Print 2017 Oct 1. Appl Environ Microbiol. 2017. PMID: 28754706 Free PMC article. Review.
-
[Leptospirosis now-the centennial of the discovery of Weil's disease pathogen].Nihon Saikingaku Zasshi. 2014;69(4):589-600. doi: 10.3412/jsb.69.589. Nihon Saikingaku Zasshi. 2014. PMID: 25447984 Review. Japanese.
References
-
- Anderson MJ, Crist TO, Chase JM, Vellend M, Inouye BD, Freestone AL, Sanders NJ, Cornell HV, Comita LS, Davies KF, Harrison SP, Kraft NJB, Stegan JC, Swenson NG. Navigating the multiple meanings of β diversity: a roadmap for the predicting ecologist. Ecologist Letter. 2011;14:19–28. doi: 10.1111/j.1461-0248.2010.01552.x. - DOI - PubMed
Publication types
MeSH terms
Substances
LinkOut - more resources
Full Text Sources

