

Approximate inference for longitudinal mechanistic HIV contact network
- PMID: 38699247
- PMCID: PMC11060975
- DOI: 10.1007/s41109-024-00616-4
Approximate inference for longitudinal mechanistic HIV contact network
Abstract
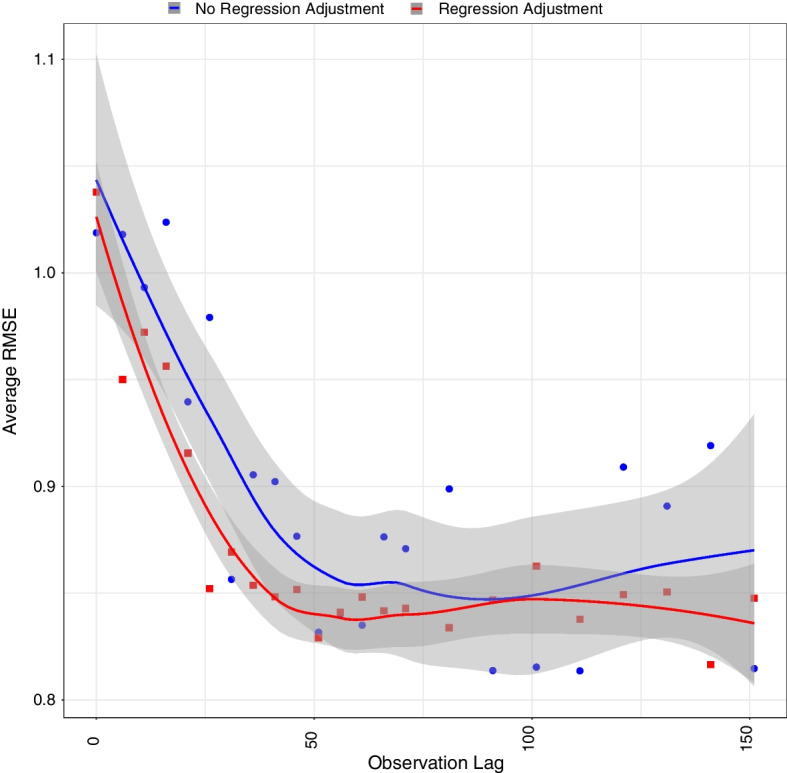
Network models are increasingly used to study infectious disease spread. Exponential Random Graph models have a history in this area, with scalable inference methods now available. An alternative approach uses mechanistic network models. Mechanistic network models directly capture individual behaviors, making them suitable for studying sexually transmitted diseases. Combining mechanistic models with Approximate Bayesian Computation allows flexible modeling using domain-specific interaction rules among agents, avoiding network model oversimplifications. These models are ideal for longitudinal settings as they explicitly incorporate network evolution over time. We implemented a discrete-time version of a previously published continuous-time model of evolving contact networks for men who have sex with men and proposed an ABC-based approximate inference scheme for it. As expected, we found that a two-wave longitudinal study design improves the accuracy of inference compared to a cross-sectional design. However, the gains in precision in collecting data twice, up to 18%, depend on the spacing of the two waves and are sensitive to the choice of summary statistics. In addition to methodological developments, our results inform the design of future longitudinal network studies in sexually transmitted diseases, specifically in terms of what data to collect from participants and when to do so.
Keywords: ABC; Agent based modeling; HIV; Inference; MSM; Mechanistic model; Networks.
© The Author(s) 2024.
Conflict of interest statement
Competing interestsThe authors have no Conflict of interest to report.
Figures


Similar articles
-
Scalable Approximate Bayesian Computation for Growing Network Models via Extrapolated and Sampled Summaries.Bayesian Anal. 2022 Mar;17(1):165-192. doi: 10.1214/20-ba1248. Epub 2020 Dec 8. Bayesian Anal. 2022. PMID: 36213769 Free PMC article.
-
Accounting for contact network uncertainty in epidemic inferences with Approximate Bayesian Computation.Appl Netw Sci. 2025;10(1):13. doi: 10.1007/s41109-025-00694-y. Epub 2025 Apr 22. Appl Netw Sci. 2025. PMID: 40276656 Free PMC article.
-
Flexible Bayesian inference on partially observed epidemics.J Complex Netw. 2024 Mar 25;12(2):cnae017. doi: 10.1093/comnet/cnae017. eCollection 2024 Apr. J Complex Netw. 2024. PMID: 38533184 Free PMC article.
-
HIV seroprevalence, risk behaviors, and cognitive factors among Asian and Pacific Islander American men who have sex with men: a summary and critique of empirical studies and methodological issues.AIDS Educ Prev. 1998 Jun;10(3 Suppl):31-47. AIDS Educ Prev. 1998. PMID: 9642429 Review.
-
Probabilistic Models with Deep Neural Networks.Entropy (Basel). 2021 Jan 18;23(1):117. doi: 10.3390/e23010117. Entropy (Basel). 2021. PMID: 33477544 Free PMC article. Review.
References
-
- Adamic LA, Huberman BA. Power-law distribution of the world wide web. Science. 2000;287(5461):2115–2115. doi: 10.1126/science.287.5461.2115a. - DOI
-
- Albert R, Barabási A-L. Statistical mechanics of complex networks. Rev Mod Phys. 2002;74(1):47. doi: 10.1103/RevModPhys.74.47. - DOI
-
- Aroke H, Katenka N, Kogut S, Buchanan A (2022) Network-based analysis of prescription opioids dispensing using exponential random graph models (ERGMs). In: Complex networks & their applications X: vol 2, proceedings of the tenth international conference on complex networks and their applications complex networks 2021 10, pp 716–730. Springer - PMC - PubMed
-
- Beaumont MA. Approximate Bayesian computation. Ann Rev Stat Appl. 2019;6:379–403. doi: 10.1146/annurev-statistics-030718-105212. - DOI
LinkOut - more resources
Full Text Sources
Research Materials