[Preprint]. 2024 Apr 15:rs.3.rs-4078561.
doi: 10.21203/rs.3.rs-4078561/v1.

Longitudinal cervicovaginal microbiome and virome alterations during ART and discordant shedding in women living with HIV

Affiliations

Longitudinal cervicovaginal microbiome and virome alterations during ART and discordant shedding in women living with HIV

Emily A Kaelin et al. Res Sq. .

Abstract

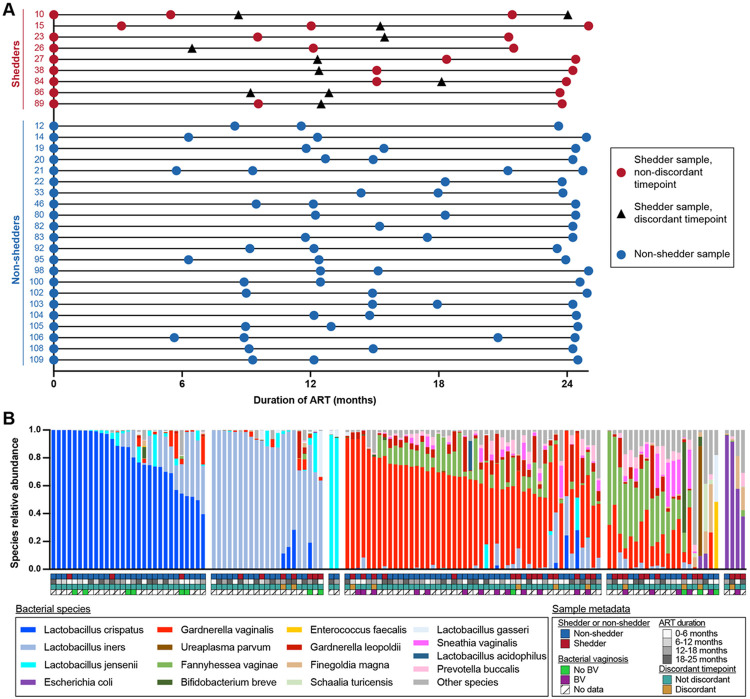
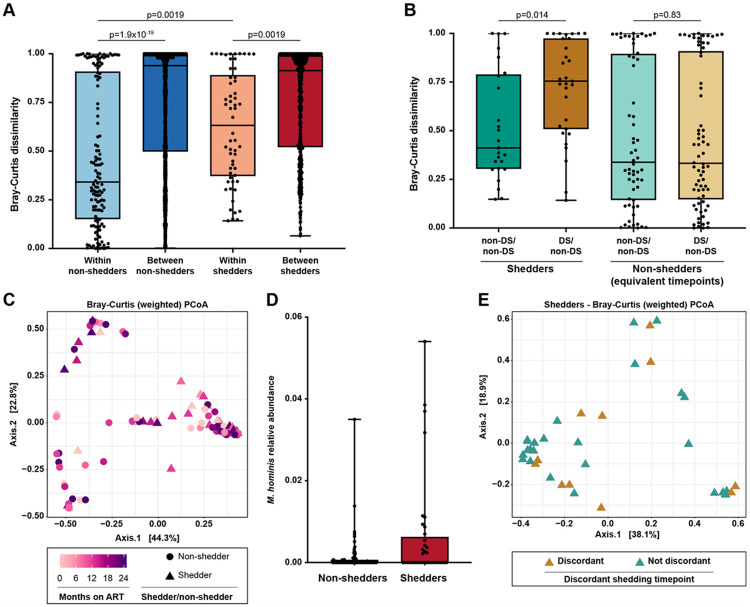
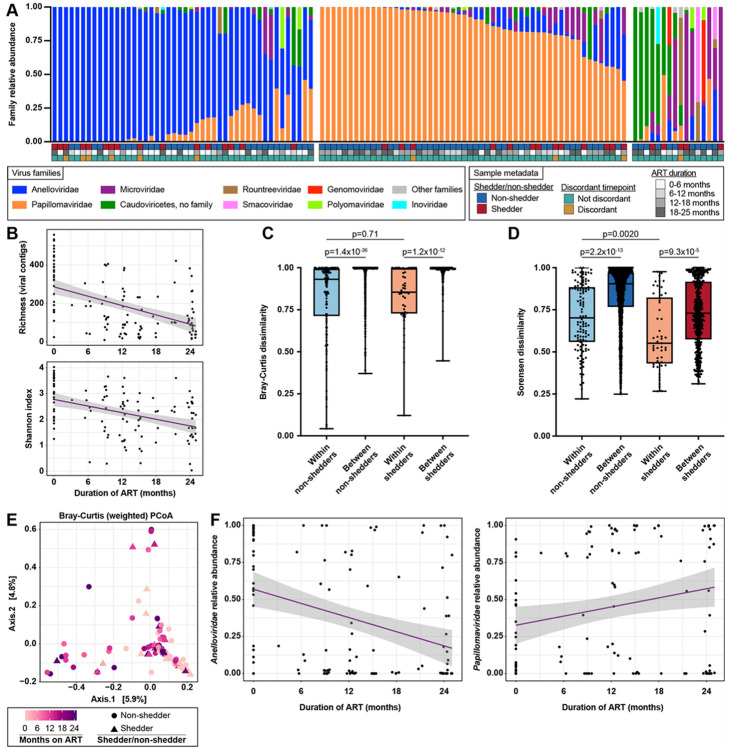
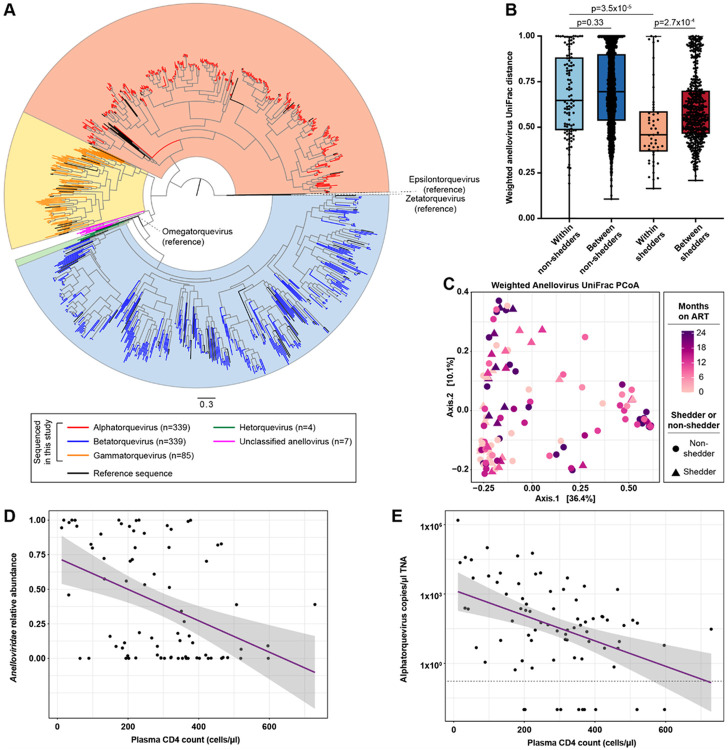
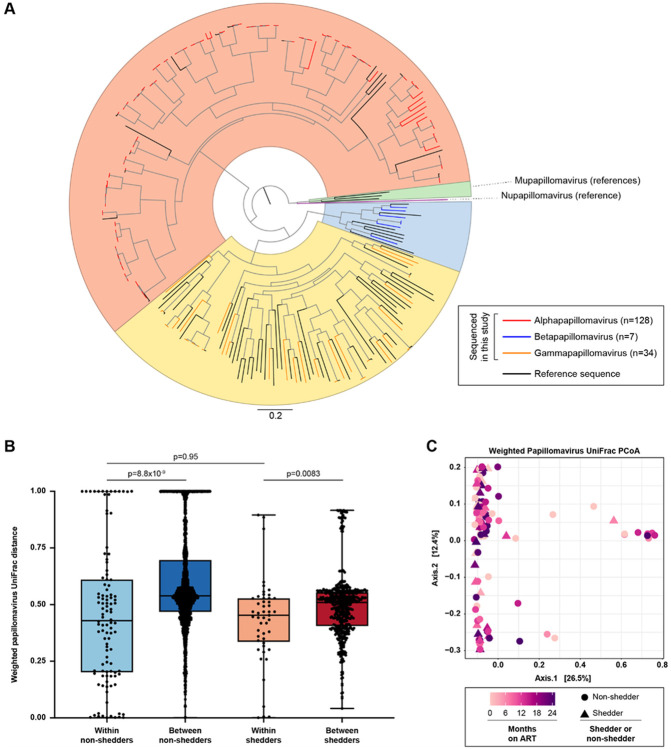
Despite successful suppression of plasma HIV replication by antiretroviral therapy (ART), some women living with HIV (WLHIV) can still experience genital HIV shedding (discordant shedding). Female genital tract (FGT) microbiome and virome dynamics during long-term ART in WLHIV are poorly understood but might contribute to discordant HIV shedding, as the microbiome and virome are known to influence FGT health. To understand FGT microbial communities over time during ART usage and discordant shedding, we characterized the microbiome and virome in 125 cervicovaginal specimens collected over two years in 31 WLHIV in Lima, Peru. Intrapersonal bacterial microbiome variation was higher in HIV shedders compared to non-shedders. Cervicovaginal virome composition changed over time, particularly in non-shedders. Specifically, anellovirus relative abundance was inversely associated with ART duration and CD4 counts. Our results suggest that discordant HIV shedding is associated with FGT microbiome instability, and immune recovery during ART influences FGT virome composition.


Figures

Figure 1
Figure 1. Cohort characteristics.
A. Timeline of samples analyzed from each individual. Non-shedder samples are shown as blue circles, shedder samples from timepoints without discordant shedding are shown as red circles, and shedder samples from discordant shedding timepoints are shown as black triangles. B. Samples grouped by microbiome community cluster. Samples are shown as vertical bars colored by species relative abundance. Metadata is shown as rows of colored squares beneath the samples. By multinomial logistic regression, community clusters were not associated with ART duration or shedder/non-shedder status, except for cluster 3 which was associated with non-shedder status (p-values in Supplementary Table 2). Cluster 3 consists of two samples from the same non-shedder individual.
Figure 2
Figure 2. Bacterial microbiome in shedders and non-shedders.
A. Bacterial species Bray-Curtis dissimilarity between pairs of samples from the same individual (within-individual comparisons) or from different individuals (between-individual comparisons). Statistical significance was assessed using the Mann-Whitney test and p-values were adjusted for multiple comparisons using the Benjamini-Hochberg method. B. Bacterial species Bray-Curtis dissimilarity between pairs of non-discordant samples within the same shedder individual (non-DS/non-DS), or sample pairs where one sample was from a discordant shedding timepoint and the other was from a non-discordant timepoint within the same individual (DS/non-DS). Equivalent timepoints from non-shedders serve as a control. Statistical significance was assessed using the Mann-Whitney test and p-values were adjusted for multiple comparisons using the Benjamini-Hochberg method. C. Principal coordinates analysis (PCoA) of shedder and non-shedder samples, using Bray Curtis dissimilarity calculated from bacterial species relative abundance. Samples are colored by duration of ART. Non-shedder samples are shown as circles and shedder samples are shown as triangles. Statistical significance was determined by PERMANOVA, p=0.33 for ART duration and p=0.34 for shedder/non-shedder status. D. Mycoplasma hominis relative abundance in non-shedders and shedders. Box bounds show the interquartile range and whiskers show the minimum and maximum. Statistical significance was determined by MaAsLin2, q=0.048. E. Principal coordinates analysis (PCoA) of shedder samples, using Bray-Curtis dissimilarity calculated from bacterial species relative abundance. Discordant shedding timepoints are colored brown, and non-discordant samples are colored green. Statistical significance was determined by PERMANOVA, p=0.85.
Figure 3
Figure 3. Virome over time in shedders and non-shedders.
A. Samples grouped by virome community cluster. Samples are shown as vertical bars colored by family relative abundance. Metadata is shown as rows of colored squares beneath the samples. B. Virome alpha diversity (viral contig richness and Shannon index) by duration of ART. Shedder and non-shedder samples are plotted together. The linear regression line is shown in purple and the 95% confidence band is shown in gray. Statistical significance was assessed by linear mixed modeling (LME), p=7.7x10⁻¹⁰ for richness and p= p=8.3x10⁻⁸ for Shannon index. C. Viral Bray-Curtis dissimilarity (weighted) between pairs of samples from the same individual (within-individual comparisons) or from different individuals (between-individual comparisons). Statistical significance was assessed using the Mann-Whitney test and p-values were adjusted for multiple comparisons using the Benjamini-Hochberg method. D. Viral Sorensen dissimilarity (unweighted) between pairs of samples from the same individual (within-individual comparisons) or from different individuals (between-individual comparisons). Statistical significance was assessed using the Mann-Whitney test and p-values were adjusted for multiple comparisons using the Benjamini-Hochberg method. E. Principal coordinates analysis (PCoA) of shedder and non-shedder samples, using Bray Curtis dissimilarity calculated from virus contig relative abundance. Samples are colored by duration of ART. Non-shedder samples are shown as circles and shedder samples are shown as triangles. Statistical significance was determined by PERMANOVA, p=0.001 for ART duration and p=0.016 for shedder/non-shedder status. F. Anelloviridae relative abundance (left) and Papillomaviridae relative abundance (right) by ART duration. Shedder and non-shedder samples are plotted together. Linear regression lines are shown in purple and 95% confidence bands are shown in gray. Statistical significance was determined using MaAsLin2, q=8.8x10⁻⁵ for Anelloviridae and q=0.037 for Papillomaviridae.
Figure 4
Figure 4. Anellovirus diversity over time in shedders and non-shedders.
A. Anellovirus ORF1 amino acid phylogeny. Colored tips (red, blue, orange, green, and pink) represent sequences generated in this study. Reference sequences are shown in black. B. Weighted anellovirus UniFrac distance between pairs of samples from the same individual (within-individual comparisons) or from different individuals (between-individual comparisons). Statistical significance was assessed using the Mann-Whitney test and p-values were adjusted for multiple comparisons using the Benjamini-Hochberg method. C. Principal coordinates analysis (PCoA) of shedder and non-shedder samples, using weighted anellovirus UniFrac distance. Samples are colored by duration of ART. Non-shedder samples are shown as circles and shedder samples are shown as triangles. Statistical significance was assessed by PERMANOVA, p=0.005 for ART duration and p=0.81 for shedder/non-shedder status. D. Cervicovaginal Anelloviridae NGS relative abundance (top) and alphatorquevirus qPCR copy numbers (bottom) versus plasma CD4 counts. Copy numbers are expressed in copies/μl of extracted total nucleic acid (TNA). Shedder and non-shedder samples are plotted together. Linear regression lines are shown in purple and 95% confidence bands are shown in gray. The dotted horizontal line separates samples with detectable and undetectable alphatorquevirus by qPCR. Statistical significance was assessed by linear mixed modeling (LME), p=2.1x10⁻⁴ for Anelloviridae relative abundance and p=0.04 for alphatorquevirus copy numbers. To facilitate visualization on a log scale, a pseudocount of 0.01 copies/μl was added to all alphatorquevirus qPCR copy numbers, but LME analyses were based on the raw copy numbers.
Figure 5
Figure 5. Papillomavirus diversity over time in shedders and non-shedders.
A. Papillomavirus E1-E2-L2-L1 nucleotide phylogeny. Colored tips (red, blue, and orange) represent sequences generated in this study. Reference sequences are shown in black. B. Weighted papillomavirus UniFrac distance between pairs of samples from the same individual (within-individual comparisons) or from different individuals (between-individual comparisons). Statistical significance was assessed using the Mann-Whitney test and p-values were adjusted for multiple comparisons using the Benjamini-Hochberg method. C. Principal coordinates analysis (PCoA) of shedder and non-shedder samples, using weighted UniFrac distance calculated from papillomavirus phylogeny and relative abundance. Samples are colored by duration of ART. Non-shedder samples are shown as circles and shedder samples are shown as triangles. Statistical significance was determined by PERMANOVA, p=0.33 for ART duration and p=0.28 for shedder/non-shedder status.

Similar articles

References

    1. Ghosn J., Taiwo B., Seedat S., Autran B. & Katlama C. HIV. Lancet 392, 685–697, doi:10.1016/s0140-6736(18)31311-4 (2018). - DOI - PubMed
    1. Menéndez-Arias L. & Delgado R. Update and latest advances in antiretroviral therapy. Trends Pharmacol Sci 43, 16–29, doi:10.1016/j.tips.2021.10.004 (2022). - DOI - PubMed
    1. Joint United Nations Programme on HIV and AIDS. HIV estimates with uncertainty bounds 1990-Present.
    1. Bull M. et al. Genital Shedding of Human Immunodeficiency Virus Type-1 (HIV) When Antiretroviral Therapy Suppresses HIV Replication in the Plasma. J Infect Dis 222, 777–786, doi:10.1093/infdis/jiaa169 (2020). - DOI - PMC - PubMed
    1. Homans J. et al. Permissive and protective factors associated with presence, level, and longitudinal pattern of cervicovaginal HIV shedding. J Acquir Immune Defic Syndr 60, 99–110, doi:10.1097/QAI.0b013e31824aeaaa (2012). - DOI - PMC - PubMed

Publication types