[Preprint]. 2024 Apr 19:rs.3.rs-4139933.
doi: 10.21203/rs.3.rs-4139933/v1.

The peripheral epigenome predicts white matter volume contingent on developmental stage: An ECHO study

Affiliations

The peripheral epigenome predicts white matter volume contingent on developmental stage: An ECHO study

Sophie Spencer et al. Res Sq. .

Abstract

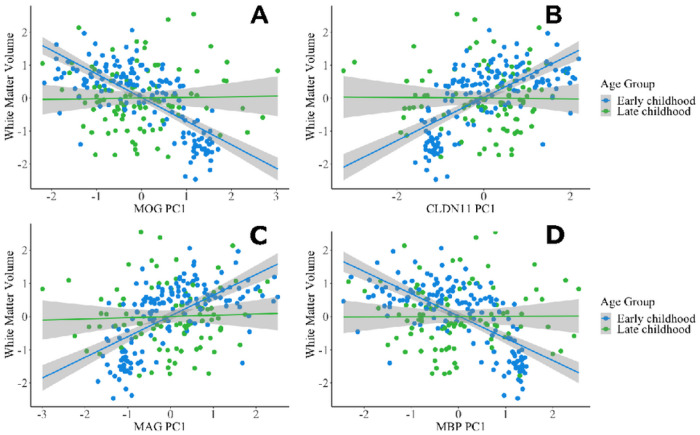
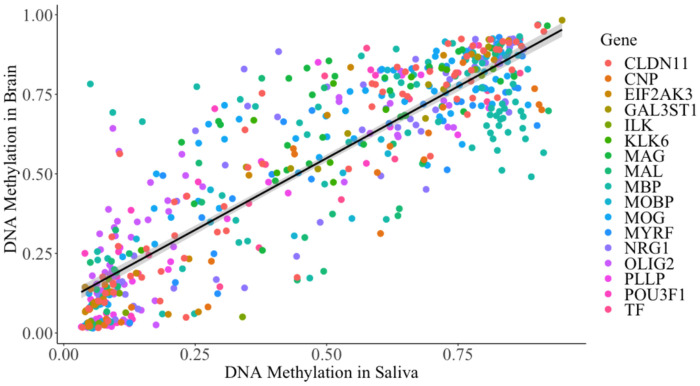
Epigenetic processes, including DNA methylation, are emerging as key areas of interest for their potential roles as biomarkers and contributors to the risk of neurodevelopmental, psychiatric, and other brain-based disorders. Despite this growing focus, there remains a notable gap in our understanding of how DNA methylation correlates with individual variations in brain function and structure. Additionally, the dynamics of these relationships during developmental periods, which are critical windows during which many disorders first appear, are still largely unexplored. The current study extends the field by examining if peripheral DNA methylation of myelination-related genes predicts white matter volume in a healthy pediatric population [N = 250; females = 113; age range 2 months-14 years; Mage = 5.14, SDage = 3.60]. We assessed if DNA methylation of 17 myelin-related genes predict white matter volume and if age moderates these relationships. Results highlight low variability in myelin-related epigenetic variance at birth, which rapidly increases non-linearly with age, and that DNA methylation, measured at both the level of a CpG site or gene, is highly predictive of white matter volume, in early childhood but not late childhood. These novel findings propel the field forward by establishing that DNA methylation of myelin-related genes from a peripheral tissue is a predictive marker of white matter volume in children and is influenced by developmental stage. The research underscores the significance of peripheral epigenetic patterns as a proxy for investigating the effects of environmental factors, behaviors, and disorders associated with white matter.


Conflict of interest statement

Additional Declarations: No competing interests reported. Competing interests The authors have no conflict of interest to disclose. Supplementary Files This is a list of supplementary files associated with this preprint. Click to download. • SupplementalInformation.docx

Figures

Figure 1
Figure 1. DNA methylation of myelin-related genes across development
The first principal component of MOG, EIF2AK3, PLLP, and MAL DNA methylation changes quadratically across age in a cross-sectional healthy pediatric cohort. Gray shading represents the standard error of the coefficient estimate in the regression model. These genes were chosen for depiction as they had the largest r2 values MOG (Age β = −0.14, Age2 β = 0.002; p’s < 0.00001), EIF2AK3(Age β = 0.13, Age2 β = −0.001; p’s < 0.00001), PLLP (Age β = 0.13, Age2 β = −0.002; p’s < 0.00001), MAL (Age β = 0.13, Age2 β = −0.0018498; p’s < 0.00001). DNA methylation variance between-individuals is generally low in the first year of life and becomes more variable as age increases.
Figure 2
Figure 2. DNA methylation of myelin-related genes predicts white matter volume in early but not late childhood
Regression models included age as an interaction term. PC1-age interactions significantly predicted total white matter volume. MOG(PC1 β = −1.39; PC1xAge β = 0.10), CLDN11 (PC1 β = 1.44; PC1xAge β = −0.10), MAG (PC1 β = 1.39; PC1xAge β = −0.10), MBP (PC1 β = −1.47; PC1xAge β = 0.10) had the largest interaction effect sizes (all p’s < 0.00001) on total white matter volume. Gray shading represents the standard error of the coefficient estimate in the regression model.
Figure 3
Figure 3. Correlation between salivary DNA methylation and brain DNA methylation
Each data point represents average DNA methylation at CpG sites across either brain or buccal samples and colored by their annotated gene. Gray shading represents the standard error of the coefficient estimate in the regression model. Brain DNA methylation data was extracted from the Allen Brain Atlas Brainspan Average DNA methylation in buccal and brain are significantly correlated (r = 0.882, p < 0.0001).

References

    1. Moore LD, Le T, Fan G. DNA methylation and its basic function. Neuropsychopharmacology. Published online 2013. doi:10.1038/npp.2012.112 - DOI - PMC - PubMed
    1. Zhang J, Chen K, Wang D, Gao F, Zheng Y, Yang M. Editorial: Advances of Neuroimaging and Data Analysis. Front Neurol. 2020;11. Accessed May 17, 2023. 10.3389/fneur.2020.00257 - DOI - PMC - PubMed
    1. Braun PR, Han S, Hing B, et al. Genome-wide DNA methylation comparison between live human brain and peripheral tissues within individuals. Transl Psychiatry. 2019;9(1):1–10. doi:10.1038/s41398-019-0376-y - DOI - PMC - PubMed
    1. Smith AK, Kilaru V, Klengel T, et al. DNA extracted from saliva for methylation studies of psychiatric traits: Evidence tissue specificity and relatedness to brain. Am J Med Genet B Neuropsychiatr Genet. 2015;168(1):36–44. doi:10.1002/ajmg.b.32278 - DOI - PMC - PubMed
    1. Hannon E, Lunnon K, Schalkwyk L, Mill J. Interindividual methylomic variation across blood, cortex, and cerebellum: implications for epigenetic studies of neurological and neuropsychiatric phenotypes. Epigenetics. 2015;10(11):1024–1032. doi:10.1080/15592294.2015.1100786 - DOI - PMC - PubMed

Publication types

LinkOut - more resources