

This is a preprint.
Improved multi-ancestry fine-mapping identifies cis-regulatory variants underlying molecular traits and disease risk
- PMID: 38699369
- PMCID: PMC11065034
- DOI: 10.1101/2024.04.15.24305836
Improved multi-ancestry fine-mapping identifies cis-regulatory variants underlying molecular traits and disease risk
Update in
-
Improved multiancestry fine-mapping identifies cis-regulatory variants underlying molecular traits and disease risk.Nat Genet. 2025 Aug;57(8):1881-1889. doi: 10.1038/s41588-025-02262-7. Epub 2025 Jul 21. Nat Genet. 2025. PMID: 40691406
Abstract
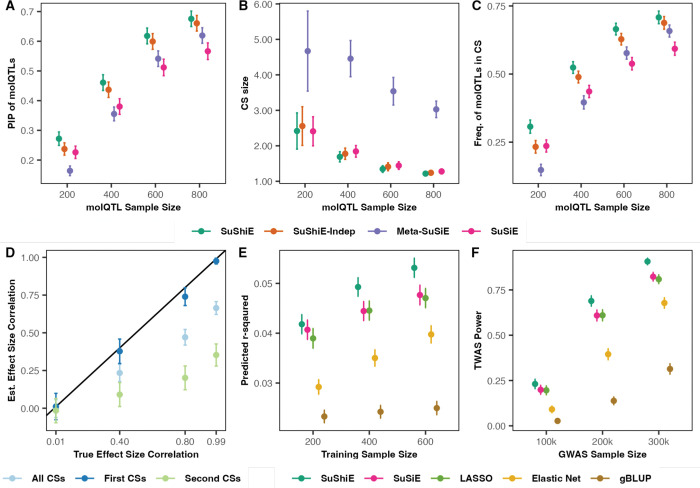
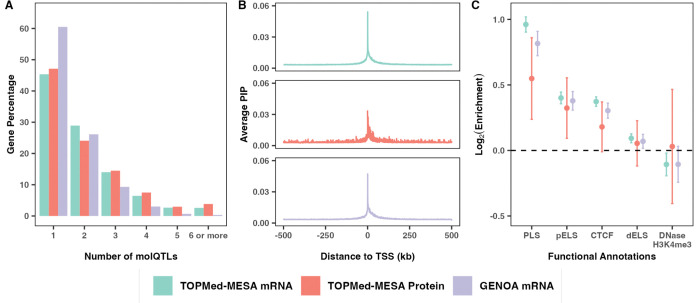
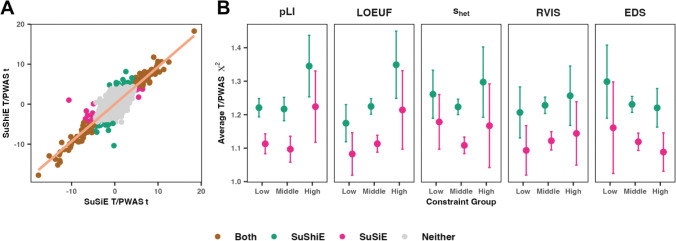
Multi-ancestry statistical fine-mapping of cis-molecular quantitative trait loci (cis-molQTL) aims to improve the precision of distinguishing causal cis-molQTLs from tagging variants. However, existing approaches fail to reflect shared genetic architectures. To solve this limitation, we present the Sum of Shared Single Effects (SuShiE) model, which leverages LD heterogeneity to improve fine-mapping precision, infer cross-ancestry effect size correlations, and estimate ancestry-specific expression prediction weights. We apply SuShiE to mRNA expression measured in PBMCs (n=956) and LCLs (n=814) together with plasma protein levels (n=854) from individuals of diverse ancestries in the TOPMed MESA and GENOA studies. We find SuShiE fine-maps cis-molQTLs for 16% more genes compared with baselines while prioritizing fewer variants with greater functional enrichment. SuShiE infers highly consistent cis-molQTL architectures across ancestries on average; however, we also find evidence of heterogeneity at genes with predicted loss-of-function intolerance, suggesting that environmental interactions may partially explain differences in cis-molQTL effect sizes across ancestries. Lastly, we leverage estimated cis-molQTL effect-sizes to perform individual-level TWAS and PWAS on six white blood cell-related traits in AOU Biobank individuals (n=86k), and identify 44 more genes compared with baselines, further highlighting its benefits in identifying genes relevant for complex disease risk. Overall, SuShiE provides new insights into the cis-genetic architecture of molecular traits.
Conflict of interest statement
Competing interests L.W. provided consulting service to Pupil Bio Inc. and reviewed manuscripts for Gastroenterology Report, not related to this study, and received honorarium. No potential conflicts of interest were disclosed by the other authors.
Figures


Similar articles
-
Improved multiancestry fine-mapping identifies cis-regulatory variants underlying molecular traits and disease risk.Nat Genet. 2025 Aug;57(8):1881-1889. doi: 10.1038/s41588-025-02262-7. Epub 2025 Jul 21. Nat Genet. 2025. PMID: 40691406
-
Powerful mapping of cis-genetic effects on gene expression across diverse populations reveals novel disease-critical genes.medRxiv [Preprint]. 2024 Sep 26:2024.09.25.24314410. doi: 10.1101/2024.09.25.24314410. medRxiv. 2024. PMID: 39399015 Free PMC article. Preprint.
-
Genetic variants influencing liver fat in normal-weight individuals of European ancestry.JHEP Rep. 2025 May 14;7(8):101453. doi: 10.1016/j.jhepr.2025.101453. eCollection 2025 Aug. JHEP Rep. 2025. PMID: 40677695 Free PMC article.
-
Portion, package or tableware size for changing selection and consumption of food, alcohol and tobacco.Cochrane Database Syst Rev. 2015 Sep 14;(9):CD011045. doi: 10.1002/14651858.CD011045.pub2. Cochrane Database Syst Rev. 2015. PMID: 26368271 Free PMC article.
-
Signs and symptoms to determine if a patient presenting in primary care or hospital outpatient settings has COVID-19.Cochrane Database Syst Rev. 2022 May 20;5(5):CD013665. doi: 10.1002/14651858.CD013665.pub3. Cochrane Database Syst Rev. 2022. PMID: 35593186 Free PMC article.
References
Publication types
Grants and funding
- HHSN268201500003C/HL/NHLBI NIH HHS/United States
- N01 HC095161/HL/NHLBI NIH HHS/United States
- HHSN268201600032C/ES/NIEHS NIH HHS/United States
- U10 HL054464/HL/NHLBI NIH HHS/United States
- OT2 OD026551/OD/NIH HHS/United States
- P30 DK063491/DK/NIDDK NIH HHS/United States
- OT2 OD026550/OD/NIH HHS/United States
- UL1 TR001420/TR/NCATS NIH HHS/United States
- UL1 TR000040/TR/NCATS NIH HHS/United States
- OT2 OD023206/OD/NIH HHS/United States
- K08 HL159346/HL/NHLBI NIH HHS/United States
- R01 GM140287/GM/NIGMS NIH HHS/United States
- N01 HC095168/HL/NHLBI NIH HHS/United States
- OT2 OD026556/OD/NIH HHS/United States
- R01 HL120393/HL/NHLBI NIH HHS/United States
- U24 OD023176/OD/NIH HHS/United States
- OT2 OD026548/OD/NIH HHS/United States
- UL1 TR001079/TR/NCATS NIH HHS/United States
- N02 HL064278/HL/NHLBI NIH HHS/United States
- N01 HC095169/HL/NHLBI NIH HHS/United States
- U2C OD023196/OD/NIH HHS/United States
- R01 HL087660/HL/NHLBI NIH HHS/United States
- U01 HL120393/HL/NHLBI NIH HHS/United States
- OT2 OD025315/OD/NIH HHS/United States
- U24 OD023121/OD/NIH HHS/United States
- N01 HC095167/HL/NHLBI NIH HHS/United States
- R01 CA258808/CA/NCI NIH HHS/United States
- OT2 OD026552/OD/NIH HHS/United States
- OT2 OD026549/OD/NIH HHS/United States
- N01 HC095159/HL/NHLBI NIH HHS/United States
- U01 HL054464/HL/NHLBI NIH HHS/United States
- R01 HL119443/HL/NHLBI NIH HHS/United States
- OT2 OD025337/OD/NIH HHS/United States
- U54 HG013243/HG/NHGRI NIH HHS/United States
- U10 HL054457/HL/NHLBI NIH HHS/United States
- R01 HG012133/HG/NHGRI NIH HHS/United States
- U10 HL054481/HL/NHLBI NIH HHS/United States
- OT2 OD025277/OD/NIH HHS/United States
- HHSN268201800001C/HL/NHLBI NIH HHS/United States
- U01 HL054457/HL/NHLBI NIH HHS/United States
- OT2 OD026555/OD/NIH HHS/United States
- N01 HC095163/HL/NHLBI NIH HHS/United States
- OT2 OD026553/OD/NIH HHS/United States
- OT2 OD023205/OD/NIH HHS/United States
- HHSN268201500003I/HL/NHLBI NIH HHS/United States
- OT2 OD025276/OD/NIH HHS/United States
- U01 HL054481/HL/NHLBI NIH HHS/United States
- N01 HC095166/HL/NHLBI NIH HHS/United States
- OT2 OD026557/OD/NIH HHS/United States
- OT2 OD026554/OD/NIH HHS/United States
- P01 CA196569/CA/NCI NIH HHS/United States
- R01 HL117626/HL/NHLBI NIH HHS/United States
- N01 HC095162/HL/NHLBI NIH HHS/United States
- UL1 TR001881/TR/NCATS NIH HHS/United States
- U24 OD023163/OD/NIH HHS/United States
- N01 HC095165/HL/NHLBI NIH HHS/United States
- R35 GM147789/GM/NIGMS NIH HHS/United States
- N01 HC095164/HL/NHLBI NIH HHS/United States
- R35 GM142783/GM/NIGMS NIH HHS/United States
- N01 HC095160/HL/NHLBI NIH HHS/United States
LinkOut - more resources
Full Text Sources
Research Materials