

Alzheimer's disease as a causal risk factor for diabetic retinopathy: a Mendelian randomization study
- PMID: 38699385
- PMCID: PMC11064697
- DOI: 10.3389/fendo.2024.1340608
Alzheimer's disease as a causal risk factor for diabetic retinopathy: a Mendelian randomization study
Abstract
Objectives: This study aims to investigate the causal relationship between Alzheimer's Disease (AD) and Diabetic Retinopathy (DR).
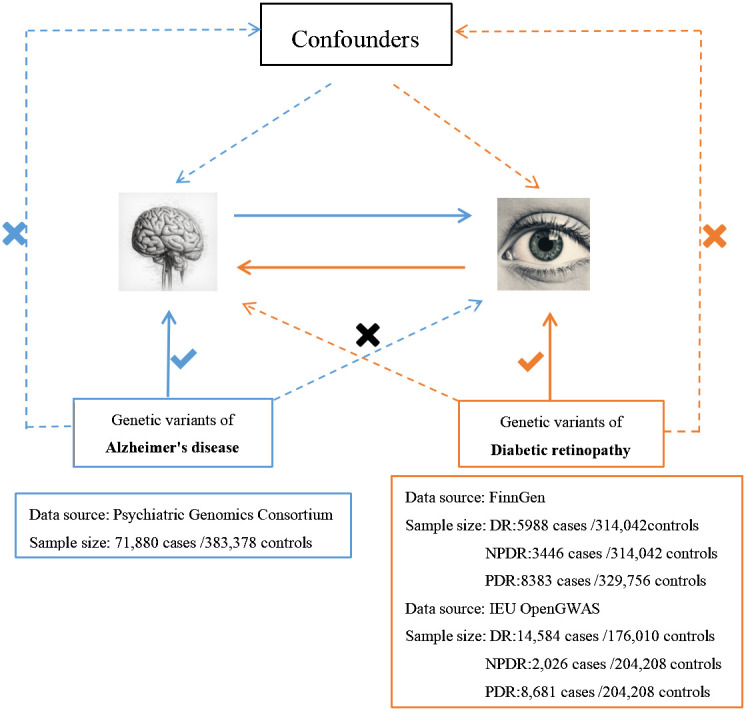
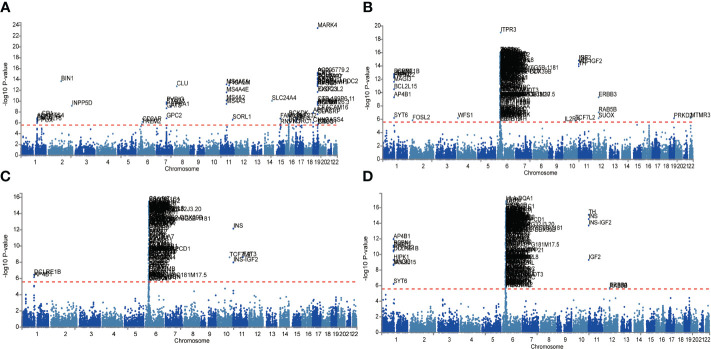
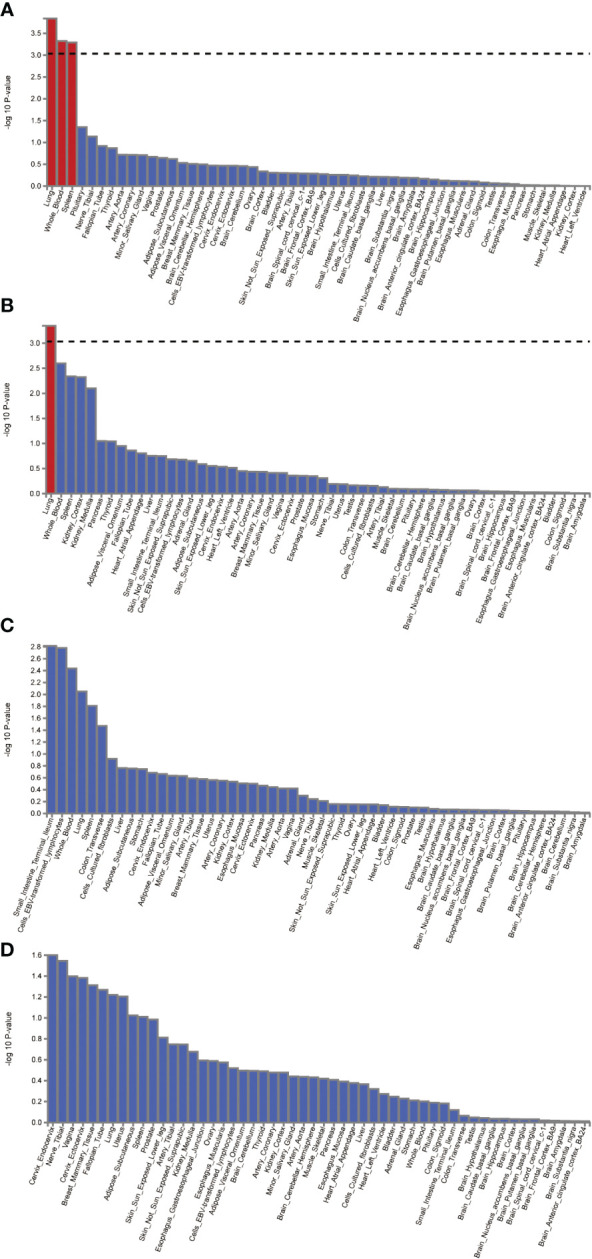
Methods: Employing Mendelian Randomization (MR), Generalized Summary-data-based Mendelian Randomization (GSMR), and the MR-Steiger test, this study scrutinizes the genetic underpinnings of the hypothesized causal association between AD and DR, as well as its Proliferative DR (PDR) and Non-Proliferative DR (NPDR) subtypes. Comprehensive data from Genome-Wide Association Studies (GWAS) were analyzed, specifically AD data from the Psychiatric Genomics Consortium (71,880 cases/383,378 controls), and DR, PDR, and NPDR data from both the FinnGen consortium (FinnGen release R8, DR: 5,988 cases/314,042 controls; PDR: 8,383 cases/329,756 controls; NPDR: 3,446 cases/314,042 controls) and the IEU OpenGWAS (DR: 14,584 cases/176,010 controls; PDR: 8,681 cases/204,208 controls; NPDR: 2,026 cases/204,208 controls). The study also incorporated Functional Mapping and Annotation (FUMA) for an in-depth analysis of the GWAS results.
Results: The MR analyses revealed that genetic susceptibility to AD significantly increases the risk of DR, as evidenced by GWAS data from the FinnGen consortium (OR: 2.5090; 95% confidence interval (CI):1.2102-5.2018, false discovery rate P-value (PFDR)=0.0201; GSMR: bxy=0.8936, bxy_se=0.3759, P=0.0174), NPDR (OR: 2.7455; 95% CI: 1.3178-5.7197, PFDR=0.0166; GSMR: bxy=0.9682, bxy_se=0.3802, P=0.0126), and PDR (OR: 2.3098; 95% CI: 1.2411-4.2986, PFDR=0.0164; GSMR: bxy=0.7962, bxy_se=0.3205, P=0.0129) using DR GWAS from FinnGen consortium. These results were corroborated by DR GWAS datasets from IEU OpenGWAS. The MR-Steiger test confirmed a significant association of all identified instrumental variables (IVs) with AD. While a potential causal effect of DR and its subtypes on AD was identified, the robustness of these results was constrained by a low power value. FUMA analysis identified OARD1, NFYA, TREM1 as shared risk genes between DR and AD, suggesting a potential genetic overlap between these complex diseases.
Discussion: This study underscores the contribution of AD to an increased risk of DR, as well as NPDR and PDR subtypes, underscoring the necessity of a holistic approach in the management of patients affected by these conditions.
Keywords: Alzheimer’s disease; FUMA; Mendelian randomization; causal association; diabetic retinopathy.
Copyright © 2024 Ouyang, Yuan, Ju, Chen, Peng and Xu.
Conflict of interest statement
The authors declare that the research was conducted in the absence of any commercial or financial relationships that could be construed as a potential conflict of interest.
Figures


Similar articles
-
Causal association between cystatin C and diabetic retinopathy: A two-sample Mendelian randomization study.J Diabetes Investig. 2024 Nov;15(11):1626-1636. doi: 10.1111/jdi.14273. Epub 2024 Aug 12. J Diabetes Investig. 2024. PMID: 39135422 Free PMC article.
-
Causal relationships between blood metabolites and diabetic retinopathy: a two-sample Mendelian randomization study.Front Endocrinol (Lausanne). 2024 May 1;15:1383035. doi: 10.3389/fendo.2024.1383035. eCollection 2024. Front Endocrinol (Lausanne). 2024. PMID: 38752182 Free PMC article.
-
The causal relationship between immune cells and diabetic retinopathy: a Mendelian randomization study.Front Immunol. 2024 Sep 2;15:1381002. doi: 10.3389/fimmu.2024.1381002. eCollection 2024. Front Immunol. 2024. PMID: 39290701 Free PMC article.
-
Association of VEGF Gene Polymorphisms with Susceptibility to Diabetic Retinopathy: A Systematic Review and Meta-Analysis.Horm Metab Res. 2020 May;52(5):264-279. doi: 10.1055/a-1143-6024. Epub 2020 May 13. Horm Metab Res. 2020. PMID: 32403142
-
Associations between Vascular Endothelial Growth Factor Gene Polymorphisms and Different Types of Diabetic Retinopathy Susceptibility: A Systematic Review and Meta-Analysis.J Diabetes Res. 2021 Jan 4;2021:7059139. doi: 10.1155/2021/7059139. eCollection 2021. J Diabetes Res. 2021. PMID: 33490285 Free PMC article.
Cited by
-
The Association Between SLIT2 in Human Vitreous Humor and Plasma and Neurocognitive Test Scores.bioRxiv [Preprint]. 2025 Jul 31:2025.05.03.652072. doi: 10.1101/2025.05.03.652072. bioRxiv. 2025. Update in: J Alzheimers Dis. 2025 Sep 3:13872877251374287. doi: 10.1177/13872877251374287. PMID: 40631316 Free PMC article. Updated. Preprint.
References
-
- Adelson JD, Bourne RRA, Briant PS, Flaxman SR, Taylor HRB, Jonas JB. Causes of blindness and vision impairment in 2020 and trends over 30 years, and prevalence of avoidable blindness in relation to vision 2020: the right to sight: an analysis for the global burden of disease study. Lancet Glob Health. (2021) 9:e144–e60. doi: 10.1016/s2214-109x(20)30489-7 - DOI - PMC - PubMed
-
- Little K, Llorian-Salvador M, Scullion S, Hernandez C, Simo-Servat O, Del Marco A, et al. . Common pathways in dementia and diabetic retinopathy: understanding the mechanisms of diabetes-related cognitive decline. Trends Endocrinol Metab. (2022) 33:50–71. doi: 10.1016/j.tem.2021.10.008 - DOI - PubMed
Publication types
MeSH terms
LinkOut - more resources
Full Text Sources
Medical