

A Machine Learning Prediction Model of Adult Obstructive Sleep Apnea Based on Systematically Evaluated Common Clinical Biochemical Indicators
- PMID: 38699466
- PMCID: PMC11063111
- DOI: 10.2147/NSS.S453794
A Machine Learning Prediction Model of Adult Obstructive Sleep Apnea Based on Systematically Evaluated Common Clinical Biochemical Indicators
Abstract
Objective: Obstructive sleep apnea (OSA) is a common and potentially fatal sleep disorder. The purpose of this study was to construct an objective and easy-to-promote model based on common clinical biochemical indicators and demographic data for OSA screening.
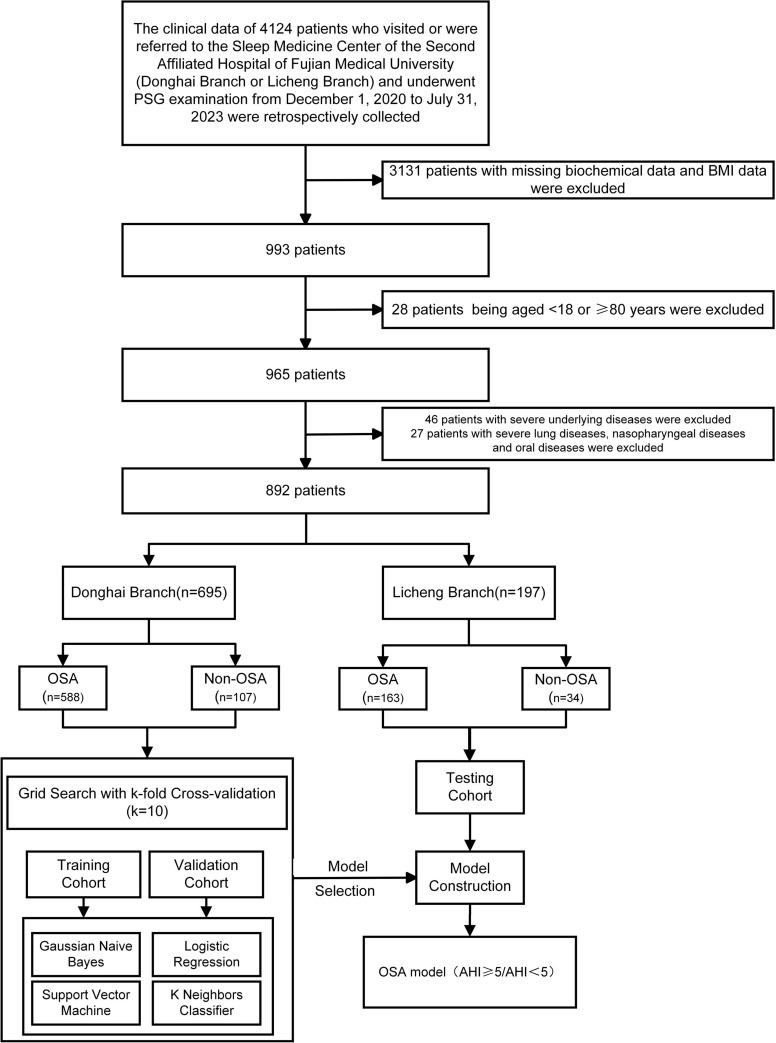
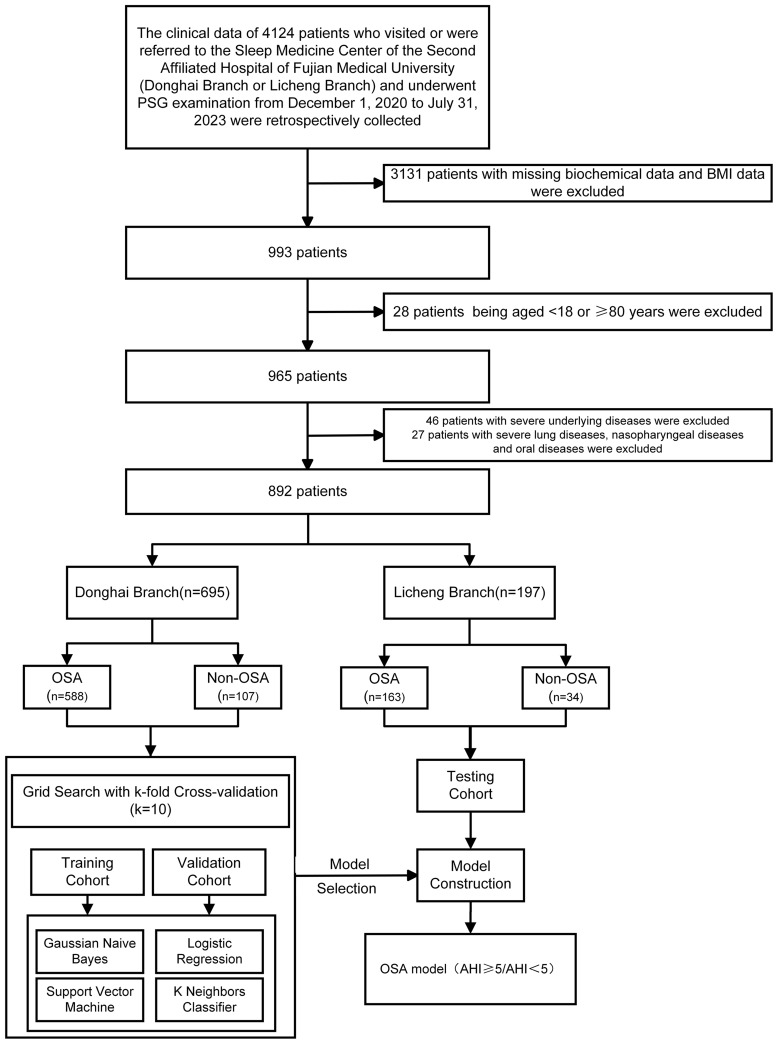
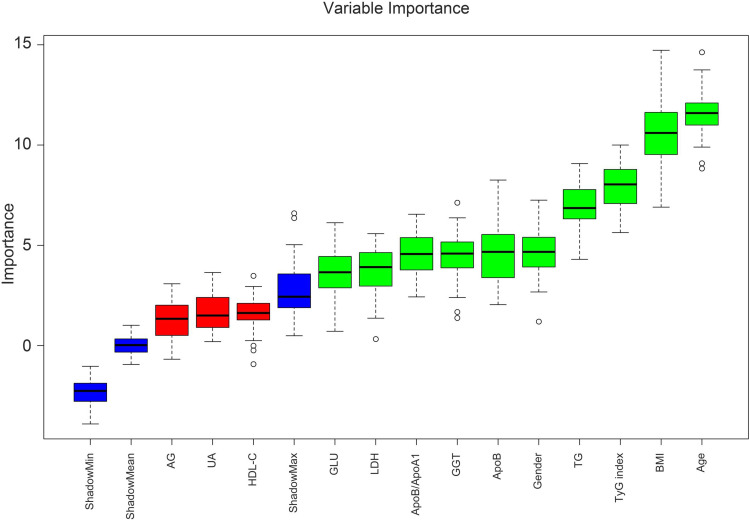
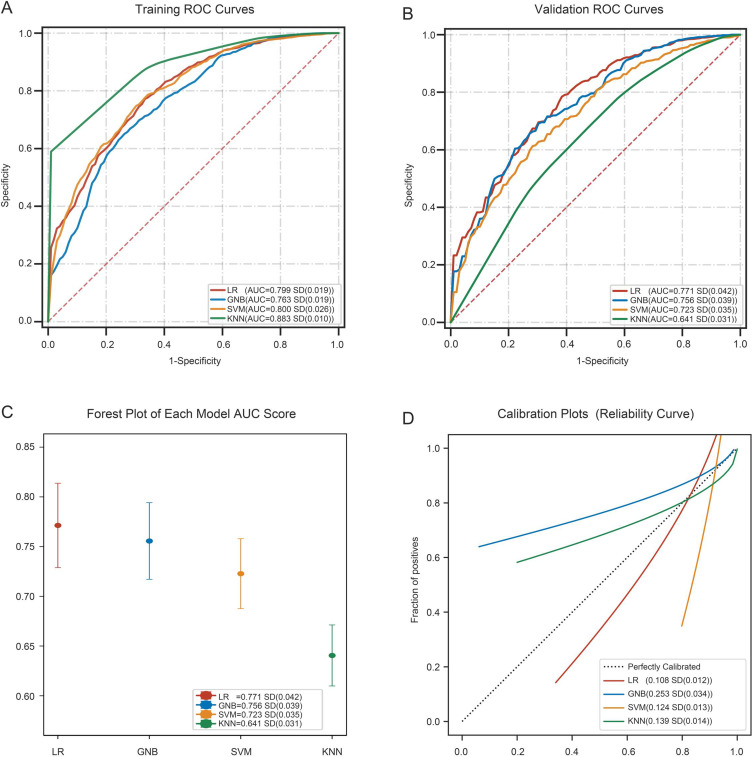
Methods: The study collected the clinical data of patients who were referred to the Sleep Medicine Center of the Second Affiliated Hospital of Fujian Medical University from December 1, 2020, to July 31, 2023, including data for demographics, polysomnography (PSG), and 30 biochemical indicators. Univariate and multivariate analyses were performed to compare the differences between groups, and the Boruta method was used to analyze the importance of the predictors. We selected and compared 10 predictors using 4 machine learning algorithms which were "Gaussian Naive Bayes (GNB)", "Support Vector Machine (SVM)", "K Neighbors Classifier (KNN)", and "Logistic Regression (LR)". Finally, the optimal algorithm was selected to construct the final prediction model.
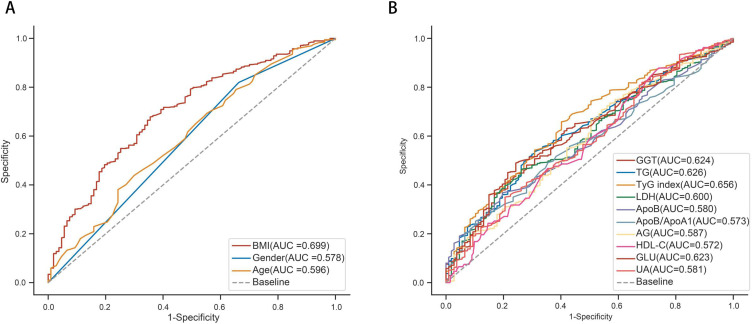
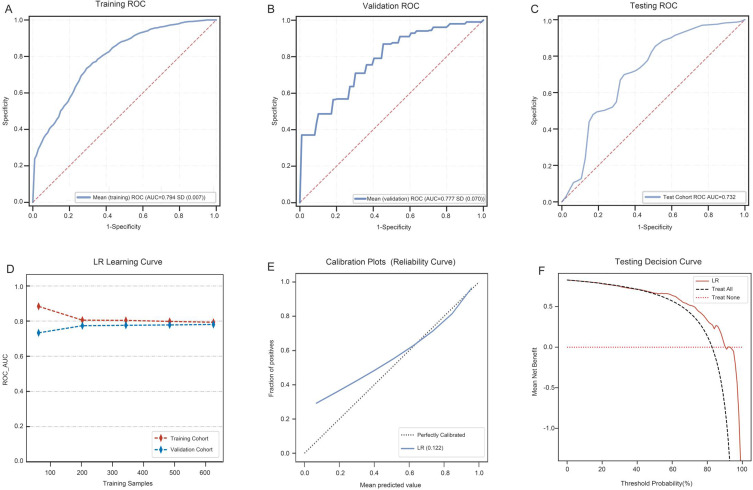
Results: Among all the predictors of OSA, body mass index (BMI) showed the best predictive efficacy with an area under the receiver operating characteristic curve (AUC) = 0.699; among the predictors of biochemical indicators, triglyceride-glucose (TyG) index represented the best predictive performance (AUC = 0.656). The LR algorithm outperformed the 4 established machine learning (ML) algorithms, with an AUC (F1 score) of 0.794 (0.841), 0.777 (0.827), and 0.732 (0.788) in the training, validation, and testing cohorts, respectively.
Conclusion: We have constructed an efficient OSA screening tool. The introduction of biochemical indicators in ML-based prediction models can provide a reference for clinicians in determining whether patients with suspected OSA need PSG.
Keywords: biochemical indicators; machine learning; obstructive sleep apnea; prediction model; triglyceride-glucose index.
© 2024 Huang et al.
Conflict of interest statement
The authors declare no conflicts of interest in this work.
Figures

Similar articles
-
Enhanced machine learning approaches for OSA patient screening: model development and validation study.Sci Rep. 2024 Aug 26;14(1):19756. doi: 10.1038/s41598-024-70647-5. Sci Rep. 2024. PMID: 39187569 Free PMC article.
-
Development and application of a machine learning-based predictive model for obstructive sleep apnea screening.Front Big Data. 2024 May 16;7:1353469. doi: 10.3389/fdata.2024.1353469. eCollection 2024. Front Big Data. 2024. PMID: 38817683 Free PMC article.
-
Prediction model of obstructive sleep apnea-related hypertension: Machine learning-based development and interpretation study.Front Cardiovasc Med. 2022 Dec 5;9:1042996. doi: 10.3389/fcvm.2022.1042996. eCollection 2022. Front Cardiovasc Med. 2022. PMID: 36545020 Free PMC article.
-
Logistic regression and artificial neural network-based simple predicting models for obstructive sleep apnea by age, sex, and body mass index.Math Biosci Eng. 2022 Aug 10;19(11):11409-11421. doi: 10.3934/mbe.2022532. Math Biosci Eng. 2022. PMID: 36124597 Clinical Trial.
-
Status and opportunities of machine learning applications in obstructive sleep apnea: A narrative review.Comput Struct Biotechnol J. 2025 Apr 25;28:167-174. doi: 10.1016/j.csbj.2025.04.033. eCollection 2025. Comput Struct Biotechnol J. 2025. PMID: 40421411 Free PMC article. Review.
Cited by
-
Association Between Metabolic Score for Insulin Resistance (METS-IR) and Risk of Obstructive Sleep Apnea: Analysis of NHANES Database and a Chinese Cohort.Nat Sci Sleep. 2025 Apr 17;17:607-620. doi: 10.2147/NSS.S400125. eCollection 2025. Nat Sci Sleep. 2025. PMID: 40260090 Free PMC article.
-
AI-Driven Detection of Obstructive Sleep Apnea Using Dual-Branch CNN and Machine Learning Models.Biomedicines. 2025 Apr 30;13(5):1090. doi: 10.3390/biomedicines13051090. Biomedicines. 2025. PMID: 40426919 Free PMC article.
References
-
- Malec SA, Taneja SB, Albert SM, et al. Causal feature selection using a knowledge graph combining structured knowledge from the biomedical literature and ontologies: a use case studying depression as a risk factor for Alzheimer’s disease. J Biomed Informat. 2023;142:104368. doi:10.1016/j.jbi.2023.104368 - DOI - PMC - PubMed
LinkOut - more resources
Full Text Sources
