

Inhibitory mechanisms of decoy receptor 3 in cecal ligation and puncture-induced sepsis
- PMID: 38700314
- PMCID: PMC11237498
- DOI: 10.1128/mbio.00521-24
Inhibitory mechanisms of decoy receptor 3 in cecal ligation and puncture-induced sepsis
Abstract
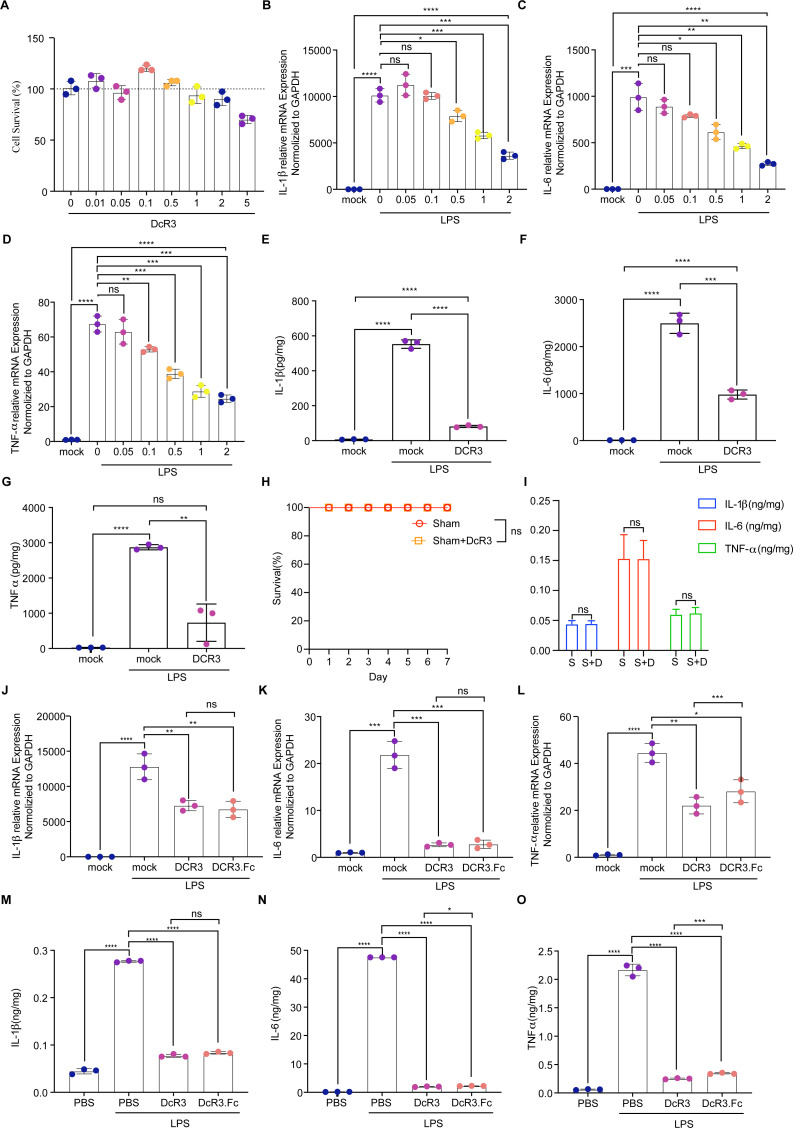
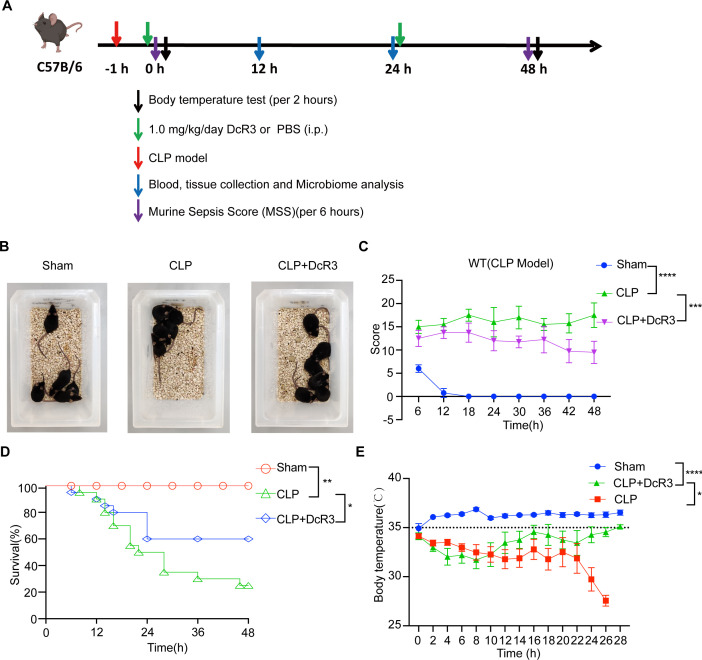
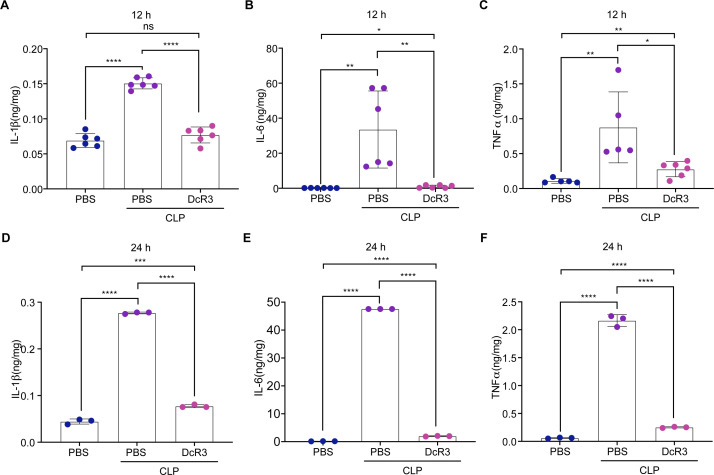
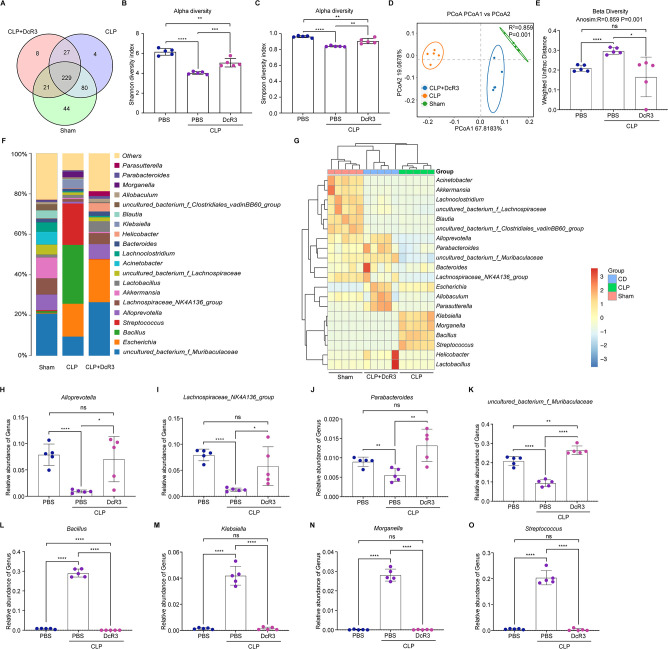
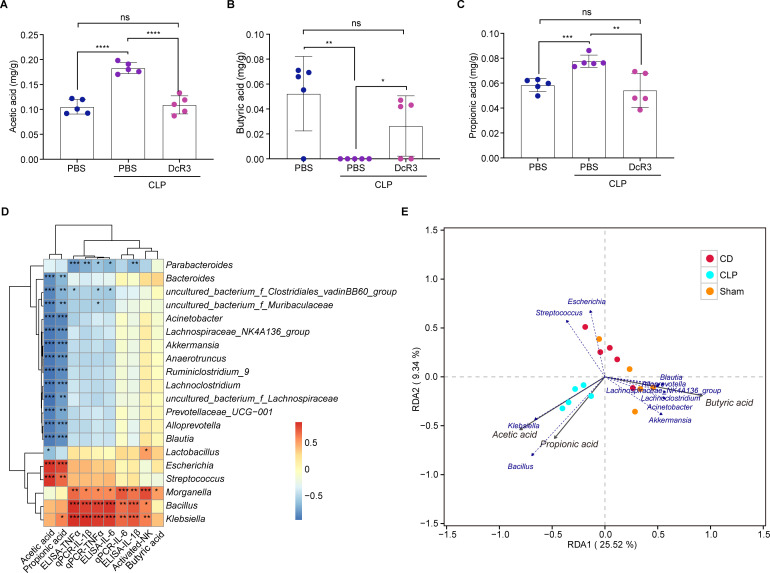
Despite its high mortality, specific and effective drugs for sepsis are lacking. Decoy receptor 3 (DcR3) is a potential biomarker for the progression of inflammatory diseases. The recombinant human DcR3-Fc chimera protein (DcR3.Fc) suppresses inflammatory responses in mice with sepsis, which is critical for improving survival. The Fc region can exert detrimental effects on the patient, and endogenous peptides are highly conducive to clinical application. However, the mechanisms underlying the effects of DcR3 on sepsis are unknown. Herein, we aimed to demonstrate that DcR3 may be beneficial in treating sepsis and investigated its mechanism of action. Recombinant DcR3 was obtained in vitro. Postoperative DcR3 treatment was performed in mouse models of lipopolysaccharide- and cecal ligation and puncture (CLP)-induced sepsis, and their underlying molecular mechanisms were explored. DcR3 inhibited sustained excessive inflammation in vitro, increased the survival rate, reduced the proinflammatory cytokine levels, changed the circulating immune cell composition, regulated the gut microbiota, and induced short-chain fatty acid synthesis in vivo. Thus, DcR3 protects against CLP-induced sepsis by inhibiting the inflammatory response and apoptosis. Our study provides valuable insights into the molecular mechanisms associated with the protective effects of DcR3 against sepsis, paving the way for future clinical studies.
Importance: Sepsis affects millions of hospitalized patients worldwide each year, but there are no sepsis-specific drugs, which makes sepsis therapies urgently needed. Suppression of excessive inflammatory responses is important for improving the survival of patients with sepsis. Our results demonstrate that DcR3 ameliorates sepsis in mice by attenuating systematic inflammation and modulating gut microbiota, and unveil the molecular mechanism underlying its anti-inflammatory effect.
Keywords: anti-inflammatory; decoy receptor 3; gut microbiota; sepsis.
Conflict of interest statement
The authors declare no conflict of interest.
Figures


Similar articles
-
Decoy Receptor 3 Improves Survival in Experimental Sepsis by Suppressing the Inflammatory Response and Lymphocyte Apoptosis.PLoS One. 2015 Jun 29;10(6):e0131680. doi: 10.1371/journal.pone.0131680. eCollection 2015. PLoS One. 2015. PMID: 26121476 Free PMC article.
-
Protective effects of DcR3-SUMO on lipopolysaccharide-induced inflammatory cells and septic mice.Int J Biol Macromol. 2024 Aug;275(Pt 2):133703. doi: 10.1016/j.ijbiomac.2024.133703. Epub 2024 Jul 9. Int J Biol Macromol. 2024. PMID: 38986982
-
Combining Aloin with TIENAM ameliorates cecal ligation and puncture-induced sepsis in mice by attenuating inflammation and modulating abdominal cavity microbiota.Int Immunopharmacol. 2024 Nov 15;141:112925. doi: 10.1016/j.intimp.2024.112925. Epub 2024 Aug 17. Int Immunopharmacol. 2024. PMID: 39154534
-
Decoy receptor 3: an endogenous immunomodulator in cancer growth and inflammatory reactions.J Biomed Sci. 2017 Jun 19;24(1):39. doi: 10.1186/s12929-017-0347-7. J Biomed Sci. 2017. PMID: 28629361 Free PMC article. Review.
-
Decoy receptor 3: a pleiotropic immunomodulator and biomarker for inflammatory diseases, autoimmune diseases and cancer.Biochem Pharmacol. 2011 Apr 1;81(7):838-47. doi: 10.1016/j.bcp.2011.01.011. Epub 2011 Feb 2. Biochem Pharmacol. 2011. PMID: 21295012 Review.
Cited by
-
Aloe-emodin plus TIENAM ameliorate cecal ligation and puncture-induced sepsis in mice by attenuating inflammation and modulating microbiota.Front Microbiol. 2024 Dec 12;15:1491169. doi: 10.3389/fmicb.2024.1491169. eCollection 2024. Front Microbiol. 2024. PMID: 39726955 Free PMC article.
-
Sepsis-induced immunosuppression: mechanisms, biomarkers and immunotherapy.Front Immunol. 2025 Apr 29;16:1577105. doi: 10.3389/fimmu.2025.1577105. eCollection 2025. Front Immunol. 2025. PMID: 40364841 Free PMC article. Review.
-
Administration of turmeric kombucha ameliorates lipopolysaccharide-induced sepsis by attenuating inflammation and modulating gut microbiota.Front Microbiol. 2024 Aug 30;15:1452190. doi: 10.3389/fmicb.2024.1452190. eCollection 2024. Front Microbiol. 2024. PMID: 39282561 Free PMC article.
-
Decoy receptor 3 as a prognostic biomarker for sepsis and septic shock according to the Sepsis-3 definitions.Front Cell Infect Microbiol. 2025 Mar 7;15:1529917. doi: 10.3389/fcimb.2025.1529917. eCollection 2025. Front Cell Infect Microbiol. 2025. PMID: 40125518 Free PMC article.
References
-
- Singer M, Deutschman CS, Seymour CW, Shankar-Hari M, Annane D, Bauer M, Bellomo R, Bernard GR, Chiche J-D, Coopersmith CM, Hotchkiss RS, Levy MM, Marshall JC, Martin GS, Opal SM, Rubenfeld GD, van der Poll T, Vincent J-L, Angus DC. 2016. The third International consensus definitions for sepsis and septic shock (Sepsis-3). JAMA 315:801–810. doi:10.1001/jama.2016.0287 - DOI - PMC - PubMed
-
- Vincent J-L, Marshall JC, Namendys-Silva SA, François B, Martin-Loeches I, Lipman J, Reinhart K, Antonelli M, Pickkers P, Njimi H, Jimenez E, Sakr Y, ICON investigators . 2014. Assessment of the worldwide burden of critical illness: the intensive care over nations (ICON) audit. Lancet Respir Med 2:380–386. doi:10.1016/S2213-2600(14)70061-X - DOI - PubMed
-
- Rocheteau P, Chatre L, Briand D, Mebarki M, Jouvion G, Bardon J, Crochemore C, Serrani P, Lecci PP, Latil M, Matot B, Carlier PG, Latronico N, Huchet C, Lafoux A, Sharshar T, Ricchetti M, Chrétien F. 2015. Sepsis induces long-term metabolic and mitochondrial muscle stem cell dysfunction amenable by mesenchymal stem cell therapy. Nat Commun 6. doi:10.1038/ncomms10145 - DOI - PMC - PubMed
MeSH terms
Substances
Grants and funding
- 81803547/MOST | National Natural Science Foundation of China (NSFC)
- 82202906/MOST | National Natural Science Foundation of China (NSFC)
- 81901243/MOST | National Natural Science Foundation of China (NSFC)
- 2021J01204/Natural Science Foundation of Fujian Province (Fujian Natural Science Foundation)
- 2021N3005/Fujian Provincial Regional Development Project
LinkOut - more resources
Full Text Sources
Medical
Miscellaneous
