. 2024 May 3;40(1):29.
doi: 10.1007/s10565-024-09871-8.

Exosomal YB-1 facilitates ovarian restoration by MALAT1/miR-211-5p/FOXO3 axis

Affiliations

Exosomal YB-1 facilitates ovarian restoration by MALAT1/miR-211-5p/FOXO3 axis

Mengxue Zhang et al. Cell Biol Toxicol. .

Abstract

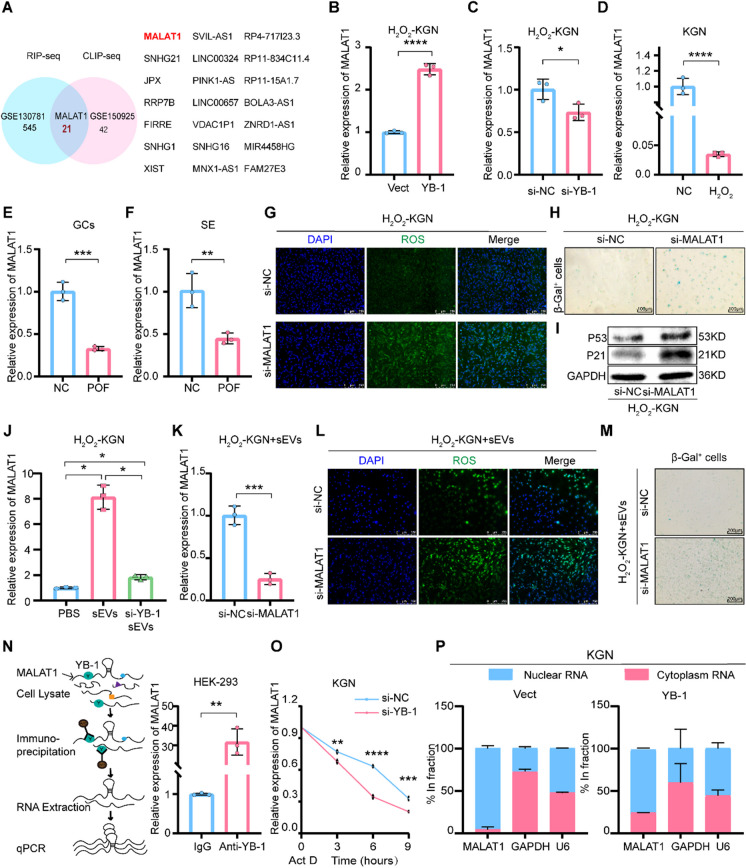
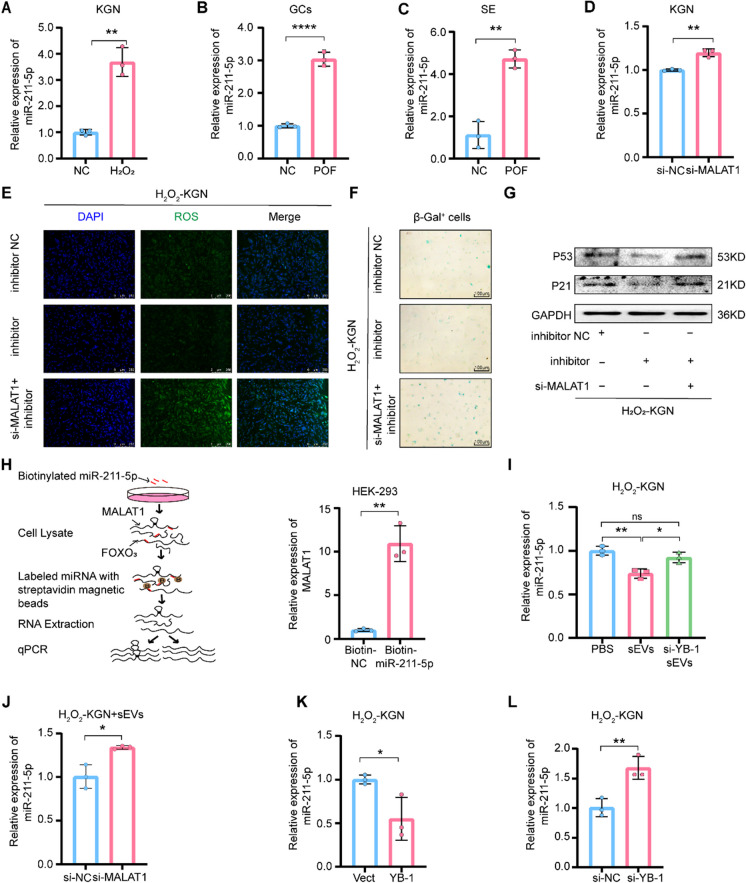
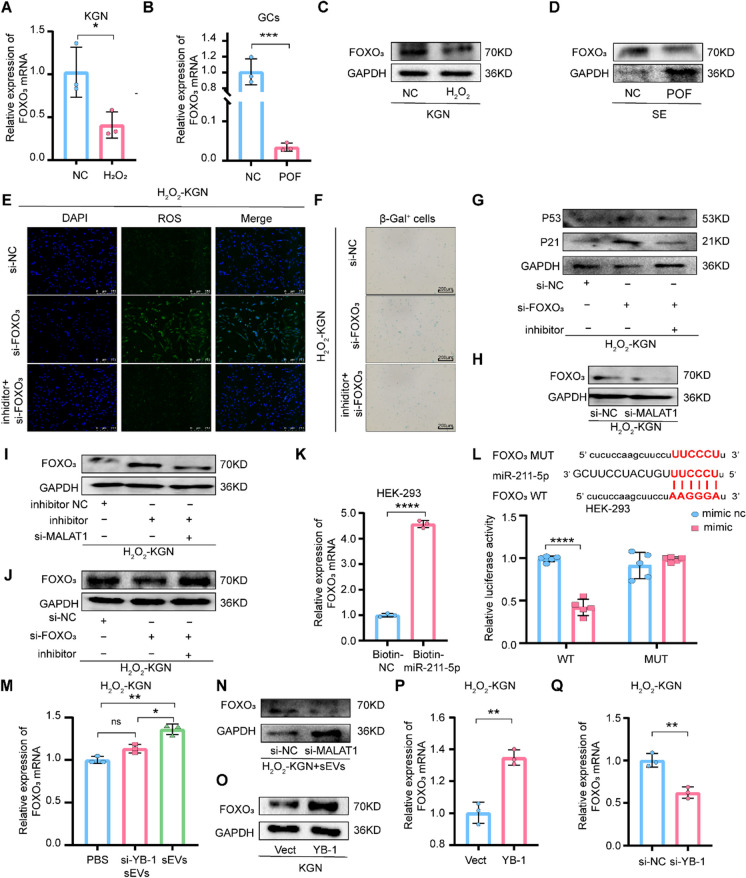
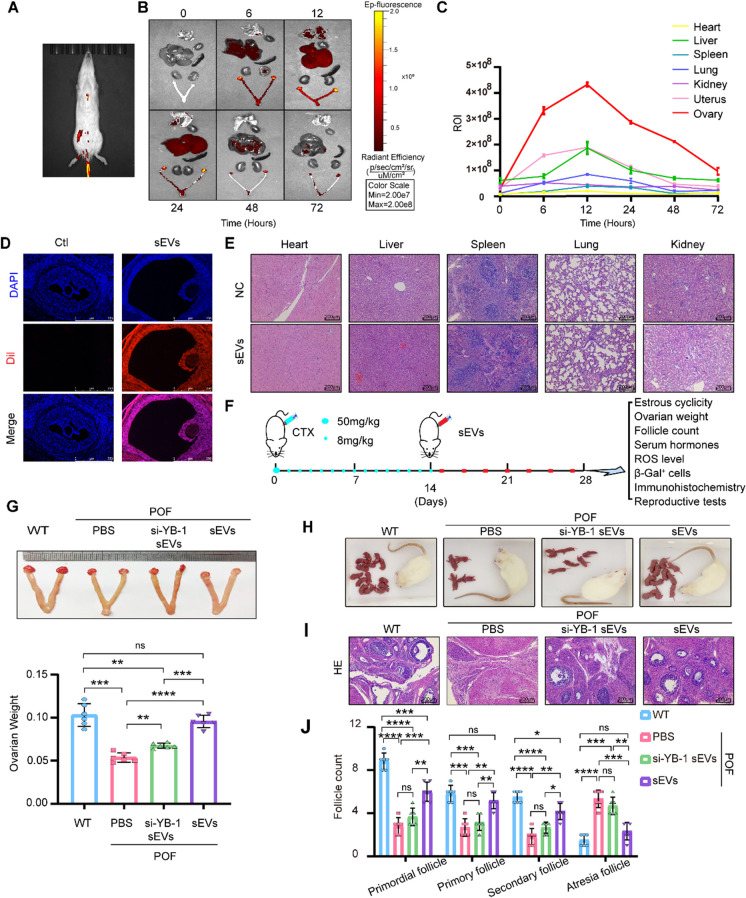
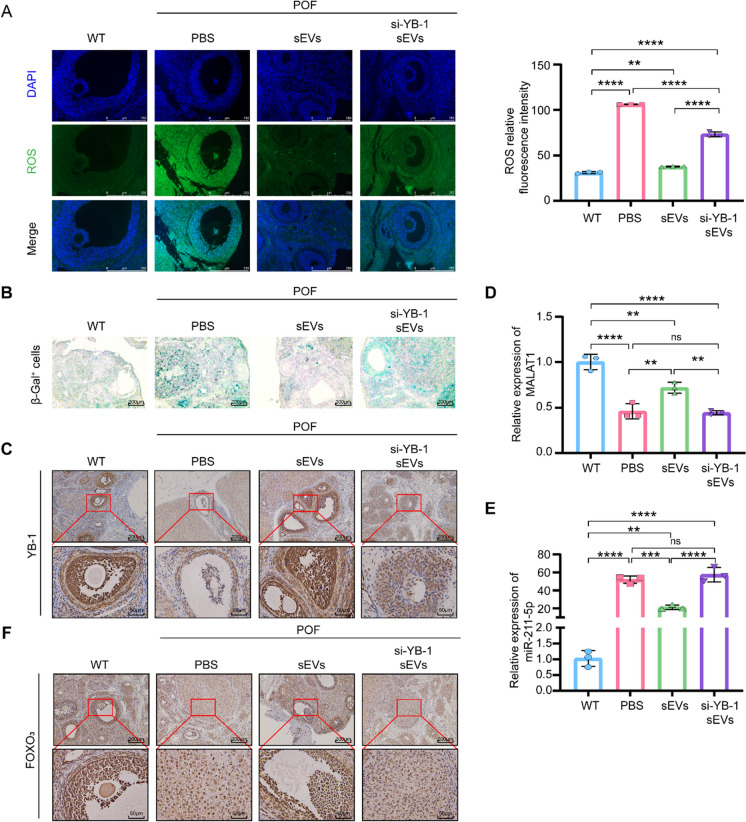
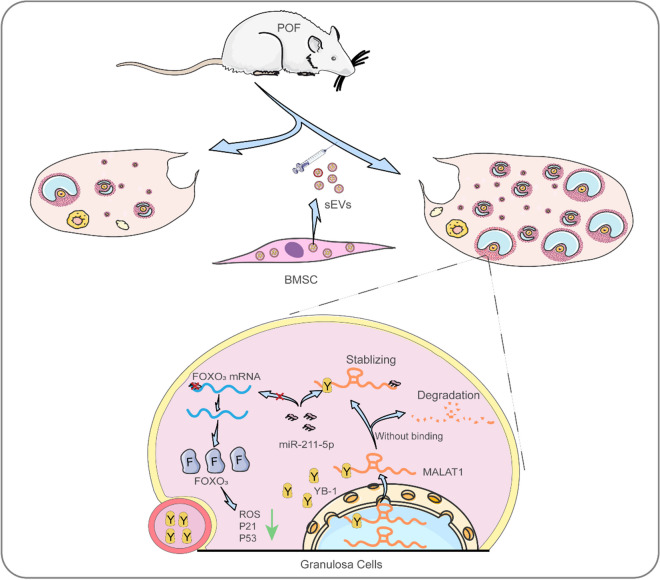
Premature ovarian failure (POF) affects many adult women less than 40 years of age and leads to infertility. Mesenchymal stem cells-derived small extracellular vesicles (MSCs-sEVs) are attractive candidates for ovarian function restoration and folliculogenesis for POF due to their safety and efficacy, however, the key mediator in MSCs-sEVs that modulates this response and underlying mechanisms remains elusive. Herein, we reported that YB-1 protein was markedly downregulated in vitro and in vivo models of POF induced with H2O2 and CTX respectively, accompanied by granulosa cells (GCs) senescence phenotype. Notably, BMSCs-sEVs transplantation upregulated YB-1, attenuated oxidative damage-induced cellular senescence in GCs, and significantly improved the ovarian function of POF rats, but that was reversed by YB-1 depletion. Moreover, YB-1 showed an obvious decline in serum and GCs in POF patients. Mechanistically, YB-1 as an RNA-binding protein (RBP) physically interacted with a long non-coding RNA, MALAT1, and increased its stability, further, MALAT1 acted as a competing endogenous RNA (ceRNA) to elevate FOXO3 levels by sequestering miR-211-5p to prevent its degradation, leading to repair of ovarian function. In summary, we demonstrated that BMSCs-sEVs improve ovarian function by releasing YB-1, which mediates MALAT1/miR-211-5p/FOXO3 axis regulation, providing a possible therapeutic target for patients with POF.

Keywords: MALAT1; POF; YB-1; sEVs.


Conflict of interest statement

The authors declare no competing interests.

Figures

Fig. 1
Fig. 1
YB-1 is the key protein of BMSCs-sEVs for the treatment of POF. A. Western blot detected the expression of YB-1 in H2O2-KGN and the GCs or serum of patients with POF. B. Transmission electron microscopy was performed to observe the morphology of sEVs. C. Western blot was used to analyze the expression of exosome surface marker protein CD9. D. Size distribution of BMSCs-sEVs was assessed by a nanoparticle tracking analysis. E. Schematic diagram of H2O2-KGN cells cocultured with BMSCs and sEVs. F. KGN was incubated with PKH26-labeled sEVs, and the uptake of sEVs was observed under a fluorescent microscope. G. The difference expression of YB-1 in the H2O2 + PBS, H2O2 + sEVs and H2O2 + BMSCs groups was detected by Western blot. H. ROS in three experimental groups of KGN were assessed using DCFH-DA probes. The ROS‐positive apoptotic cells are indicated by green fluorescence. The nuclei (blue) were stained with DAPI. I. Immunohistochemistry staining of S-A-β-gal in the H2O2-KGN of the PBS, sEVs and BMSCs groups. J. The difference expression of YB-1 in the H2O2-KGN of the PBS, si-YB-1 sEVs and sEVs groups was detected by Western blot. K. The ROS level in the H2O2-KGN cocultured with sEVs and si-YB-1 sEVs were detected using DCFH-DA probes. L. Immunohistochemistry staining of S-A-β-gal in the H2O2-KGN cocultured with sEVs and si-YB-1 sEVs. M. ROS in oe-YB-1 group of H2O2-KGN were assessed using DCFH-DA probes. The ROS‐positive apoptotic cells are indicated by green fluorescence. The nuclei (blue) were stained with DAPI. N. Immunohistochemistry staining of S-A-β-gal in oe-YB-1 group of H2O2-KGN. O. Overexpressed YB-1 decreases protein levels of p21 and p53 in H2O2-KGN detected by western blot
Fig. 2
Fig. 2
YB-1 enhances MALAT1 RNA stability. A. Venn diagram of LncRNA predicted bind to YB-1 in GSE130781 and GSE150925 database (http://www.ncbi.nlm.nih.gov/geo/), B-C. The expression of MALAT1 in the H2O2-KGN of oe-YB-1 (B) and si-YB-1 (C) groups was detected by qPCR. D. qPCR analysis of MALAT1 expression in H2O2-KGN. EF. MALAT1 expression in the GCs (E) or serum (F) of healthy people and patients with POF was measured by qPCR. G. ROS in si-NC and si-MALAT1 of H2O2-KGN were assessed using DCFH-DA probes. The ROS‐positive apoptotic cells are indicated by green fluorescence. The nuclei (blue) were stained with DAPI. H. Immunohistochemistry staining of S-A-β-gal in si-NC and si-MALAT1 of H2O2-KGN groups. I. The difference expression of p21 and p53 in si-NC and si-MALAT1 of H2O2-KGN groups was detected by Western blot. J. The expression of MALAT1 in the H2O2-KGN of PBS, sEVs and si-YB-1 sEVs groups was detected by qPCR. K. qPCR analysis of MALAT1 expression in H2O2-KGN treated with si-MALAT1 and sEVs. L. ROS in si-NC and si-MALAT1 of H2O2-KGN + sEVs were assessed using DCFH-DA probes. The ROS‐positive apoptotic cells are indicated by green fluorescence. The nuclei (blue) were stained with DAPI. M. Immunohistochemistry staining of S-A-β-gal in si-NC and si-MALAT1 of H2O2-KGN + sEVs groups. N. YB-1 RIP was performed, and the enrichment of MALAT1 in YB-1 immunoprecipitation was assayed by qPCR analysis. IgG was used as negative control. O. The expression levels of MALAT1 in KGN cells treated with si-YB-1 were detected by qPCR at 0, 3, 6, and 9 h posttreatment with Actinomycin D. P. Cytoplasmic and nuclear fractions were extracted from KGN of Vector and oe-YB-1 groups and MALAT1 expression was analyzed by qPCR
Fig. 3
Fig. 3
MALAT1 functions as a ceRNA by directly sponging miR‐211-5p. A. qPCR analysis of miR-211-5p expression in H2O2-KGN. B-C. miR-211-5p expression in the GCs (B) and serum (C) of healthy people and patients with POF was detected by qPCR. D. The expression levels of miR-211-5p in KGN cells treated with si-MALAT1 were measured by qPCR. E. ROS in three groups of H2O2-KGN were assessed using DCFH-DA probes. The ROS‐positive apoptotic cells are indicated by green fluorescence. The nuclei (blue) were stained with DAPI. F. Immunohistochemistry staining of S-A-β-gal in inhibitor NC, inhibitor and si-MALAT1 + inhibitor and groups of H2O2-KGN. G. The difference expression of p21 and p53 in the H2O2-KGN of three groups was detected by Western blot. H. Schematic of pull-down assay with biotinylated miRNA. Enrichment of MALAT1 in HEK-293 cells after pull-down assay with biotinylated miR-211-5p. I. The expression of miR-211-5p in the H2O2-KGN of PBS, si-YB-1 sEVs and sEVs groups was detected by qPCR. J. qPCR analysis of miR-211-5p expression in H2O2-KGN + sEVs cells treated with si-MALAT1. K-L. The expression levels of miR-211-5p in H2O2-KGN cells treated with oe-YB-1 (K) and si-YB-1 (L) were measured by qPCR
Fig. 4
Fig. 4
FOXO3 is a direct downstream target of miR-211-5p. A. qPCR analysis of FOXO3 mRNA expression in H2O2-KGN cells. B. The relative FOXO3 mRNA expression was measured using qPCR in the GCs of healthy people and patients with POF. C-D. FOXO3 protein expression level was detected in H2O2-KGN cells (C) or the serum (D) of healthy people and patients with POF by western blot. E. ROS in si-NC, si-FOXO3 and si-FOXO3 + inhibitor of H2O2-KGN were assessed using DCFH-DA probes. The ROS‐positive apoptotic cells are indicated by green fluorescence. The nuclei (blue) were stained with DAPI. F. Immunohistochemistry staining of S-A-β-gal in si-NC, si-FOXO3 and si-FOXO3 + inhibitor groups. G. The difference expression of p21 and p53 in the KGN of three groups was detected by western blot. H-J. The relative FOXO3 protein expression was measured using western blot in different groups of H2O2-KGN. K. Enrichment of FOXO3 mRNA in HEK-293 cells after pull-down assay with biotinylated miR-211-5p. L. Wild type and mutant FOXO3 sequences were cloned into the pGL4 luciferase reporter vector and co-transfected with miR-211-5p into HEK-293 cells followed by dual luciferase assay. M. The expression of FOXO3 mRNA in the H2O2-KGN of PBS, si-YB-1 sEVs and sEVs groups was detected by qPCR. N. Western blot analysis of FOXO3 expression in H2O2-KGN + sEVs cells treated with si-MALAT1. O. Western blot detection of FOXO3 protein expression in KGN delivering oe-YB-1. P-Q. The expression levels of FOXO3 mRNA in H2O2-KGN cells treated with oe-YB-1 (P) and si-YB-1 (Q) were measured by qPCR
Fig. 5
Fig. 5
Therapeutic effect of YB-1 sEVs on POF. A. Representative IVIS images of rats injected with 100 μl PBS, 100 μg (in 100 μl) Dil-labeled sEVs via the tail vein. IVIS imaging was performed 24 h after injection. B-C. Ex vivo fluorescence imaging analysis of the distribution of the Dil-labeled sEVs in different organs, including the ovary, liver, spleen, heart, kidney, uterus and lung (B). Quantification of the fluorescence signal intensity in different organs (C). IVIS imaging was performed 6, 12, 24, 48, and 72 h after injection. D. Histopathological examination of different organs of rat injected with sEVs. E. Representative fluorescence microscopic images of the localization of Dil-labeled sEVs in ovary. Rat was injected with 100 μl Dil-labeled sEVs via tail vein and sacrificed 24 h after injection. F. Flow chart of the animal experiment. G. The weights of ovaries in the WT, POF + PBS and POF + si-YB-1 sEVs and POF + sEVs groups were measured. H. Representative outcomes of different groups. I. Histopathological examination of the ovaries in different groups. J. Primordial follicles, primary follicles, secondary follicles, and atretic follicles were observed in each group of rats
Fig. 6
Fig. 6
SEVs improve the symptoms of POF via sEVs/YB-1/MALAT1/miR-211-5p/FOXO3 axis. A. ROS in different treatment groups were assessed using DCFH-DA probes. The ROS‐positive apoptotic cells are indicated by green fluorescence. The nuclei (blue) were stained with DAPI. B. Immunohistochemistry staining of S-A-β-gal in different treatment groups. C. Enlarged images from representative immunohistochemistry photographs of YB-1 in different treatment groups. D. qPCR analysis of MALAT1 expression in different treatment groups. E. qPCR analysis of miR-211-5p expression in different treatment groups. F. Enlarged images from representative immunohistochemistry photographs of FOXO3 in different treatment groups
Fig. 7
Fig. 7
Schematic summary of the critical role of YB-1 in GCs expression and function

Similar articles

Cited by

References

    1. Akogullari D, Uluer ET, Vatansever HS. Investigation of the relation between follicular atresia and granulosa cells in terms of cell death mechanisms in premature ovarian failure model. Proc. 2018;2(25):1529 (Multidisciplinary Digital Publishing Institute).
    1. Ankrum J, Karp JM. Mesenchymal stem cell therapy: Two steps forward, one step back. Trends Mol Med. 2010;16(5):203–9. - PMC - PubMed
    1. Baar MP, Brandt RMC, Putavet DA, Klein JDD, Derks KWJ, Bourgeois BRM, et al. Targeted apoptosis of senescent cells restores tissue homeostasis in response to chemotoxicity and aging. Cell. 2017;169(1):132-147.e16. - PMC - PubMed
    1. Budkina KS, Zlobin NE, Kononova SV, Ovchinnikov LP, Babakov AV. Cold shock domain proteins: Structure and interaction with nucleic acids. Biochemistry (Mosc). 2020;85(Suppl 1):S1-19. - PubMed
    1. Burdon RH. Superoxide and hydrogen peroxide in relation to mammalian cell proliferation. Free Radic Biol Med. 1995;18(4):775–94. - PubMed

Publication types

MeSH terms