. 2024 May 14;96(19):7436-7443.
doi: 10.1021/acs.analchem.3c05441. Epub 2024 May 3.

Quartz Crystal Microbalance as a Holistic Detector for Quantifying Complex Organic Matrices during Liquid Chromatography: 2. Compound-Specific Isotope Analysis

Affiliations

Quartz Crystal Microbalance as a Holistic Detector for Quantifying Complex Organic Matrices during Liquid Chromatography: 2. Compound-Specific Isotope Analysis

Christopher Wabnitz et al. Anal Chem. .

Abstract

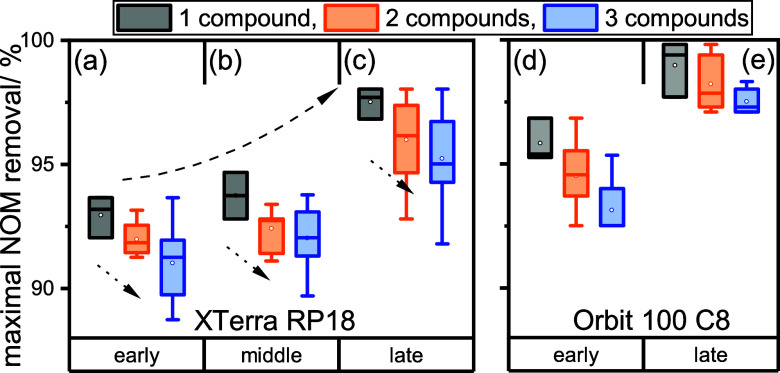
In carbon-compound-specific isotope analysis (carbon CSIA) of environmental micropollutants, purification of samples is often required to guarantee accurate measurements of a target compound. A companion paper has brought forward an innovative approach to couple a quartz crystal microbalance (QCM) with high-performance liquid chromatography (HPLC) for the online quantification of matrices during a gradient HPLC purification. This work investigates the benefit for isotope analysis of polar micropollutants typically present in environmental samples. Here, we studied the impact of the natural organic matter (NOM) on the isotopic integrity of model analytes and the suitability of the NOM-to-analyte ratio as a proxy for the sample purity. We further investigated limitations and enhancement of HPLC purification using QCM on C18 and C8 phases for single and multiple targets. Strong isotopic shifts of up to 3.3% toward the isotopic signature of NOM were observed for samples with an NOM-to-analyte ratio ≥10. Thanks to QCM, optimization of matrix removal of up to 99.8% of NOM was possible for late-eluting compounds. The efficiency of HPLC purification deteriorated when aiming for simultaneous purification of two or three compounds, leading to up to 2.5% less NOM removal. Our results suggest that one optimized HPLC purification can be achieved through systematic screening of 3 to 5 different gradients, thereby leading to a shift of the boundaries of accurate carbon CSIA by up to 2 orders of magnitude toward lower micropollutant concentrations.


Conflict of interest statement

The authors declare no competing financial interest.

Figures

Figure 1
Figure 1
(a) The isotope value of standard measurements of four different analytes (DEA: green, ATZ: black, DIA: red, CAF: blue) is plotted against the isotope value measured in extracts containing NOM in different CNOM/Canalyte ratios (10: triangle up, 20: triangle down, 50: circle, 100: diamond). The range of typical NOM isotope values (δ 13C = 27 ± 1‰) is highlighted (brown circle). (a1–a3) Enlarged areas of the four analytes. (a1) Gray: Extract with concentration of NOM equal to ratio 100 was subjected to HPLC cleanup using XTerra RP18 (see the HPLC gradient in Table S4). The respective fraction of DIA was collected, the solvents were evaporated, and NOM was reconstituted and spiked with DIA to reach an analyte concentration of 1667 nmol C/mL and a total volume equal to the original NOM extract (200 μL). (b1–b4) Correlation of the background intensity (m/z 44/mV) at the respective analyte retention time in the GC-c-IRMS chromatogram and the amount of NOM injected.
Figure 2
Figure 2
(a) Three out of the 22 measured gradients with varying % of CH3OH in the mobile phase until minute 7.5 (blue; 30, 40, 50, 60, 70, 80, or 90%) and minute 15 (gray; 60, 70, 80, or 90%). (b) Exemplary chromatogram (gradient 10–60–70) shows the analyte peaks constrained using UV/vis for CAF, DEA, SIM, and BOSC (dotted gray line) and NOM in %/min quantified using QCM dry mass sensing (black line). The amount of coeluting NOM during the analyte retention window is integrated (colored areas) and divided by the total amount of NOM measured to receive a number of the percentage of NOM coeluting with the analyte (corresponding color). (c–f) The NOM coelution in % is plotted for the 22 different gradients for 4 analytes [(c): CAF, (d): DEA, (e): SIM, (f): BOSC]. The second axis shows the CNOM/Canalyte ratio after the purification step corresponding to BOSC ratio in the original extract of 2383. The minima are encircled using a black dotted line, and the maxima are encircled using a black solid line.
Figure 3
Figure 3
Removal of NOM (in %) in the fraction of early-, middle-, or late-eluting compounds during the purification of one individual compound (1: black) or multiple compounds (2: orange, 3: blue) for both columns. The dashed upward arrow annotates the trend of elution regions early < middle < late, and the dotted downward arrow annotates the compound number trend 1 > 2 > 3.
Figure 4
Figure 4
Dependence of accurate isotope analysis on the analyte and NOM concentration in the real-world water sample for (a) BAM (early eluting) and (b) BOSC (late eluting) for different sample preparation strategies: SPE using Oasis HLB (black), plus an HPLC purification (red), or plus an optimized HPLC purification (blue).

References

    1. Elsner M.; Imfeld G. Compound-specific isotope analysis (CSIA) of micropollutants in the environment - current developments and future challenges. Curr. Opin. Biotechnol. 2016, 41, 60–72. 10.1016/j.copbio.2016.04.014. - DOI - PubMed
    1. Elsner M.; Jochmann M. A.; Hofstetter T. B.; Hunkeler D.; Bernstein A.; Schmidt T. C.; Schimmelmann A. Current challenges in compound-specific stable isotope analysis of environmental organic contaminants. Anal. Bioanal. Chem. 2012, 403, 2471–2491. 10.1007/s00216-011-5683-y. - DOI - PubMed
    1. Thullner M.; Centler F.; Richnow H. H.; Fischer A. Quantification of organic pollutant degradation in contaminated aquifers using compound specific stable isotope analysis – Review of recent developments. Org. Geochem. 2012, 42, 1440–1460. 10.1016/j.orggeochem.2011.10.011. - DOI
    1. Hofstetter T. B.; Schwarzenbach R. P.; Bernasconi S. M. Assessing transformation processes of organic compounds using stable isotope fractionation. Environ. Sci. Technol. 2008, 42, 7737–7743. 10.1021/es801384j. - DOI - PubMed
    1. Hofstetter T. B.; Berg M. Assessing transformation processes of organic contaminants by compound-specific stable isotope analysis. TrAC, Trends Anal. Chem. 2011, 30, 618–627. 10.1016/j.trac.2010.10.012. - DOI